
Recommended
Recommended
More Related Content
Similar to Modeling present and prospective distribution of Phyteuma genus in Carpathian region with machine learning techniques using open climatic and soil data
Similar to Modeling present and prospective distribution of Phyteuma genus in Carpathian region with machine learning techniques using open climatic and soil data (20)
More from Alexander Mkrtchian
More from Alexander Mkrtchian (9)
Recently uploaded
Recently uploaded (20)
Modeling present and prospective distribution of Phyteuma genus in Carpathian region with machine learning techniques using open climatic and soil data
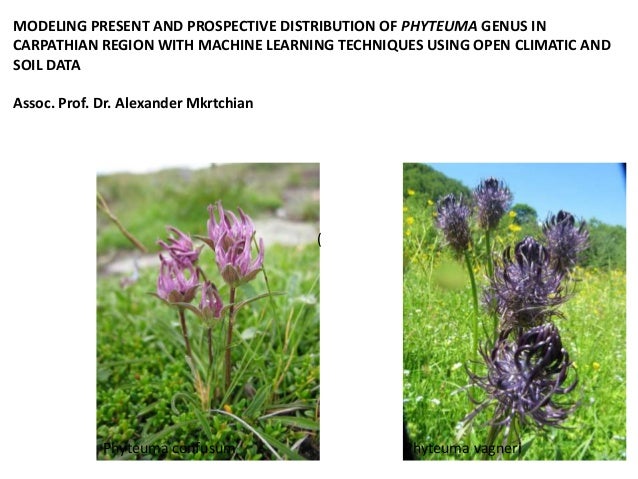
- 1. Phyteuma vagneri ( Phyteuma confusum MODELING PRESENT AND PROSPECTIVE DISTRIBUTION OF PHYTEUMA GENUS IN CARPATHIAN REGION WITH MACHINE LEARNING TECHNIQUES USING OPEN CLIMATIC AND SOIL DATA Assoc. Prof. Dr. Alexander Mkrtchian
- 2. Main problems in species distribution modeling Problem Solution Data of different formats, different quality, duplicated data Data preprocessing Presence-only data availale Introducing randomly distributed background data as a surrogate for absence data Data distribution violates normality assumption Using non-parametric methods (machine learning) Spatially autocorrelated data Explicit methods to account for spatial autocorrelation; rigorous testing of modeling results on test sets
- 3. • Mackey B. G., Nix H. A., Hutchinson M. F., Macmahon J. P., Fleming P. M. (1988). Assessing representativeness of places for conservation reservation and heritage listing // Environmental Management, 12 (4), pp. 501–514 • Franklin J. (1995). Predictive vegetation mapping: geographic modelling of biospatial patterns in relation to environmental gradients // Progress in Physical Geography, 1995, 19, pp. 474–499 • Guisan A.; Zimmermann N. E. (2000). Predictive habitat distribution models in ecology // Ecological Modelling, 135, pp. 147–186 • Elith J., Graham K. H., Anderson R. P. et al. (2006). Novel methods improve prediction of species’ distributions from occurrence data // Ecography, 29, pp. 129–151 • Elith J., Leathwick J. R., Hastie T. A. (2008). Working guide to boosted regression trees // Journal of Animal Ecology, 2008, 77, 802–813 • Elith J., Phillips S. J., Hastie T., Dudı´k M., Chee Y. En, Yates C. J. (2011). A statistical explanation of MaxEnt for ecologists // Diversity and Distributions, 17, pp. 43–57 • https://rspatial.org/raster/sdm/index.html Main theoretical works
- 4. • BIOCLIM – based on «ecological envelope» principle, calculating the probability of species in the attributes hyperspace • Maxent – based on minimizing relative entropy of probability densities in the attributes hyperspace • General linear models (GLM) • General additive models (GAM) • Artificial neural networks (ANN) • Random forest (RF) • Bootstrap aggregation (bagging) • Boosted regression trees (BRT) • Support vectors machines (SWM) Main types of models for species distribution modeling From Elith J., Graham K. H., Anderson R. P. et al. (2006). Novel methods improve prediction of species’ distributions from occurrence data // Ecography, 29, pp. 129–151
- 5. Model specifics and features selected have to be meaningful from an ecological viewpoint Predicted spatial pattern should look plausible from an expert viewpoint Residuals on test set has to be small and random Quality, size and spatial extent of data, as well as appropriate features selected are mostly more important than the choice of the concrete model and tuning of its parameters
- 6. Data obtained from GBIF for the Carpathian region contained 148 records of Phyteuma genus in total. After removing duplicates, 80 records have been kept. A double of observation records (160 points) were thus designated as background, with random coverage of geographic space inside study area. Six data points (3 from observed data and another 3 from simulated background data) have subsequently been removed due to omissions in predictors data.
- 7. Data on climatic conditions were derived from WorldClim database (1 km. sq. spatial resolution) There are layers of 19 bioclimatic variables, derived from monthly temperature and precipitation with a consideration to have biological significance. 17 out of 19 bioclimatic variables were taken out as predictive variables for SDM. For data on soil conditions, SoilGrids digital maps of soil properties were used (250 m spatial resolution) From 11 available physical and chemical soil properties, 4 were chosen as the most suitable predictors: soil acidity, organic carbon stock, cation exchange capacity, and total nitrogen. Among six standard depth intervals available, 15–30 cm depth interval was chosen as the most appropriate for the purpose.
- 8. • ML methods examined: Maxent, Random Forest, Artificial Neural Networks (ANN), Boosted Regression Trees. • Assessing the performance of the models and tuning their parameters: AUC and TSS criteria calculated for testing data with 6-fold cross- validation • Tools used: R programming language and software environment, SDMtune package
- 9. Method AUC (training) AUC (testing) TSS (training) TSS (testing) Maxent (ME) 0.8162 0.796 (0.0138) 0.6114 0.5938 (0.0252) Artificial neural networks (ANN) 0.9437 0.9369 (0.005) 0.7508 0.7891 (0.018) Random forest (RF) 1 0.9321 (0.0076) 1 0.7851 (0.0261) Boosted regression trees (BRT) 0.964 0.9304 (0.0062) 0.8145 0.775 (0.0162) Performance metrics of different SDM methods calculated on training dataset and with aforementioned testing procedure. For testing case, standard deviations are given in parentheses. Model AUC (training) AUC (testing) TSS (training) TSS (testing) Full set of 21 variables 0.9437 0.9369 (0.005) 0.7508 0.7891 (0.018) Reduced set of 6 variables 0.94 0.9381 (0.0036) 0.7384 0.7893 (0.0132) Performance metrics of ANN SDM method calculated with a full and reduced sets of predictive variables ANN method appears to work the best for the case
- 10. Relative occurrence probabilities (left) and predicted habitat (right) of Phyteuma
- 11. Predicted occurrence probabilities (left) and habitat area (right) of Phyteuma for year 2050 based on RCP 4.5 climate projections