
Depth of Edge Influence in a Madagascar Lowland Rainforest and Its Effects on Lemurs’ Abundance

 , , and
Abstract
:1. Introduction
2. Materials and Methods
2.1. Study Site
2.2. Survey Design
2.3. Vegetation Surveys
2.4. Lemur Surveys
2.5. Data Analysis
3. Results
3.1. Vegetation Surveys
3.2. Lemur Surveys
4. Discussion
4.1. Depth of Edge Influence
4.2. Lemur Edge Responses
4.3. Lemur Abundance
5. Conclusions
Author Contributions
Funding
Data Availability Statement
Acknowledgments
Conflicts of Interest
Appendix

| Species | Key Function | Expansion | AIC |
|---|---|---|---|
| Anosy mouse lemur | Half-normal | Simple polynomial | 603.6 |
| Cosine | 605.3 | ||
| Hazard-rate | Simple polynomial | 606.4 | |
| Cosine | 601.9 | ||
| Uniform | Simple polynomial | 604.5 | |
| Cosine | 606.8 | ||
| Collared brown lemur | Half-normal | Simple polynomial | 167.7 |
| Cosine | 168.0 | ||
| Hazard-rate | Simple polynomial | 168.4 | |
| Cosine | 168.9 | ||
| Uniform | Simple polynomial | 168.5 | |
| Cosine | 169.1 | ||
| Dwarf lemur | Half-normal | Simple polynomial | 50.7 |
| Cosine | 52.2 | ||
| Hazard-rate | Simple polynomial | 49.4 | |
| Cosine | 49.8 | ||
| Uniform | Simple polynomial | 49.7 | |
| Cosine | 50.0 | ||
| Madame Fleurette’s sportive lemur | Half-normal | Simple polynomial | 1058.0 |
| Cosine | 1059.4 | ||
| Hazard-rate | Simple polynomial | 1056.1 | |
| Cosine | 1057.2 | ||
| Uniform | Simple polynomial | 1059.1 | |
| Cosine | 1060.2 | ||
| Southern bamboo lemur | Half-normal | Simple polynomial | 123.8 |
| Cosine | 125.9 | ||
| Hazard-rate | Simple polynomial | 125.3 | |
| Cosine | 126.9 | ||
| Uniform | Simple polynomial | 125.1 | |
| Cosine | 126.7 | ||
| Southern woolly lemur | Half-normal | Simple polynomial | 287.2 |
| Cosine | 289.6 | ||
| Hazard-rate | Simple polynomial | 288.8 | |
| Cosine | 290.3 | ||
| Uniform | Simple polynomial | 289.1 | |
| Cosine | 289.8 |
| Clade | Order | Family | Species | Common Name | Edge (trees/ha) | Interior (trees/ha) |
|---|---|---|---|---|---|---|
| Magnoliids | Laurales | Lauraceae | Aspidostemon lacrimans | Viary | 2.5 | 0.3 |
| Cryptocarya sp. 1 | Remilaza | 0.6 | 0.0 | |||
| Cryptocarya sp. 2 | Tavolohazo | 20.2 | 15.9 | |||
| Ocotea racemosa | Varongy | 24.4 | 18.0 | |||
| Ocotea grayi | Valotry | 7.6 | 4.3 | |||
| Potameia incisa | Tsalela | 0.0 | 0.1 | |||
| Monimiaceae | Tambourissa religiosa | Ambora | 16.8 | 35.5 | ||
| Tambourissa thouvenotii | Bety | 9.8 | 7.3 | |||
| Magnoliales | Annonaceae | Fenerivia chapelieri | Hazaomby | 0.0 | 0.1 | |
| Monanthotaxis madagascariensis | Rangomafotry | 3.6 | 13.3 | |||
| Xylopia buxifolia | Fotsivavy | 17.8 | 16.1 | |||
| Myristicaceae | Brochoneura acumita | Mafotra | 91.8 | 104.2 | ||
| Monocots | Alismatales | Araceae | Pothos scandens | Mandrio | 0.0 | 1.0 |
| Arecales | Araliaceae | Cuphocarpus aculeatus | Tsitongampossa | 4.5 | 0.0 | |
| Neocussonia vantsilana | Voantsila | 23.2 | 19.7 | |||
| Polyscias pentamera | Batsiala | 1.3 | 0.7 | |||
| Arecaceae | Dypsis arenarum | Hirihiry | 0.0 | 2.3 | ||
| Dypsis lilacina | Telopoloambilany | 6.2 | 15.2 | |||
| Dypsis mananjarensis | Lafa | 0.9 | 3.2 | |||
| Dypsis nodifera | Tavilokoko | 0.0 | 0.3 | |||
| Dypsis prestoniana | Mangidy | 2.7 | 3.2 | |||
| Dypsis pustulata | Vonotry | 25.8 | 16.1 | |||
| Louvelia lakatra | Lakatry | 0.0 | 1.4 | |||
| Orania longisquama | Tsindro | 1.8 | 0.9 | |||
| Ravenala madagascariensis | Ravinala | 0.7 | 0.0 | |||
| Ravenea nana | Hanivo | 3.6 | 5.1 | |||
| Asparagales | Asparagaceae | Dracaena reflexa | Falinandro | 11.6 | 16.1 | |
| Iridaceae | Aristea angustifolia | Midinigiavy | 0.0 | 1.0 | ||
| Pandanales | Pandanaceae | Pandanus longistylus | Fandra | 123.9 | 105.1 | |
| Eudicots | Aquifoliales | Aquifoloaceae | Ilex mitis | Hazondrano | 30.3 | 34.0 |
| Asterales | Asteraceae | Brachylaena merana | Hazotona | 0.0 | 0.5 | |
| Centauropsis antanossi | Fotsivaliky | 0.0 | 1.7 | |||
| Boraginales | Boraginaceae | Ehretia seyrigii | Vatoa | 0.0 | 0.5 | |
| Brassicales | Capparaceae | Crateva obovata | Faritraty | 0.9 | 3.2 | |
| Buxales | Buxaceae | Buxus rabenantoandroi | Retsiriky | 0.0 | 0.7 | |
| Didymeles perrieri | Fanala | 0.0 | 0.3 | |||
| Caryophyllales | Asteropeiaceae | Asteropeia micraster | Fanolantolo | 0.0 | 0.3 | |
| Asteropeia multiflora | Fanolabemavao | 0.0 | 0.9 | |||
| Asteropeia rhopaloides | Fanola | 0.9 | 0.0 | |||
| Physenaceae | Physena madagascariensis | Retsonzo | 0.9 | 1.7 | ||
| Celastrales | Celastraceae | Brexia madagascariensis | Voakarepoky | 0.7 | 0.0 | |
| Brexiella sp. | Resilaitry | 0.0 | 0.5 | |||
| Cassine micrantha | Harambohazo | 0.0 | 0.5 | |||
| Polycardia libera | Tsimahasoky | 3.3 | 0.0 | |||
| Crossosomatales | Aphloiaceae | Aphloia theiformis | Fandramana | 15.2 | 12.9 | |
| Cucirbitales | Anisophylleaceae | Anisophyllea phallax | Hazomamy | 12.5 | 16.1 | |
| Dilleniales | Dilleniaceae | Dillenia triqueta | Varikanda | 13.4 | 9.6 | |
| Ericales | Ebenaceae | Diospyros sp. 1 | Hazomety | 45.5 | 62.0 | |
| Diospyros sp. 2 | Hazomasy | 9.8 | 5.1 | |||
| Lecythidaceae | Barringtonia racemosa | Kamboky | 2.0 | 0.0 | ||
| Primulaceae | Oncostemum sp. 1 | Hazotoho | 0.0 | 1.4 | ||
| Oncostemum sp. 2 | Mamotanylona | 4.6 | 8.3 | |||
| Sapotaceae | Capurodendron pervillei | Beladitra | 0.0 | 1.7 | ||
| Capurodendron sp. | Nanto | 57.0 | 53.7 | |||
| Chrysophyllum boivinianum | Rehiaky | 8.0 | 14.2 | |||
| Donella delphinensis | Hazomiteraky | 4.6 | 3.7 | |||
| Faucherea tampoloensis | Natoroboky | 0.7 | 0.3 | |||
| Mimusops coriacea | Tendrokazo | 2.7 | 3.2 | |||
| Sideroxylon tambolokoko | Tambolokoko | 1.3 | 0.3 | |||
| Fabales | Fabaceae | Albizia graveana | Fandrianakanga | 1.3 | 2.3 | |
| Albizia gummifera | Mendoravy | 1.8 | 27.5 | |||
| Calliandra thouarsiana | Menbolazo | 0.0 | 1.7 | |||
| Cynometra commersoniana | Voariotry | 2.7 | 1.8 | |||
| Cynometra madagascariensis | Mampay | 60.6 | 21.1 | |||
| Dalbergia baronii | Manary | 1.8 | 0.9 | |||
| Dalbergia delphinensis | Tombobisy | 5.3 | 1.8 | |||
| Dalbergia madagascariensis | Andromena | 0.0 | 0.5 | |||
| Indigofera perrieri | Hengitry | 2.0 | 0.0 | |||
| Intsia bijuga | Harandrato/Intsy | 2.5 | 2.6 | |||
| Mimosa latispinosa | Romino | 0.0 | 1.4 | |||
| Phylloxylon sp. | Mahasalama | 0.0 | 1.7 | |||
| Sylvichadsia grandiflora | Fanamo | 17.8 | 15.2 | |||
| Viguieranthus brevipennatus | Kingiza | 0.0 | 0.5 | |||
| Viguieranthus glandulosus | Hazomallany | 9.8 | 6.4 | |||
| Gentianales | Apocynaceae | Carissa spinarum | Hazolahy | 0.7 | 0.0 | |
| Mascarenhasia speciosa | Tsilondrano | 0.0 | 0.9 | |||
| Petchia madagascariensis | Kabokala | 9.8 | 18.4 | |||
| Plectaneia thouarsii | Hazomanahaky | 0.0 | 0.7 | |||
| Sarcostemma viminale | Bemavao | 0.0 | 0.9 | |||
| Loganiaceae | Anthocleista madagascariensis | Lendemilahy | 1.8 | 2.8 | ||
| Rubiaceae | Bremeria trichophlebia | Tangalavo | 0.0 | 0.5 | ||
| Bremeria scabridior | Fantora | 1.8 | 7.8 | |||
| Breonia fragifera | Hafovalotry | 0.0 | 1.4 | |||
| Canephora madagascariensis | Hazongalala | 14.3 | 15.2 | |||
| Coffea sp. | Manibary | 10.7 | 9.2 | |||
| Enterospermum sp. | Mangavoa | 0.0 | 0.9 | |||
| Gaertnera macrostipula | Hazondengo | 10.7 | 11.0 | |||
| Gaertnera raphaelii | Tanatananala | 0.0 | 0.5 | |||
| Hyperacanthus poivrei | Taolana | 41.0 | 39.5 | |||
| Hyperacanthus rajeriarisonae | Taolanampossy | 0.9 | 1.8 | |||
| Ixora sp. | Masosoraky | 0.0 | 1.4 | |||
| Janotia macrostipula | Valopangady | 1.8 | 0.5 | |||
| Peponidium pallens | Robelo | 2.0 | 0.7 | |||
| Psychotria aegialodes | Hazombato | 1.3 | 0.0 | |||
| Psychotria glaucifolia | Fotsivoho | 2.0 | 0.0 | |||
| Pyrostria media | Fantsikaitry | 42.8 | 46.4 | |||
| Rothmannia sp. 1 | Taolanamainty | 3.3 | 0.0 | |||
| Rothmannia sp. 2 | Taolanambariky | 1.8 | 0.7 | |||
| Rothmannia thouarsii | Valopossy | 1.3 | 0.0 | |||
| Saldinia proboscidea | Lengohazo | 1.3 | 1.0 | |||
| Saldinia sp. | Hazondranoka | 0.0 | 0.9 | |||
| Lamiales | Bignoniaceae | Phyllarthron articulatum | Zaha | 0.0 | 0.5 | |
| Phyllarthron ilicifolium | Zahambe | 0.0 | 0.3 | |||
| Rhodocolea racemosa | Sikondrokondro | 0.0 | 0.3 | |||
| Verbenaceae | Coelocarpum humbertii | Rombavola | 0.0 | 1.0 | ||
| Lamiaceae | Vitex beraviensis | Hazomahavelo | 0.0 | 0.7 | ||
| Laurales | Monimiaceae | Decarydendron sp. | Madinigavy | 0.9 | 0.0 | |
| Malpighiales | Chrysobalanaceae | Magnistipula tamenaka | Tamenandrano | 0.0 | 1.0 | |
| Clusiaceae | Calophyllum inophyllum | Vitao | 34.8 | 31.7 | ||
| Garcinia aphanophlebia | Ditsaky | 27.6 | 24.8 | |||
| Garcinia madagascariensis | Betsivo | 0.0 | 0.3 | |||
| Garcinia pauciflora | Akily | 1.3 | 0.7 | |||
| Garcinia verrucosa | Zambo | 8.9 | 12.9 | |||
| Symphonia tanalensis | Haziny | 33.9 | 44.1 | |||
| Erythroxylaceae | Erythroxylum capitatum | Menahihy | 67.7 | 56.0 | ||
| Euphorbiaceae | Acalypha sp. | Maintsoravy | 1.3 | 1.0 | ||
| Anthostema madagascariensis | Bamby | 2.7 | 17.0 | |||
| Croton cassinoides | Tolaky | 0.7 | 0.0 | |||
| Croton louvelii | Singena | 3.6 | 2.8 | |||
| Drypetes madagascariensis | Remboky | 2.0 | 0.0 | |||
| Macaranga cuspidata | Talaka | 0.0 | 0.3 | |||
| Macaranga obovata | Mokarana | 12.5 | 7.8 | |||
| Suregada adenophora | Kalavelo | 10.7 | 6.0 | |||
| Hypericaceae | Harungana madagascariensis | Haronga | 6.2 | 1.8 | ||
| Psorospermum brachypodum | Harongampanihy | 3.6 | 4.6 | |||
| Ochnaceae | Ouratea anceps | Hazondraotry | 26.7 | 24.8 | ||
| Ouratea sp. | Marandravy | 4.6 | 1.4 | |||
| Phyllanthaceae | Cleistanthus boivinianus | Tainbarika | 9.8 | 12.9 | ||
| Flueggea sp. | Tsimarefy | 0.9 | 0.9 | |||
| Thecacoris madagascariensis | Hazondranoha | 0.0 | 2.3 | |||
| Uapaca thouarsii | Voapaky | 85.6 | 83.1 | |||
| Wielandia leandriana | Votakala | 18.7 | 19.3 | |||
| Wielandia mimosoides | Korofoky | 16.9 | 16.5 | |||
| Salicaceae | Calantica sp. | Marotana | 0.0 | 0.5 | ||
| Homalium axillare | Lapivahatry | 2.7 | 18.8 | |||
| Homalium brevipedunculatum | Roandrano | 2.0 | 0.7 | |||
| Homalium lucidum | Tsilavimbinanto | 1.8 | 1.8 | |||
| Homalium planiflorum | Hazofotsy | 98.0 | 63.4 | |||
| Ludia antanosarum | Fantsikoho | 1.3 | 1.0 | |||
| Ludia ludiifolia | Hazofotsindroka | 1.3 | 0.0 | |||
| Scolopia erythrocarpa | Zora | 21.4 | 31.7 | |||
| Scolopia orientalis | Tsimalanilamba | 2.7 | 0.9 | |||
| Violaceae | Rinorea angustifolia | Voafontsy | 1.3 | 0.3 | ||
| Rinorea arborea | Hazondomohy | 0.0 | 0.3 | |||
| Malvales | Malvaceae | Dombeya oblongifolia | Hafomena | 10.7 | 12.9 | |
| Dombeya antsianakensis | Valimafy | 16.9 | 10.6 | |||
| Dombeya australis | Berehoky | 3.6 | 1.4 | |||
| Grewia apetala | Akolahikafitra | 0.0 | 0.5 | |||
| Grewia cuneifolia | Hafopossy | 2.7 | 4.6 | |||
| Grewia sp. | Vaoreoky | 1.3 | 0.3 | |||
| Sarcolaenaceae | Leptolaena pauciflora | Fonto | 1.8 | 3.2 | ||
| Schizolaena exinvolucrata | Sokazo | 1.3 | 0.0 | |||
| Sphaerosepalaceae | Rhopalocarpus coriaceus | Hazondandy | 9.8 | 2.8 | ||
| Combretaceae | Combretum grandidieri | Tamenaroanga | 0.0 | 1.0 | ||
| Combretum subumbellatum | Tamenakanga | 1.3 | 1.0 | |||
| Combretum villosum | Voatotkala | 0.0 | 1.4 | |||
| Terminalia fatraea | Fatra | 0.0 | 1.0 | |||
| Terminalia cephalota | Beranoampo | 0.0 | 1.4 | |||
| Melastomataceae | Memecylon longipetalum | Tomizo | 6.2 | 10.6 | ||
| Myrtaceae | Eugenia cloiselii | Roapasy | 10.7 | 17.0 | ||
| Eugenia sp. 1 | Mahalaza | 0.0 | 0.3 | |||
| Eugenia sp. 2 | Robavy | 16.0 | 17.4 | |||
| Syzygium sp. | Rotry | 77.5 | 93.2 | |||
| Oxalidales | Cunoniaceae | Weinmannia baehniana | Ringitry | 0.9 | 1.8 | |
| Weinmannia stenostachya | Lalo | 16.0 | 11.0 | |||
| Elaeocarpaceae | Sloanea rhodantha | Voandoza | 1.3 | 1.0 | ||
| Proteales | Proteaceae | Dilobeia tenuinervis | Hivao | 0.9 | 3.2 | |
| Dilobeia thouarsii | Tamenaky | 51.7 | 34.9 | |||
| Faurea forficuliflora | Tolabao | 0.7 | 0.0 | |||
| Rosales | Cunoniaceae | Pterophylla rutenbergii | Hazomena | 0.7 | 0.0 | |
| Moraceae | Maillardia montana | Homamata | 0.7 | 0.3 | ||
| Streblus dimepate | Dipaty | 9.8 | 8.7 | |||
| Treculia africana | Tsarepaly | 0.0 | 1.4 | |||
| Trilepisium madagascariensis | Vetitindaza | 0.0 | 1.4 | |||
| Sapindales | Anacardiaceae | Baronia taratana | Fonofononanahary | 0.7 | 0.0 | |
| Micronychia bemangidiensis | Taranta | 8.0 | 5.1 | |||
| Poupartia chapelieri | Sisikandrongo | 1.3 | 1.0 | |||
| Soreindeia madagascariensis | Voatsiringy | 2.0 | 0.0 | |||
| Burseraceae | Canarium boivinii | Haramy | 15.2 | 7.3 | ||
| Meliaceae | Astrotrichilia rakodomena | Rakodimena | 2.0 | 0.0 | ||
| Malleastrum sp. | Mirangasoa | 0.0 | 0.5 | |||
| Neobeguea leandreana | Hazolava | 0.0 | 0.5 | |||
| Neobeguea mahafaliensis | Bemahova | 0.0 | 0.5 | |||
| Turraea sp. | Tandria | 0.0 | 0.9 | |||
| Rutaceae | Vepris ampody | Ampodinala | 3.3 | 0.0 | ||
| Vepris elliotii | Ampoly | 1.3 | 1.0 | |||
| Vepris fitoravina | Fitoravina | 1.7 | 6.4 | |||
| Vepris macrophylla | Beravy | 1.3 | 0.0 | |||
| Zanthoxylum madagascariense | Monongo | 0.9 | 0.0 | |||
| Sapindaceae | Allophyllus decaryi | Malamaravy | 0.0 | 0.7 | ||
| Cardiophyllariopsis perrieri | Kafatra | 0.7 | 0.0 | |||
| Plagioscyphus sp. | Takombohazo | 2.0 | 0.0 | |||
| Tina fulvinervis | Vilo | 0.0 | 1.4 | |||
| Tina striata | Hazomoro | 0.0 | 0.3 | |||
| Tina thouarsiana | Sanirambaza | 6.2 | 8.7 | |||
| Tinopsis conjugata | Sanira | 33.0 | 48.7 | |||
| Simaroubaceae | Quassia indica | Mangaroky | 46.3 | 60.1 | ||
| Solanales | Convolvulaceae | Humbertia madagascariensis | Hendranendra | 8.0 | 4.1 | |
| NA | NA | NA | ? | Bemisiry | 0.7 | 0.0 |
| ? | Latakasosoa | 0.7 | 0.0 | |||
| ? | Marovola | 0.0 | 3.2 | |||
| ? | Masoranonandroa | 0.7 | 1.4 | |||
| ? | Palimisy | 6.2 | 0.0 |
| Response Variable | Response Variable | Predictor | Estimate | Std. Error | Z Value | p Value |
|---|---|---|---|---|---|---|
| Anosy mouse lemur | Groups | Intercept | 0.65 | 0.13 | 5.08 ** | <0.001 |
| Interior | −0.42 | 0.16 | −2.60 ** | 0.009 | ||
| Individuals | Intercept | 0.69 | 0.13 | 5.38 ** | <0.001 | |
| Interior | −0.44 | 0.16 | −2.74 ** | 0.006 | ||
| Collared brown lemur | Groups | Intercept | −1.68 | 0.22 | −7.72 ** | <0.001 |
| Interior | 0.62 | 0.25 | 2.54 * | 0.011 | ||
| Individuals | Intercept | −0.22 | 0.20 | −1.09 | 0.274 | |
| Interior | 0.69 | 0.22 | 3.08 ** | 0.002 | ||
| Dwarf lemur | Groups | Intercept | −0.92 | 0.31 | −2.97 ** | 0.003 |
| Interior | −0.51 | 0.40 | −1.30 | 0.194 | ||
| Individuals | Intercept | −0.92 | 0.32 | −2.91 ** | 0.004 | |
| Interior | −0.36 | 0.39 | −0.92 | 0.359 | ||
| Madame Fleurette’s sportive lemur | Groups | Intercept | 0.36 | 0.11 | 3.20 ** | 0.001 |
| Interior | 0.48 | 0.13 | 3.70 ** | <0.001 | ||
| Individuals | Intercept | 0.45 | 0.11 | 4.11 ** | <0.001 | |
| Interior | 0.49 | 0.13 | 3.91 ** | <0.001 | ||
| Southern bamboo lemur | Groups | Intercept | −1.32 | 0.20 | −6.46 ** | <0.001 |
| Interior | −0.29 | 0.26 | −1.11 | 0.267 | ||
| Individuals | Intercept | −0.29 | 0.22 | −1.31 | 0.192 | |
| Interior | −0.81 | 0.29 | −2.74 ** | 0.006 | ||
| Southern woolly lemur | Groups | Intercept | 0.11 | 0.08 | 1.35 | 0.176 |
| Interior | −0.80 | 0.12 | −6.80 ** | <0.001 | ||
| Individuals | Intercept | 0.43 | 0.10 | 4.43 ** | <0.001 | |
| Interior | −0.81 | 0.14 | −5.95 ** | <0.001 |
References
- Harris, L.D. Edge effects and conservation of biotic diversity. Conserv. Biol. 1988, 2, 330–332. [Google Scholar] [CrossRef]
- Murcia, C. Edge effects in fragmented forests: Implications for conservation. Trends Ecol. Evol. 1995, 10, 58–62. [Google Scholar] [CrossRef] [PubMed]
- Pfeifer, M.; Lefebvre, V.; Peres, C.A.; Banks-Leite, C.; Wearn, O.R.; Marsh, C.J.; Butchart, S.H.M.; Arroyo-Rodríguez, V.; Barlow, J.; Cerezo, A.; et al. Creation of forest edges has a global impact on forest vertebrates. Nature 2017, 551, 187. [Google Scholar] [CrossRef] [PubMed] [Green Version]
- Malcolm, J.R. Biomass and diversity of small mammals in Amazonian forest fragments. In Tropical Forest Remnants: Ecology, Management, and Conservation of Fragmented Communities; Laurance, W.F., Bierregaard, O., Eds.; University of Chicago Press: Chicago, IL, USA, 1997; pp. 207–221. [Google Scholar]
- Ries, L.; Fletcher, R.J.; Battin, J.; Sisk, T.D. Ecological responses to habitat edges: Mechanisms, models, and variability explained. Annu. Rev. Ecol. Evol. Syst. 2004, 35, 491–522. [Google Scholar] [CrossRef] [Green Version]
- Lehman, S.; Rajaonson, A.; Day, S. Edge effects on the density of Cheirogaleus Major. Int. J. Primatol. 2006, 27, 1569–1588. [Google Scholar] [CrossRef] [Green Version]
- Lehman, S.; Rajaonson, A.; Day, S. Edge effects and their influence on lemur density and distribution in southeast Madagascar. Am. J. Phys. Anthropol. 2006, 129, 232–241. [Google Scholar] [CrossRef]
- Chapman, C.A.; Speirs, M.L.; Gillespie, T.R.; Holland, T.; Austad, K.M. Life on the edge: Gastrointestinal parasites from forest edge and interior primate groups. Am. J. Primatol. 2006, 68, 397–409. [Google Scholar] [CrossRef]
- Sobhani, P.; Esmaeilzadeh, H.; Barghjelveh, S.; Sadeghi, S.M.M.; Marcu, M.V. Habitat integrity in protected areas threatened by LULC changes and fragmentation: A case study in Tehran province, Iran. Land 2022, 11, 6. [Google Scholar] [CrossRef]
- Chasko, G.G.; Gates, J.E. Avian habitat suitability along a transmission-line corridor in an oak hickory forest region. Wildl. Monogr. 1982, 82, 1–41. [Google Scholar]
- Curran, L.M.; Caniago, I.; Paoli, G.D.; Astiani, D.; Kusneti, M.; Leighton, M.; Nirarita, C.E.; Haeruman, H. Impact of El Niño and logging on canopy tree recruitment in Borneo. Science 1999, 286, 2184–2188. [Google Scholar] [CrossRef]
- Laurance, W.F.; Delamonica, P.; Laurance, S.G.; Vasconcelos, H.L.; Lovejoy, T.E. Rainforest fragmentation kills big trees. Nature 2000, 404, 836. [Google Scholar] [CrossRef] [PubMed]
- Farris, Z.J.; Karpanty, S.M.; Ratelolahy, F.; Kelly, M.J. Predator-primate distribution, activity, and co-occurrence in relation to habitat and human activity across fragmented and contiguous forests in northeastern Madagascar. Int. J. Primatol. 2014, 35, 859–880. [Google Scholar] [CrossRef]
- Lenz, B.B.; Jack, K.M.; Spironello, W.R. Edge effects in the primate community of the biological dynamics of Forest Fragments Project, Amazonas, Brazil. Am. J. Phys. Anthropol. 2014, 155, 436–446. [Google Scholar] [CrossRef] [PubMed]
- Laurance, W.F. Reflections on the tropical deforestation crisis. Biol. Conserv. 1999, 91, 109–117. [Google Scholar] [CrossRef]
- Cowie, R.H.; Bouchet, P.; Fontaine, B. The Sixth Mass Extinction: Fact, fiction or speculation? Biol. Rev. 2022, 97, 640–663. [Google Scholar] [CrossRef]
- Haddad, N.M.; Brudvig, L.A.; Clobert, J.; Davies, K.F.; Gonzalez, A.; Holt, R.D.; Lovejoy, T.E.; Sexton, J.O.; Austin, M.P.; Collins, C.D.; et al. Habitat fragmentation and its lasting impact on Earth’s ecosystems. Sci. Adv. 2015, 1, e1500052. [Google Scholar] [CrossRef] [Green Version]
- Brinck, K.; Fischer, R.; Groeneveld, J.; Lehmann, S.; Dantas De Paula, M.; Pütz, S.; Sexton, J.O.; Song, D.; Huth, A. High resolution analysis of tropical forest fragmentation and its impact on the global carbon cycle. Nat. Commun. 2017, 8, 14855. [Google Scholar] [CrossRef] [Green Version]
- Restrepo, C.; Vargas, A. Seeds and seedlings of two neotropical montane under-story shrubs respond differently to anthropogenic edges and treefall gaps. Oecologia 1999, 119, 419–426. [Google Scholar] [CrossRef]
- Maeda, E.E.; Nunes, M.H.; Calders, K.; Mendes de Moura, Y.; Raumonen, P.; Tuomisto, H.; Verley, P.; Vincent, G.; Zuquim, G.; Camargo, J.L. Shifts in structural diversity of Amazonian forest edges detected using terrestrial laser scanning. Remote Sens. Environ. 2022, 271, 112895. [Google Scholar] [CrossRef]
- Lehman, S.; Rajaonson, A.; Day, S. Lemur responses to edge effects in the Vohibola III classified forest, Madagascar. Am. J. Primatol. 2006, 68, 293–299. [Google Scholar] [CrossRef]
- Fowler, H.; Silva, C.; Venticinque, E. Size, taxonomic and biomass distributions of flying insects in central Amazonia: Forest edge vs. understory. Rev. Biol. Trop. 1993, 41, 755–760. [Google Scholar]
- Grow, N.; Gursky, S.; Duma, Y. Altitude and forest edges influence the density and distribution of pygmy tarsiers (Tarsius pumilus). Am. J. Primatol. 2013, 75, 464–477. [Google Scholar] [CrossRef] [PubMed]
- Ganzhorn, J. Low-level forest disturbance effects on primary production, leaf chemistry, and lemur populations. Ecology 1995, 76, 2084–2096. [Google Scholar] [CrossRef]
- Campera, M.; Balestri, M.; Besnard, F.; Phelps, M.; Rakotoarimanana, F.; Nijman, V.; Nekaris, K.; Ganzhorn, J.U.; Donati, G. The influence of seasonal availability of young leaves on dietary niche separation in two ecologically similar folivorous lemurs. Folia Primatol. 2021, 92, 139–150. [Google Scholar] [CrossRef] [PubMed]
- Bolt, L.M.; Schreier, A.L.; Voss, K.A.; Sheehan, E.A.; Barrickman, N.L.; Pryor, N.P.; Barton, M.C. The influence of anthropogenic edge effects on primate populations and their habitat in a fragmented rainforest in Costa Rica. Primates 2018, 59, 301–311. [Google Scholar] [CrossRef]
- Lehman, S.M.; Mercado Malabet, F. Seasonal variations in lemur edge proximity in South-Eastern Madagascar. Int. J. Primatol. 2022, 43, 657–676. [Google Scholar] [CrossRef]
- Andriatsitohaina, B.; Romero-Mujalli, D.; Ramsay, M.S.; Kiene, F.; Rasoloharijaona, S.; Rakotondravony, R.; Lehman, S.M.; Radespiel, U. Effects of habitat edges on vegetation structure and the vulnerable golden-brown mouse lemur (Microcebus ravelobensis) in northwestern Madagascar. BMC Ecol. 2020, 20, 69. [Google Scholar] [CrossRef]
- Schreier, A.L.; Voss, K.A.; Bolt, L.M. A mathematical modelling approach to functionally defining forest edge and its utility for primate behavioural edge effects. Int. J. Primatol. 2022, 43, 460–479. [Google Scholar] [CrossRef]
- Harper, K.A.; Macdonald, S.E.; Burton, P.; Chen, J.; Brosofsky, K.D.; Saunders, S.; Euskirchen, E.S.; Roberts, D.; Jaiteh, M.S.; Esseen, P.-A. Edge influence on forest structure and composition in fragmented landscapes. Conserv. Biol. 2005, 19, 1–15. [Google Scholar] [CrossRef]
- Myers, N.; Mittermeier, R.A.; Mittermeier, C.G.; da Fonseca, G.A.B.; Kent, J. Biodiversity hotspots for conservation priorities. Nature 2000, 403, 853–858. [Google Scholar] [CrossRef]
- Schwitzer, C.; Mittermeier, R.A.; Johnson, S.E.; Donati, G.; Irwin, M.; Peacock, H.; Ratsimbazafy, J.; Razafindramanana, J.; Louis, E.E., Jr.; Chikhi, L.; et al. Averting lemur extinctions amid Madagascar’s political crisis. Science 2014, 343, 842–843. [Google Scholar] [CrossRef] [PubMed] [Green Version]
- Gade, D.W. Deforestation and its effects in highland Madagascar. Mt. Res. Dev. 1996, 16, 101–116. [Google Scholar] [CrossRef]
- Harper, G.; Steininger, M.; Juhn, D.; Hawkins, F.; Tucker, C. Fifty years of deforestation and forest fragmentation in Madagascar. Environ. Conserv. 2007, 34, 325–333. [Google Scholar] [CrossRef]
- Vieilledent, G.; Grinand, C.; Rakotomalala, F.A.; Ranaivosoa, R.; Rakotoarijaona, J.-R.; Allnutt, T.F.; Achard, F. Combining global tree cover loss data with historical national forest-cover maps to look at six decades of deforestation and forest fragmentation in Madagascar. Biol. Conserv. 2018, 222, 189–197. [Google Scholar] [CrossRef]
- Campera, M.; Phelps, M.; Besnard, F.; Balestri, M.; Eppley, T.M.; Nijman, V.; Donati, G. Does forest management and researchers’ presence reduce hunting and forest exploitation by local communities in Tsitongambarika, south-east Madagascar? Oryx 2019, 53, 677–686. [Google Scholar] [CrossRef]
- Malcolm, J.R.; Valenta, K.; Lehman, S.M. Edge effects in tropical dry forests of Madagascar: Additivity or synergy? Landsc. Ecol. 2017, 32, 327–341. [Google Scholar] [CrossRef]
- Hyde, S.R. Behavioural Ecology and Conservation of the Anosy Mouse Lemur (Microcebus tanost) in the Littoral Forests of Southeastern Madagascar. Ph.D. Dissertation, Oxford Brookes University, Oxford, UK, 2021. [Google Scholar]
- Schmid, J.; Speakman, J.R. Daily energy expenditure of the grey mouse lemur (Microcebus murinus): A small primate that uses torpor. J. Comp. Physiol. B 2000, 170, 633–641. [Google Scholar] [CrossRef]
- Farris, Z.J.; Morelli, T.L.; Sefczek, T.; Wright, P.C. Comparing ayeaye (Daubentonia madagascariensis) presence and distribution between degraded and non-degraded forest within Ranomafana National Park. Madagascar. Folia Primatol. 2011, 82, 94–106. [Google Scholar] [CrossRef]
- Donati, G.; Kesch, K.; Ndremifidy, K.; Schmidt, S.L.; Ramanamanjato, J.B.; Borgognini-Tarli, S.M.; Ganzhorn, J.U. Better few than hungry: Flexible feeding ecology of collared lemurs Eulemur collaris in littoral forest fragments. PLoS ONE 2011, 6, e19807. [Google Scholar] [CrossRef] [Green Version]
- Dausmann, K.H.; Glos, J.; Ganzhorn, J.U.; Heldmaier, G. Hibernation in the tropics: Lessons from a primate. J. Comp. Physiol. B 2005, 175, 147–155. [Google Scholar] [CrossRef]
- Fietz, J.; Ganzhorn, J.U. Feeding ecology of the hibernating primate Cheirogaleus medius: How does it get so fat? Oecologia 1999, 121, 157–164. [Google Scholar] [CrossRef] [PubMed]
- Warren, R.D.; Crompton, R.H. Locomotor ecology of Lepilemur edwardsi and Avahi occidentalis. Am. J. Phys. Anthropol. 1997, 104, 471–486. [Google Scholar] [CrossRef]
- Eppley, T.M.; Donati, G.; Ganzhorn, J.U. Determinants of terrestrial feeding in an arboreal primate: The case of the southern bamboo lemur (Hapalemur meridionalis). Am. J. Phys. Anthropol. 2016, 161, 328–342. [Google Scholar] [CrossRef] [PubMed]
- Eppley, T.M.; Verjans, E.; Donati, G. Coping with low-quality diets: A first account of the feeding ecology of the southern gentle lemur, Hapalemur meridionalis, in the Mandena littoral forest, southeast Madagascar. Primates 2011, 52, 7–13. [Google Scholar] [CrossRef] [PubMed]
- Eppley, T.M.; Santini, L.; Tinsman, J.C.; Donati, G. Do functional traits offset the effects of fragmentation? The case of large-bodied diurnal lemur species. Am. J. Primatol. 2020, 82, e23104. [Google Scholar] [CrossRef]
- Bezanson, M.; Stowe, R.; Watts, S.M. Reducing the ecological impact of field research. Am. J. Primatol. 2013, 75, 1–9. [Google Scholar] [CrossRef]
- Barelli, C.; Mundry, R.; Araldi, A.; Hodges, K.; Rocchini, D.; Rovero, F. Modeling primate abundance in complex landscapes: A case study from the Udzungwa Mountains of Tanzania. Int. J. Primatol. 2015, 36, 209–226. [Google Scholar] [CrossRef]
- Buckland, S.T.; Anderson, D.R.; Burnham, K.P.; Laake, J.L.; Borchers, D.L.; Thomas, L. Introduction to Distance Sampling: Estimating Abundance of Biological Populations; Oxford University Press: Oxford, UK, 2001. [Google Scholar]
- Blanco, M.B.; Dausmann, K.H.; Ranaivoarisoa, J.F.; Yoder, A.D. Underground hibernation in a primate. Sci. Rep. 2013, 3, 1768. [Google Scholar] [CrossRef] [Green Version]
- Dunn, P.K.; Smyth, G.K. Generalized Linear Models with Examples in R; Springer: New York, NY, USA, 2018. [Google Scholar]
- Thomas, L.; Buckland, S.T.; Rexstad, E.A.; Laake, J.L.; Strindberg, S.; Hedley, S.L.; Bishop, J.R.B.; Marques, T.A.; Burnham, K.P. Distance software: Design and analysis of distance sampling surveys for estimating population size. J. Appl. Ecol. 2010, 47, 5–14. [Google Scholar] [CrossRef] [Green Version]
- Murphy, A.J.; Farris, Z.J.; Karpanty, S.; Ratelolahy, F.; Kelly, M.J. Estimating encounter rates and densities of three lemur species in northeastern Madagascar. Int. J. Primatol. 2016, 37, 371–389. [Google Scholar] [CrossRef]
- Baker, S.C.; Barmuta, L.A.; McQuillan, P.B.; Richardson, A.M.M. Estimating edge effects on ground-dwelling beetles at clearfelled non-riparian stand edges in Tasmanian wet eucalypt forest. For. Ecol. Manag. 2007, 239, 92–101. [Google Scholar] [CrossRef]
- Urbina-Cardona, J.N.; Olivares-Pérez, M.; Reynoso, V.H. Herpetofauna diversity and microenvironment correlates across a pasture–edge–interior ecotone in tropical rainforest fragments in the Los Tuxtlas Biosphere Reserve of Veracruz, Mexico. Biol. Conserv. 2006, 132, 61–75. [Google Scholar] [CrossRef]
- Eppley, T.M.; Balestri, M.; Campera, M.; Rabenantoandro, J.; Ramanamanjato, J.-B.; Randriatafika, F.; Ganzhorn, J.U.; Donati, G. Ecological flexibility as measured by the use of pioneer and exotic plants by two lemurids: Eulemur collaris and Hapalemur meridionalis. Int. J. Primatol. 2017, 38, 338–357. [Google Scholar] [CrossRef] [Green Version]
- Campera, M.; Balestri, M.; Chimienti, M.; Nijman, V.; Nekaris, A.; Donati, G. Temporal niche separation between the two ecologically similar nocturnal primates Avahi meridionalis and Lepilemur fleuretae. Behav. Ecol. Sociobiol. 2019, 73, 55. [Google Scholar] [CrossRef]
- Norscia, I.; Ramanamanjato, J.B.; Ganzhorn, J.U. Feeding patterns and dietary profile of nocturnal southern woolly lemurs (Avahi meridionalis) in Southeast Madagascar. Int. J. Primatol. 2012, 33, 150–167. [Google Scholar] [CrossRef]
- Campera, M. Ecological Flexibility and Conservation of Fleurette’s Sportive Lemur, Lepilemur fleuretae, in the Lowland Rainforest of Ampasy, Tsitongambarika Protected Area (Unpublished Doctoral Dissertation); Oxford Brookes University: Oxford, UK, 2018. [Google Scholar]
- Balko, E.A.; Underwood, H.B. Effects of forest structure and composition on food availability for Varecia variegata at Ranomafana National Park, Madagascar. Am. J. Primatol. 2005, 66, 45–70. [Google Scholar] [CrossRef]
- Donati, G.; Bollen, A.; Borgognini-Tarli, S.M.; Ganzhorn, J.U. Feeding over the 24-hour cycle: Dietary flexibility of cathemeral collared lemurs (Eulemur collaris). Behav. Ecol. Sociobiol. 2007, 61, 1237–1251. [Google Scholar] [CrossRef]
- Overdorff, D.J. Similarities, differences, and seasonal patterns in the diets of Eulemur rubriventer and Eulemur fulvus rufus in the Ranomafana National Park, Madagascar. Int. J. Primatol. 1993, 14, 721–753. [Google Scholar] [CrossRef]
- Sato, H.; Santini, L.; Patel, E.R.; Campera, M.; Yamashita, N.; Colquhoun, I.C.; Donati, G. Dietary flexibility and feeding strategies of Eulemur: A comparison with Propithecus. Int. J. Primatol. 2016, 37, 109–129. [Google Scholar] [CrossRef]
- Conn, P.B.; Johnson, D.S.; Ver Hoef, J.M.; Hooten, M.B.; London, J.M.; Boveng, P.L. Using spatio-temporal statistical models to estimate animal abundance and infer ecological dynamics from survey counts. Ecol. Monogr. 2015, 85, 235–252. [Google Scholar] [CrossRef]
- Sterling, E.J.; Ramaroson, M.G. Rapid assessment of primate fauna of the eastern slopes of the RNI d’Andringitra, Madagascar. In A Floral and Faunal Inventory of the Eastern Side of the Reserve Naturelle Integrale d’Andringitra, Madagascar: With Reference to Elevational Variation; Goodman, S.M., Ed.; Field Museum of Natural History: Chicago, IL, USA, 1996; pp. 293–305. [Google Scholar]
- Sterling, E.J.; McFadden, K. Rapid census of lemur populations in the Parc National de Marojejy, Madagascar. In A Floral and Faunal Inventory of the Parc National de Marojejy, Madagascar: With Reference to Elevational Variation. Fieldiana Zoology, New Series 97; Goodman, S.M., Ed.; Field Museum of Natural History: Chicago, IL, USA, 2000; pp. 265–274. [Google Scholar]
- Rabeson, P.; Randrianarisata, D.; Rasabo, P.; Andrianoely, D.; Wright, P.C. Surveys for lemurs and biodiversity in the Beakora forest southeast of Kalambatritra Reserve, Madagascar. Lemur News 2006, 11, 5–9. [Google Scholar]
- Ralison, J.-M.; Rajaonson, A.; Ratsimbazafy, J.H. Inventaire rapide des lémuriens de Maromizaha en vue d’un programme à longtermes de suivi écologique participative. Lemur News 2015, 19, 21–24. [Google Scholar]
- Campera, M.; Santini, L.; Balestri, M.; Nekaris, K.A.I.; Donati, D. Elevation gradients of lemur abundance emphasise the importance of Madagascar’s lowland rainforest for the conservation of endemic taxa. Mamm. Rev. 2020, 50, 25–37. [Google Scholar] [CrossRef]
- Feistner, A.T.C.; Schmid, J. Lemurs of the Réserve Naturelle Intégrale d’Andohahela, Madagascar. In A Floral and Faunal Inventory of the Réserve Naturelle Intégrale d’Andohahela, Madagascar: With Reference to Elevational Variation. Fieldiana Zoology, New Series, 94; Goodman, S.M., Ed.; Field Museum of Natural History: Chicago, IL, USA, 1999; pp. 269–283. [Google Scholar]
- Irwin, M.T.; Samonds, K.E.; Raharison, J.-L. A biological inventory of the lemur community of Réserve Spéciale de Kalambatritra, South-Central Madagascar. Lemur News 2001, 6, 24–28. [Google Scholar]
- Rakotonirina, L.H.F.; Raalimandimby, J.; Ratojanahary, T.; Ravaloharimanitra, M.; Dolch, R.; King, T. Lemurs and bamboos of Kalambatritra, south-east Madagascar. Lemur News 2017, 20, 34–37. [Google Scholar]
- Johnson, S.E.; Overdorff, D.J. Census of brown lemurs (Eulemur fulvus sspp.) in southeastern Madagascar: Methods-testing and conservation implications. Am. J. Primatol. 1999, 47, 51–60. [Google Scholar] [CrossRef]
- Schmid, J.; Smolker, R. Lemurs of the Réserve Spéciale d’Anjanaharibe-Sud, Madagascar. In A Floral and Faunal Inventory of the Réserve Spéciale d´Anjanaharibe-Sud, Madagascar: With Reference to Elevational Variation. Fieldiana Zoology, New Series, 90; Goodman, S.M., Ed.; Field Museum of Natural History: Chicago, IL, USA, 1998; pp. 227–239. [Google Scholar]
- Santini, L.; Isaac, N.J.B.; Maiorano, L.; Ficetola, G.F.; Huijbregts, M.A.J.; Carbone, C.; Thuiller, W. Global drivers of population abundance in terrestrial vertebrates. Glob. Ecol. Biogeogr. 2018, 27, 968–979. [Google Scholar] [CrossRef]
- Bogaert, J.; Van Hecke, P.; Impens, I. A reference value for the interior-to-edge ratio of isolated habitats. Acta Biotheoretica 1999, 47, 67–77. [Google Scholar] [CrossRef]
- Bollen, A.; Donati, G. Conservation status of the littoral forest of south-eastern Madagascar: A review. Oryx 2006, 40, 57–66. [Google Scholar] [CrossRef] [Green Version]
- Balestri, M.; Campera, M.; Nekaris, K.A.I.; Donati, G. Assessment of long-term retention of environmental education lessons given to teachers in rural areas of Madagascar. Appl. Environ. Educ. Commun. 2017, 16, 298–311. [Google Scholar] [CrossRef]
- Schüßler, D.; Mantilla-Contreras, J.; Stadtmann, R.; Ratsimbazafy, J.H.; Radespiel, U. Identification of crucial stepping stone habitats for biodiversity conservation in northeastern Madagascar using remote sensing and comparative predictive modeling. Biodivers. Conserv. 2020, 29, 2161–2184. [Google Scholar] [CrossRef]


| Species | Traits Supporting Edge Responses | Prediction | ||
|---|---|---|---|---|
| Positive Edge Response | Neutral Edge Response | Negative Edge Response | ||
| Anosy mouse lemur (Microcebus tanosi) |
|
| Positive | |
| Aye-aye (Daubentonia madagascariensis) | Negative | |||
| Collared brown lemur (Eulemur collaris) |
| Negative | ||
| Dwarf lemur (Cheirogaleus sp.) | Negative | |||
| Madame Fleurette’s sportive lemur (Lepilemur fleuretae) |
| Negative | ||
| Southern bamboo lemur (Hapalemur meridionalis) | Neutral | |||
| Southern woolly lemur (Avahi meridionalis) |
|
| Neutral | |
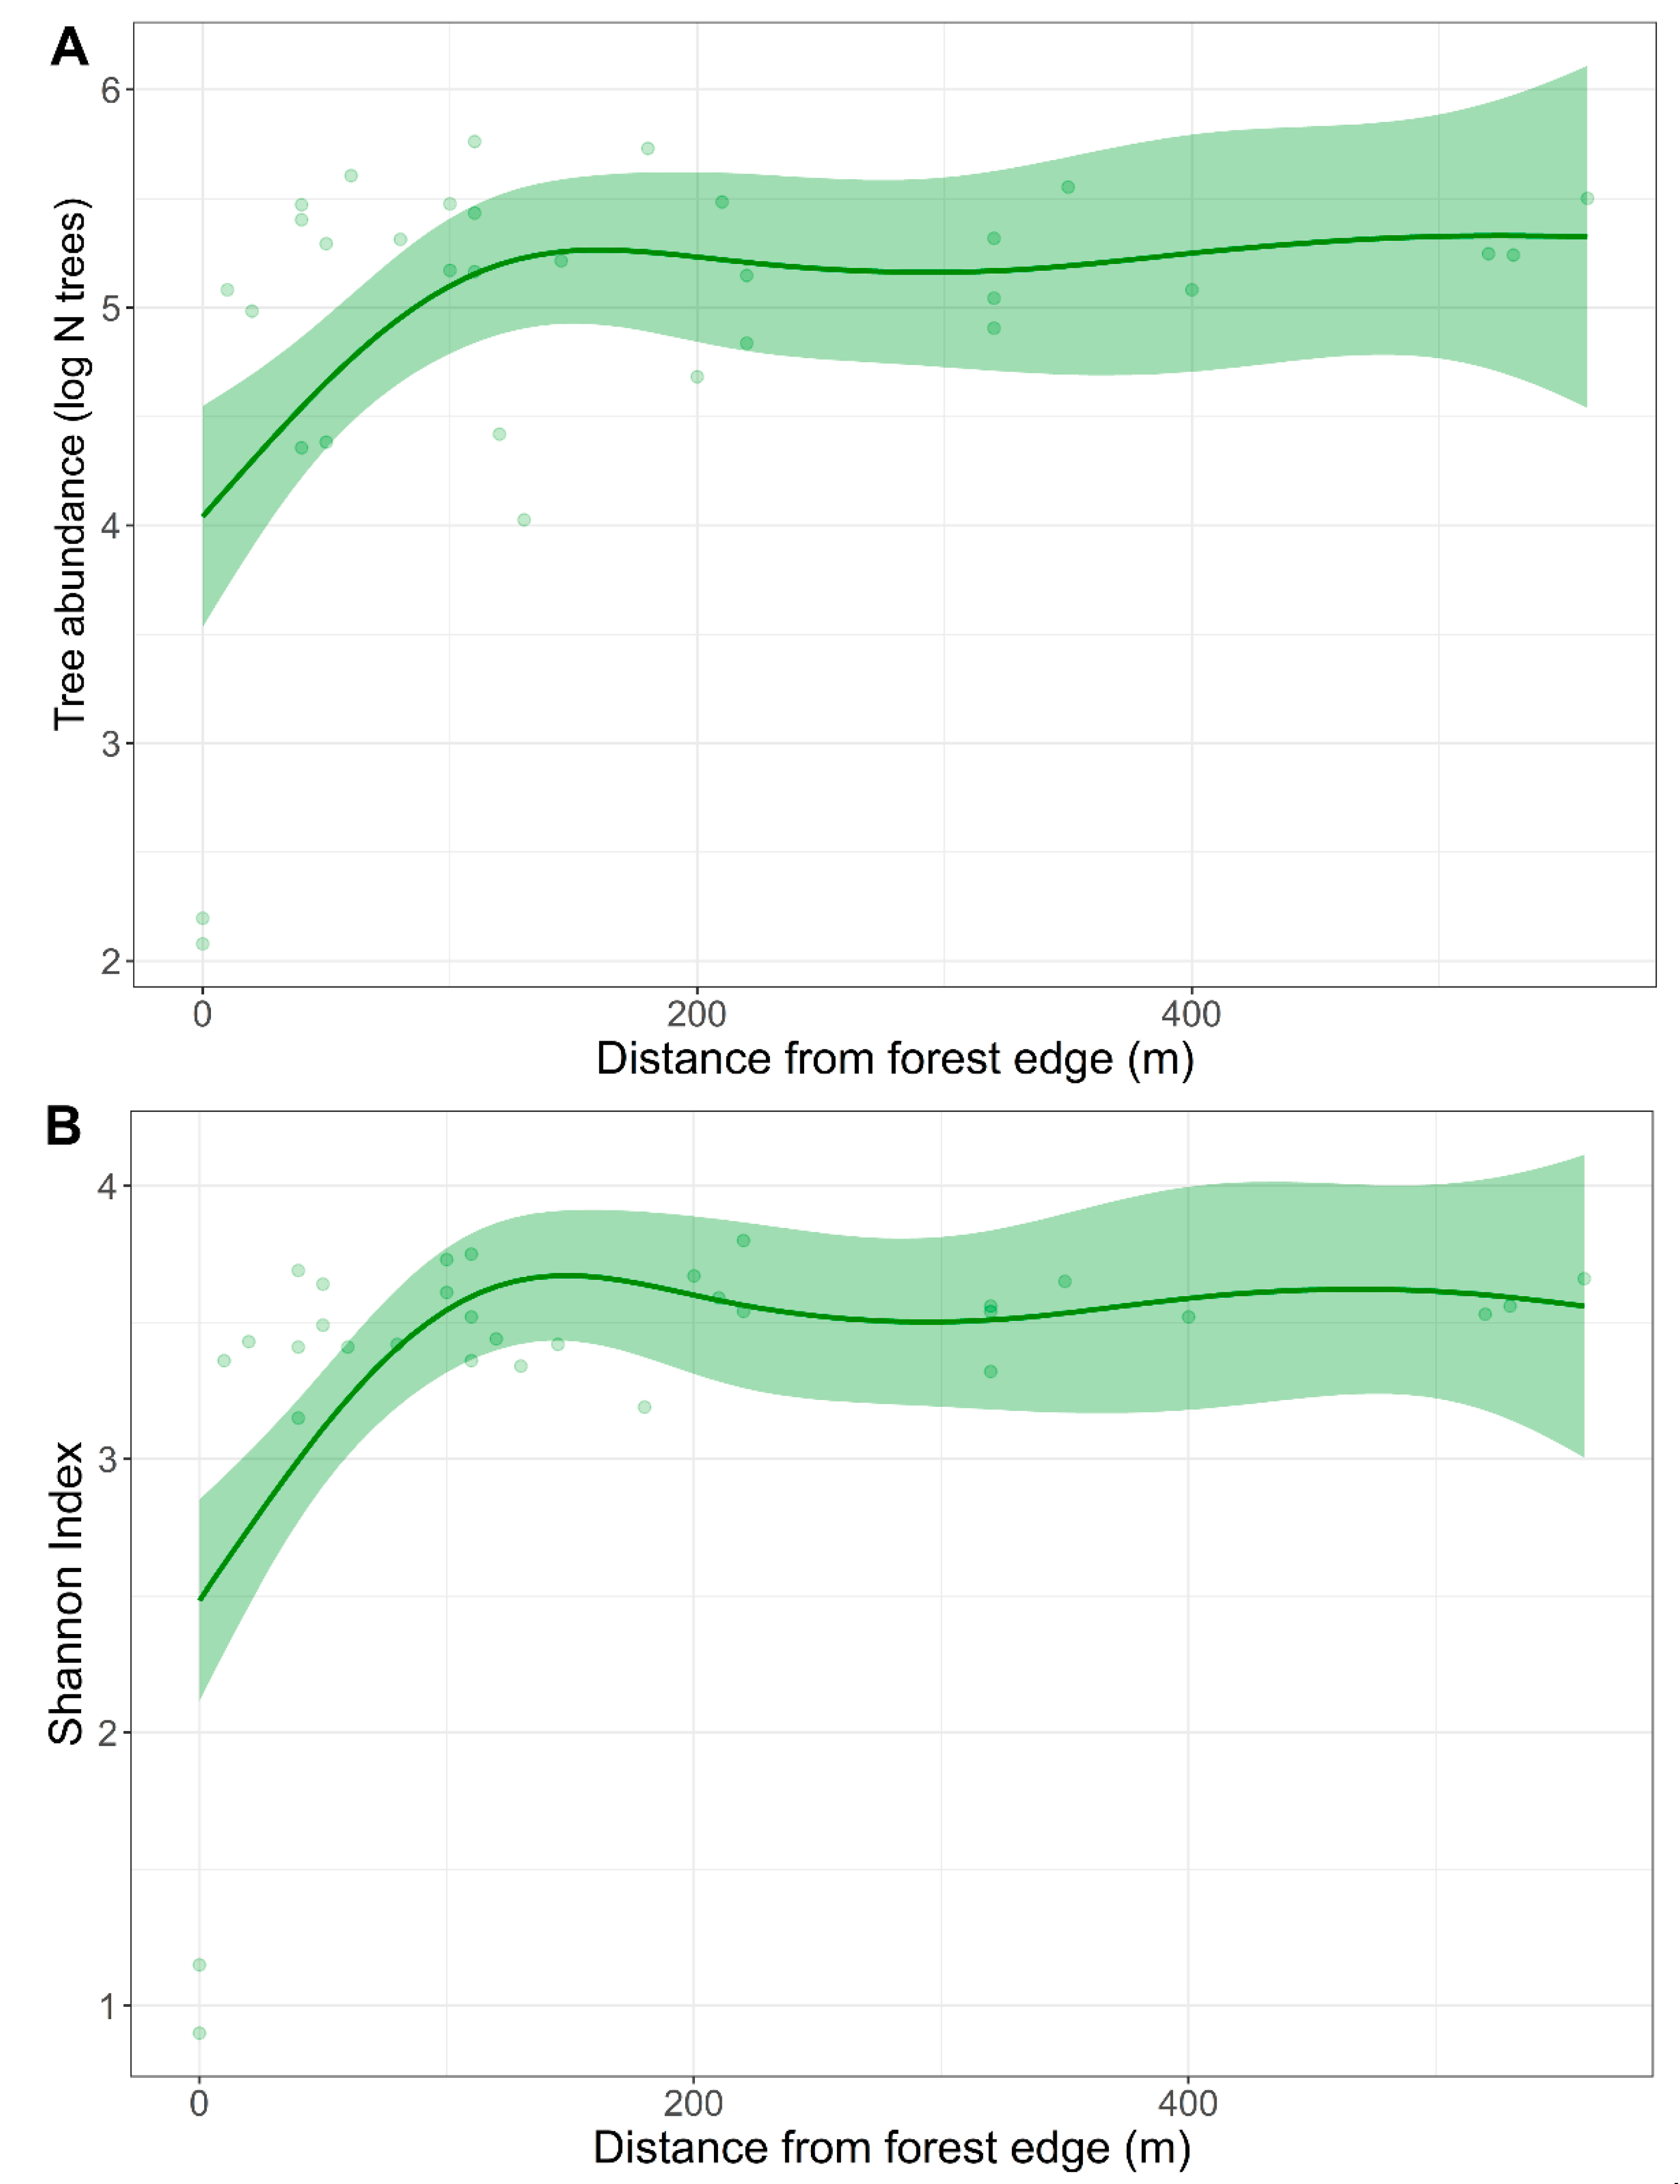
| Response Variable | R-Squared | Intercept | Smooth Term | ||
|---|---|---|---|---|---|
| Estimate (St. Error) | Edf | F | p | ||
| Shannon Index | 0.375 | 3.36 (0.09) ** | 3.67 | 5.68 ** | 0.003 |
| Number of trees | 0.280 | 4.96 (0.13) ** | 3.60 | 4.00 * | 0.020 |
| DBH | 0.001 | 13.95 (0.32) ** | 1.00 | 0.08 | 0.785 |
| DBH CV | 0.028 | 4.01 (0.18) ** | 1.37 | 1.34 | 0.363 |
| Species | Forest Edge (≤100 m) | Forest Interior (>100 m) | ||||
|---|---|---|---|---|---|---|
| Ind./km | Groups/km | N Encounters | Ind./km | Groups/km | N Encounters | |
| Anosy mouse lemur (Microcebus tanosi) | 1.99 ± 0.26 * | 1.92 ± 0.25 * | 57 | 1.28 ± 0.23 | 1.27 ± 0.12 | 77 |
| Collared brown lemur (Eulemur collaris) | 0.80 ± 0.16 | 0.19 ± 0.04 | 30 | 1.61 ± 0.16 * | 0.35 ± 0.04 * | 120 |
| Dwarf lemur (Cheirogaleus sp.) | 0.40 ± 0.13 | 0.40 ± 0.12 | 4 | 0.28 ± 0.07 | 0.24 ± 0.06 | 7 |
| Madame Fleurette’s sportive lemur (Lepilemur fleuretae) | 1.57 ± 0.17 | 1.43 ± 0.16 | 45 | 2.57 ± 0.15* | 2.31 ± 0.14 * | 154 |
| Southern bamboo lemur (Hapalemur meridionalis) | 0.75 ± 0.17 * | 0.27 ± 0.05 | 25 | 0.33 ± 0.07 | 0.20 ± 0.03 | 25 |
| Southern woolly lemur (Avahi meridionalis) | 1.54 ± 0.15 * | 1.12 ± 0.09 * | 32 | 0.69 ± 0.07 | 0.50 ± 0.04 | 41 |
| Species | ESW | Probability of Detection | Mean Group Size | Density of Groups | Density of Individuals | N Total |
|---|---|---|---|---|---|---|
| Anosy mouse lemur (Microcebus tanosi) | 7.38 (6.56–8.31) | 0.57 (0.51–0.64) | 1.02 (1.00–1.04) | 0.96 (0.78–1.19) | 0.97 (0.78–1.19) | 869 (703–1075) |
| Collared brown lemur (Eulemur collaris) | 7.64 (5.87–9.93) | 0.51 (0.39–0.66) | 4.55 (3.77–5.48) | 0.19 (0.12–0.30) | 0.57 (0.36–0.91) | 513 (320–820) |
| Dwarf lemur (Cheirogaleus sp.) | 5.36 (2.51–11.46) | 0.45 (0.21–0.95) | 1.10 (1.00–1.35) | 0.25 (0.10–0.60) | 0.27 (0.11–0.64) | 233 (92–541) |
| Madame Fleurette’s sportive lemur (Lepilemur fleuretae) | 14.84 (13.46–16.35) | 0.59 (0.54–0.65) | 1.12 (1.08–1.15) | 0.65 (0.54–0.78) | 0.73 (0.61–0.87) | 654 (545–784) |
| Southern bamboo lemur (Hapalemur meridionalis) | 7.95 (5.87–10.79) | 0.57 (0.42–0.77) | 2.12 (1.57–2.87) | 0.13 (0.08–0.23) | 0.27 (0.15–0.45) | 231 (132–403) |
| Southern woolly lemur (Avahi meridionalis) | 11.83 (10.13–13.81) | 0.74 (0.63–0.86) | 1.38 (1.23–1.56) | 0.25 (0.18–0.34) | 0.32 (0.23–0.44) | 286 (206–398) |
| Species | Site | Edge Effect | Density (ind/ha) |
|---|---|---|---|
| Anosy mouse lemur (Microcebus tanosi) | Andohahela | None | 1.02 |
| Ampasy | Low | 0.97 | |
| Kalambatritra | Moderate | 0.11 | |
| Beakora | High | 0.06 | |
| Collared brown lemur (Eulemur collaris) | Andohahela | None | 0.11 |
| Ampasy | Low | 0.57 | |
| Midongy-Sud | Low | 0.11 | |
| Kalambatritra | Moderate | 0.15 | |
| Beakora | High | 0.12 | |
| Dwarf lemur (Cheirogaleus sp.) | Andohahela | None | 0.97 |
| Andringitra | None | 1.10 | |
| Ampasy | Low | 0.27 | |
| Kalambatritra | Moderate | 0.08 | |
| Beakora | High | 0.08 | |
| Madame Fleurette’s sportive lemur (Lepilemur fleuretae) | Andohahela | None | 0.07 |
| Ampasy | Low | 0.73 | |
| Southern bamboo lemur (Hapalemur meridionalis) | Andohahela | None | 0.15 |
| Andringitra | None | 0.21 | |
| Ampasy | Low | 0.27 | |
| Kalambatritra | Moderate | 0.07 | |
| Beakora | High | 0.11 | |
| Southern woolly lemur (Avahi meridionalis) | Andohahela | None | 0.17 |
| Ampasy | Low | 0.32 | |
| Kalambatritra | Moderate | 0.03 | |
| Beakora | High | 0.02 |
Disclaimer/Publisher’s Note: The statements, opinions and data contained in all publications are solely those of the individual author(s) and contributor(s) and not of MDPI and/or the editor(s). MDPI and/or the editor(s) disclaim responsibility for any injury to people or property resulting from any ideas, methods, instructions or products referred to in the content. |
© 2022 by the authors. Licensee MDPI, Basel, Switzerland. This article is an open access article distributed under the terms and conditions of the Creative Commons Attribution (CC BY) license (https://creativecommons.org/licenses/by/4.0/).
Share and Cite
Campera, M.; Balestri, M.; Phelps, M.; Besnard, F.; Mauguiere, J.; Rakotoarimanana, F.; Nijman, V.; Nekaris, K.A.I.; Donati, G. Depth of Edge Influence in a Madagascar Lowland Rainforest and Its Effects on Lemurs’ Abundance. Land 2023, 12, 81. https://doi.org/10.3390/land12010081
Campera M, Balestri M, Phelps M, Besnard F, Mauguiere J, Rakotoarimanana F, Nijman V, Nekaris KAI, Donati G. Depth of Edge Influence in a Madagascar Lowland Rainforest and Its Effects on Lemurs’ Abundance. Land. 2023; 12(1):81. https://doi.org/10.3390/land12010081
Chicago/Turabian StyleCampera, Marco, Michela Balestri, Megan Phelps, Fiona Besnard, Julie Mauguiere, Faniry Rakotoarimanana, Vincent Nijman, K. A. I. Nekaris, and Giuseppe Donati. 2023. "Depth of Edge Influence in a Madagascar Lowland Rainforest and Its Effects on Lemurs’ Abundance" Land 12, no. 1: 81. https://doi.org/10.3390/land12010081