Article

Complete Chloroplast Genomes of Four Oaks from the Section Cyclobalanopsis Improve the Phylogenetic Analysis and Understanding of Evolutionary Processes in the Genus Quercus

1
School of Ecological Technology and Engineering, Shanghai Institute of Technology, Shanghai 201418, China
2
Eastern China Conservation Centre for Wild Endangered Plant Resources, Shanghai Chenshan Botanical Garden, Shanghai 201602, China
3
Department of Biology and Botanic Garden, University of Fribourg, 1700 Fribourg, Switzerland
4
Natural History Museum Fribourg, 1700 Fribourg, Switzerland
*
Authors to whom correspondence should be addressed.
These authors contributed equally to this work.
Genes 2024, 15(2), 230; https://doi.org/10.3390/genes15020230
Submission received: 5 January 2024 / Revised: 6 February 2024 / Accepted: 7 February 2024 / Published: 11 February 2024
(This article belongs to the Special Issue Plant Plastid Genome)

Abstract

:
Quercus is a valuable genus ecologically, economically, and culturally. They are keystone species in many ecosystems. Species delimitation and phylogenetic studies of this genus are difficult owing to frequent hybridization. With an increasing number of genetic resources, we will gain a deeper understanding of this genus. In the present study, we collected four Quercus section Cyclobalanopsis species (Q. poilanei, Q. helferiana, Q. camusiae, and Q. semiserrata) distributed in Southeast Asia and sequenced their complete genomes. Following analysis, we compared the results with those of other species in the genus Quercus. These four chloroplast genomes ranged from 160,784 bp (Q. poilanei) to 161,632 bp (Q. camusiae) in length, with an overall guanine and cytosine (GC) content of 36.9%. Their chloroplast genomic organization and order, as well as their GC content, were similar to those of other Quercus species. We identified seven regions with relatively high variability (rps16, ndhk, accD, ycf1, psbZ—trnG-GCC, rbcL—accD, and rpl32—trnL-UAG) which could potentially serve as plastid markers for further taxonomic and phylogenetic studies within Quercus. Our phylogenetic tree supported the idea that the genus Quercus forms two well-differentiated lineages (corresponding to the subgenera Quercus and Cerris). Of the three sections in the subgenus Cerris, the section Ilex was split into two clusters, each nested in the other two sections. Moreover, Q. camusiae and Q. semiserrata detected in this study diverged first in the section Cyclobalanopsis and mixed with Q. engleriana in the section Ilex. In particular, 11 protein coding genes (atpF, ndhA, ndhD, ndhF, ndhK, petB, petD, rbcL, rpl22, ycf1, and ycf3) were subjected to positive selection pressure. Overall, this study enriches the chloroplast genome resources of Quercus, which will facilitate further analyses of phylogenetic relationships in this ecologically important tree genus.

1. Introduction

Genetic resources include genes, genetic variants, and genetic complexes that control traits with actual or potential economic, environmental, scientific, or societal value [1,2]. The development of key genetic resources, especially for threatened and indicator species, and those that underpin biodiversity, is important for biological conservation [3,4]. With the advent of the genomic age, genomic resources can greatly assist cytogenetics, molecular biology, bioinformatics, evolutionary biology, and conservation biology.
Organellar genomes (mitochondrial and chloroplast DNA) are important in eukaryotes. The chloroplast is an important semiautonomous plant organelle with a complete genetic system that provides space for photosynthesis [5,6]. The availability of public chloroplast genomic resources has grown rapidly, which has helped us understand the relationships between angiosperms and all flowering plant families [7,8]. Because of the characteristics of inherited uniparentally conserved sequences, similar structures, and slower evolutionary rates, the chloroplast genome has also been shown to play an important role in taxonomy, phylogeny, phylogeography, genomics, and conservation biology [9,10,11,12].
Quercus (oaks) section Cyclobalanopsis (cycle-cup oaks) are exclusively found in East and Southeast Asia and are the dominant trees in tropical and subtropical areas with warm and humid climates [13,14]. Cyclobalanopsis is one of the largest sections in Quercus, with approximately 110 species, and has the highest proportion of threatened oaks [15]. Previous phylogenetic studies provided our understanding of evolutionary history and population divergence, and previous phylogeographic studies may provide insight into the distribution and evolution in geographic space and facilitate effective conservation and management strategies; previous conservation genetic studies focused on the genetic diversity, population structure, and endangered status of Quercus, providing key information into the genetic health of cycle-cup oak populations and scientific conservation plans [16,17,18,19,20,21,22,23,24,25]. While most of these studies are related to species from East Asia, the genetic resources of species from Southeast Asia are very rare. To gain a deeper understanding of the tropical cycle-cup oak species from Southeast Asia, it is necessary to exploit genetic and genomic data to explore their evolution and conservation.
In this context, we collected four cycle-cup oak species (Q. poilanei, Q. helferiana, Q. camusiae, and Q. semiserrata) that are mainly distributed in Southeast Asia. Quercus poilanei, Q. helferiana, and Q. semiserrata are widely distributed in Southwest China, Thailand, Laos, Vietnam, Malaysia, and Myanmar, whereas Q. camusiae is a critically endangered species distributed only in the boundary area between China and Vietnam [14]. Using next-generation sequencing data, the chloroplast (cp) genomes of four cycle-cup oak species were assembled and annotated. We investigated the typical structural characteristics, abundance of simple sequence repeats (SSRs) and large repeat sequences, and codon preferences of these four species. Combined with the cp genomes of the other 20 species in this section [25,26,27,28,29,30], we performed the following analyses: (1) comparative genomic analysis, (2) construction of the cp genomic phylogeny of section Cyclobalanopsis, and (3) evolutionary selection pressure analysis. In the present study, we provided cp genomic resources for these four cycle-cup oaks and resolved their structures, phylogenetic relationships, and adaptive evolution.

2. Materials and Methods

2.1. Plant Samples and DNA Extraction and Sequencing

Fresh and healthy leaf samples from the four Quercus section Cyclobalanopsis species were harvested and desiccated on silica gel (Table 1). The samples were deposited in the herbarium of the Shanghai Chenshan Botanical Garden. Total plant DNA was extracted from leaf tissues using a modified cetyl trimethyl ammonium bromide (CTAB) protocol [31]. Total genomic DNA was double-terminally sequenced using the high-throughput sequencing platform DNBSEQ. High-quality clean data were obtained by removing low-quality sequences [32].

2.2. Chloroplast Genome Assembly, Annotation, and Visualization

The cp genomes of the four Quercus section Cyclobalanopsis species in this study were de novo assembled using “get_organelle_from_reads.py” in GetOrganelle v1.7.6.1 software [33]. The sequences were manually checked for assembly into rings using Bandage [34]. The online annotation program GeSeq (https://chlorobox.mpimp-golm.mpg.de/geseq.html; accessed on 5 July 2023) was used to genomes annotate the .gb files for subsequent analysis [35]. Chloroplast genome maps of the four species were generated using the online program OrganellarGenomeDRAWv1.3.1 (https://chlorobox.mpimp-golm.mpg.de/OGDraw.html; accessed on 8 July 2023) [36]. The basic features of the cp genomes, including the length, guanine and cytosine (GC) content, and genes, were identified using Geneious R9.0.2 software [37].

2.3. Repeated Sequence Analysis

Simple sequence repeats (SSRs) were identified using the online program MIcroSAtellite (MISA, https://webblast.ipk-gatersleben.de/misa/; accessed on 15 July 2023) [38]. The repeat number thresholds from mononucleotides to hexanucleotides were set at 10, 5, 4, 3, 3, and 3. Composite microsatellites were identified by setting the minimum distance between two SSRs to be < 100 bp. The dispersed repeat sequences, including forward repeat sequences (F), reverse repeat sequences (R), complementary repeat sequences (C), and palindromic repeat sequences (P), were searched by the REPuter (https://bibiserv.cebitec.uni-bielefeld.de/reputer; accessed on 15 July 2023) [39]. The Hamming distance, maximum computed repeats, and minimal repeat size were set to 3, 50, and 30, respectively. Minisatellite repeat sequences (M) of at least 10 bp in length were identified using Tandem Repeats Finder (TRF, http://tandem.bu.edu/trf/trf.html; accessed on 15 July 2023). The alignment parameters for the matches, mismatches, and indels were set to 2, 7, and 7, respectively. The minimum alignment score and maximum period size were set to 80 and 500, respectively [40,41].

2.4. Codon Usage Bias Analysis

The coding sequences (CDS) were extracted using Geneious R9.0.2 software and screened on the condition that ATG was the starting codon and the sequence length was ≥ 300 bp. We also calculated the codon usage bias parameters, including codon base content, effective number of codons (ENC), and relative synonymous codon usage (RSCU), using CodonW1.4.2, with default parameters. The RSCU analysis was performed using R and the ENC-plot, PR2-bias-plot, and neutrality-plot analyses were performed using Origin2021 [42,43].

2.5. Comparative Genome Analyses of Chloroplast Genomes

The Mauve plugin in Geneious R9.0.2 software with default parameters was used to determine whether structural changes existed in the cp genomes of the 20 Quercus section Cyclobalanopsis species. IRscope was used to map the genetic structure of the boundary regions between inverted repeat (IR) and single copy (SC) regions [44]. Using the cp genome of Q. acuta as the reference sequence, alignments of 20 Quercus section Cyclobalanopsis species were visualized using the cp comparative genomics tool mVISTA (http://genome.lbl.gov/vista/mvista/submit.shtml; accessed on 25 July 2023) [45]. Complete cp genomes from 20 Quercus section Cyclobalanopsis species were aligned using the multiple sequence alignment program MAFFT v7.487 [46]. Sliding window analysis was performed using DnaSP v6.12.03 software [47], with a step size of 200 bp and window length of 800 bp, to calculate nucleotide diversity (Pi values) and detect highly variant hotspots in the cp genomes [48].

2.6. Phylogenetic Analysis

To establish phylogenetic relationships, a phylogenetic tree of Quercus was constructed using maximum likelihood (ML) method based on 33 complete cp genomes [49]. Fagus engleriana and Juglans mandshurica were used as outgroup species. MAFFT v7.487 was used to align the complete cp genomes of 33 species [46]. Next, the phylogenetic tree was reconstructed using IQ-tree v2.1.3 [50]. The ML tree adopted TVM + F + R2 as the best nucleotide replacement model with 1000 bootstrap replicates [51]. Finally, the constructed phylogenetic tree was further edited and visualized using FigTree v.1.4.4 (http://tree.bio.ed.ac.uk/software/figtree/; accessed on 5 August 2023).

2.7. Evolutionary Selection Pressure Analysis

To identify the evolutionary selection pressure in the cp genomes of the Quercus section Cyclobalanopsis [52], non-synonymous (Ka) and synonymous (Ks) ratios (Ka/Ks) were calculated using the Codeml program in the PAML v4.9j software package [53]. The Codeml program requires four files to complete the run: the program file, configuration file, and alignment sequence files and phylogenetic tree files. The four types of files were placed in the same directory and the selection pressure of the 79 common protein coding genes (PCGs) was identified using the site model. Six models (seqtype = 1, model = 0, and NSsites = 0, 1, 2, 3, 7, and 8) were used to detect the potential sites of positive selection. The likelihood ratio test (LRT) was performed after pairwise comparisons of three pairs of models: M0 (single-ratio) vs. M3 (discrete), M1 (near-neutral) vs. M2 (positive selection), and M7 (β) vs. M8 (β and ω) [54]. Genes with p-values < 0.05 were selected as positive selection genes [55]. Finally, the posterior probability of sites was calculated based on Bayes empirical Bayes (BEB) to assess the significance of positively selected sites (p > 95%) [53].

3. Results

3.1. Chloroplast Genome Structures and Features of the Four Quercus Section Cyclobalanopsis Species

The length of the four assembled cp genomes ranged from 160,784 bp in Q. poilanei to 161,632 bp in Q. camusiae. All four species exhibited a typical circular tetrad structure, including two single copy regions (large single copy (LSC) and small single copy (SSC)) and two inverted repeat regions (IRs) with similar lengths in the same regions (Figure 1 and Table 2). The total GC content was 36.9% of four Quercus section Cyclobalanopsis species. In addition, the GC content differed slightly among the different regions of these four species, and the GC content in the IR region was significantly higher than that in the LSC and SSC regions (Table 2).
All four cp genomes encode 131 genes, including 86 PCGs, 37 transfer RNA genes (tRNAs), and 8 ribosomal RNA genes (rRNAs) (Table 2). The names, numbers, and orders of the genes annotated in the cp genomes were consistent among the four species. We found that 83 genes were located in the LSC region (including 61 PCGs and 22 tRNAs) and 12 genes were located in the SSC region (including 11 PCGs and 1 tRNA). The two IR regions contained 18 duplicate genes, including 7 PCGs (rps12, rps7, rpl2, rpl23, ndhB, ycf1, and ycf2), 7 tRNAs (trnA-UGC, trnI-GAU, trnL-CAA, trnI-CAU, trnN-GUU, trnV-GAC, and trnR-ACG), and 4 rRNAs genes (rrn4.5S, rrn5S, rrn16S, and rrn23S) (Table 3). Except for ycf1 and rps12, all other genes were located in a single region, while ycf1 genes spanned the IRs and SSC regions, and rps12 spanned the IRa and LSC regions (Figure 1).

3.2. Repeated Sequences Analysis of Four Quercus Section Cyclobalanopsis Species

The total number of SSRs identified in the cp genomes of the four Quercus section Cyclobalanopsis species was 477, ranging from 115 in Q. helferiana to 123 in Q. semiserrata. The number of the same type of SSR showed only slight variation among the four species (80–82 mononucleotides, 15–17 dinucleotides, 6–8 trinucleotides, 9–10 tetranucleotides, 3–5 pentanucleotides, and 0–1 hexanucleotides) (Figure 2a and Table S1). The main types of SSRs were mononucleotides and dinucleotides, which account for 80% of the total. The mononucleotides type was the largest, especially the A/T base type, which was far higher than that of the other types (Table S1). Additionally, the distribution of SSRs in the LSC region (74.4%) was higher than that in the IR (8%) and SSC regions (17.6%). The distribution of SSRs in intergenic spacer (IGS) regions (70%) was also higher than that in the CDS (15.1%) and intron regions (14.9%) (Figure 2b and Table 4).
In total, 154 dispersed repeat sequences (D) were identified among the four cp genomes, ranging from 36 in Q. semiserrata to 43 in Q. helferiana. Meanwhile, 14–18 were forward repeat (F), 2 or 3 were reverse repeat (R), and 19–23 were palindromic repeat (P) sequences. Only one complementary repeat sequence (C) was identified in Q. poilanei. The lengths of the dispersed repeat sequences ranged from 30 to 64 bp and were concentrated between 30 and 40 bp (Figure 3a and Table 5). Finally, 117 minisatellite repeat sequences (M) were identified in the four chloroplast genomes, ranging from 28 in Q. semiserrata and Q. camusiae to 31 in Q. poilanei. The copy number of the minisatellite repeat sequences was mainly between 2 and 4, and the length distribution was concentrated between 10 and 19 bp in the four Quercus section Cyclobalanopsis species (Figure 3b and Table 5).

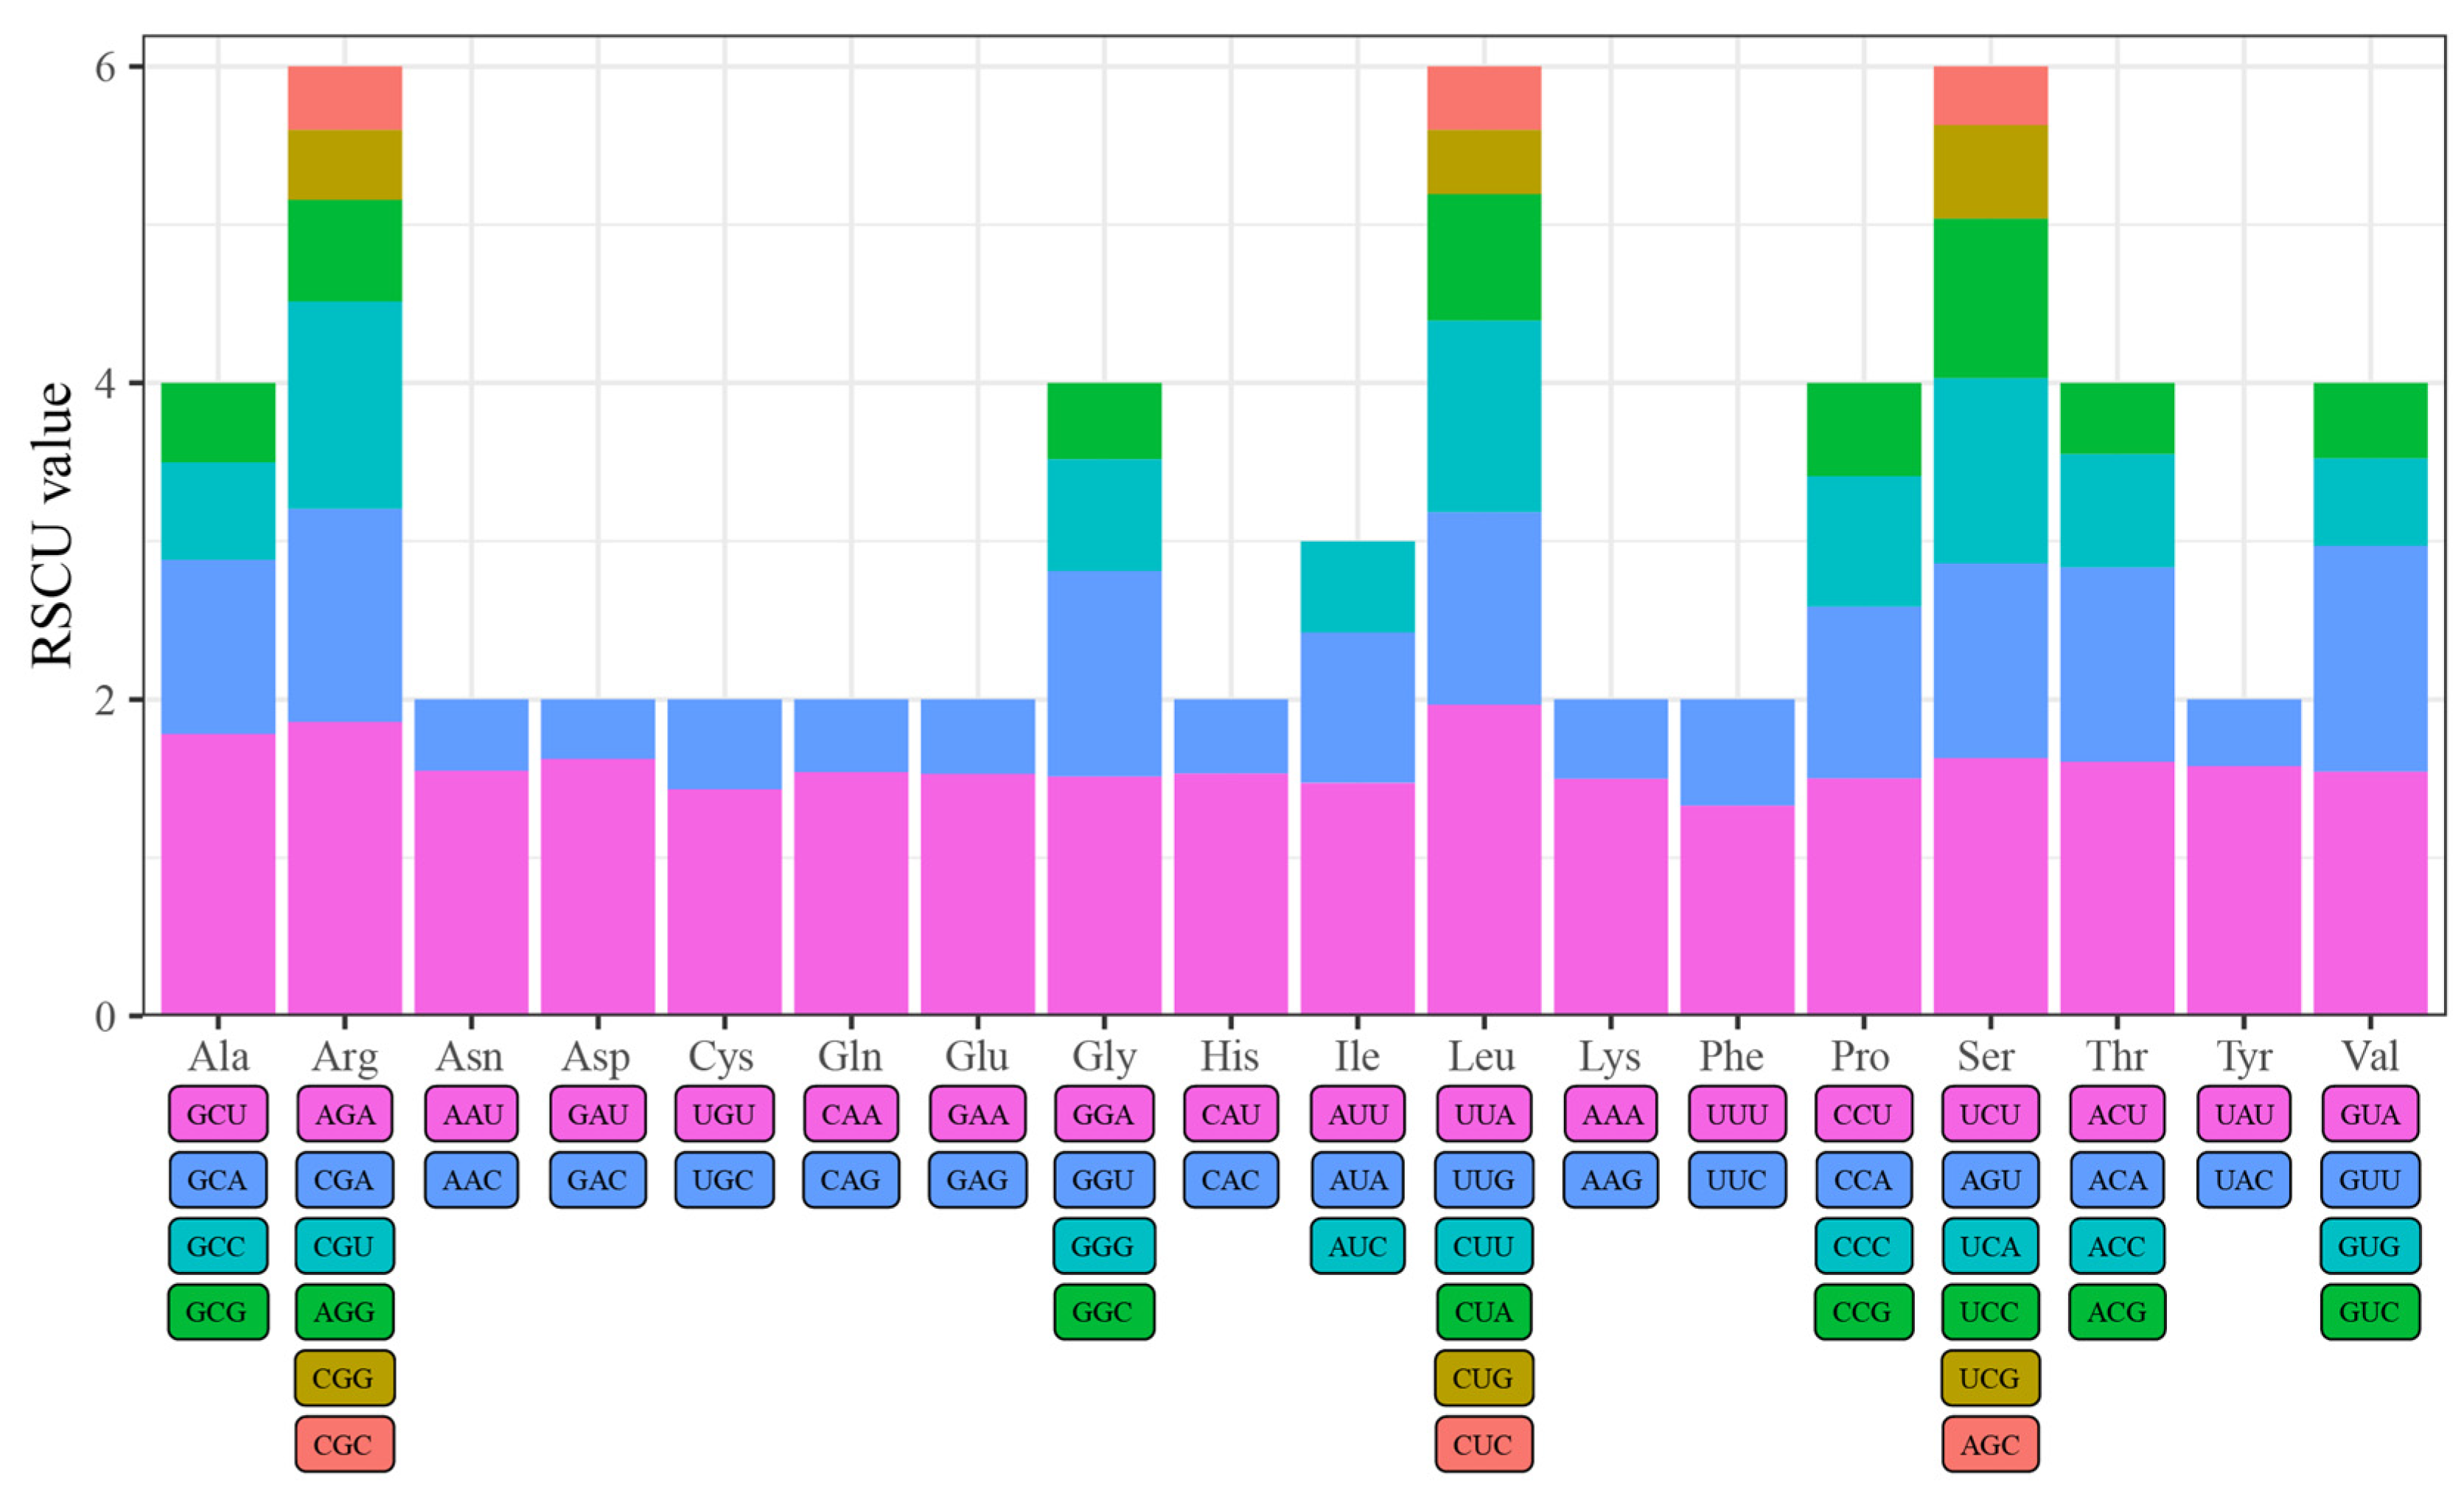
3.3. Codon Usage Bias Analysis of Four Quercus Section Cyclobalanopsis Species

Codon usage bias analysis was performed on 50 CDS selected from these four species. We found that the GC content at the first codon site was the highest, while that at both the second and third sites was less than 50%. Moreover, there was a decreasing trend in GC1 > GC2 > GC3, further indicating that the chloroplast genomes were rich in A/T (Table S3). All amino acids are encoded by two to six codons, except for methionine (Met), which is encoded by the ATG codon, and tryptophan (Trp), which is encoded by the TGG codon. Among the 59 synonymous codons with relative synonymous codon usage (RSCU) values, 30 high-frequency codons with an RSCU > 1 ended in A/U, whereas the remaining 29 were low-frequency codons with an RSCU < 1 (Figure 4 and Table S3). The codon with the largest RSCU value was UUA, which encodes leucine (Leu), followed by AGA, which encodes arginine (Arg) (Figure 4).
In the three analyses of the factors affecting codon preference, we found that codon preference in chloroplast genomes was the result of base mutations, natural selection, and other factors (Figure 5). In the ENC-plot analysis, most genes were distributed along or near the standard curve, indicating that codon preference was mainly affected by base mutations. However, a few genes deviated and fell far below the standard curve, indicating that the codon preference was influenced by natural selection (Figure 5a–d). In the PR2-bias-plot analysis, the four bases at the third codon site were unevenly distributed within the four areas divided by the vertical lines from the central point. The third site of the codon preferred to use base T over base A, while the numbers of bases G and C were similar at these sites. The analysis showed that codon preference in chloroplast genomes was formed by multiple factors, including base mutations and natural selection (Figure 5e–h). In the neutrality-plot analysis, GC12 and GC3 values were positively correlated with non-significance, suggesting that codon preference in the chloroplast genomes was more affected by natural selection than by base mutations (Figure 5i–l).

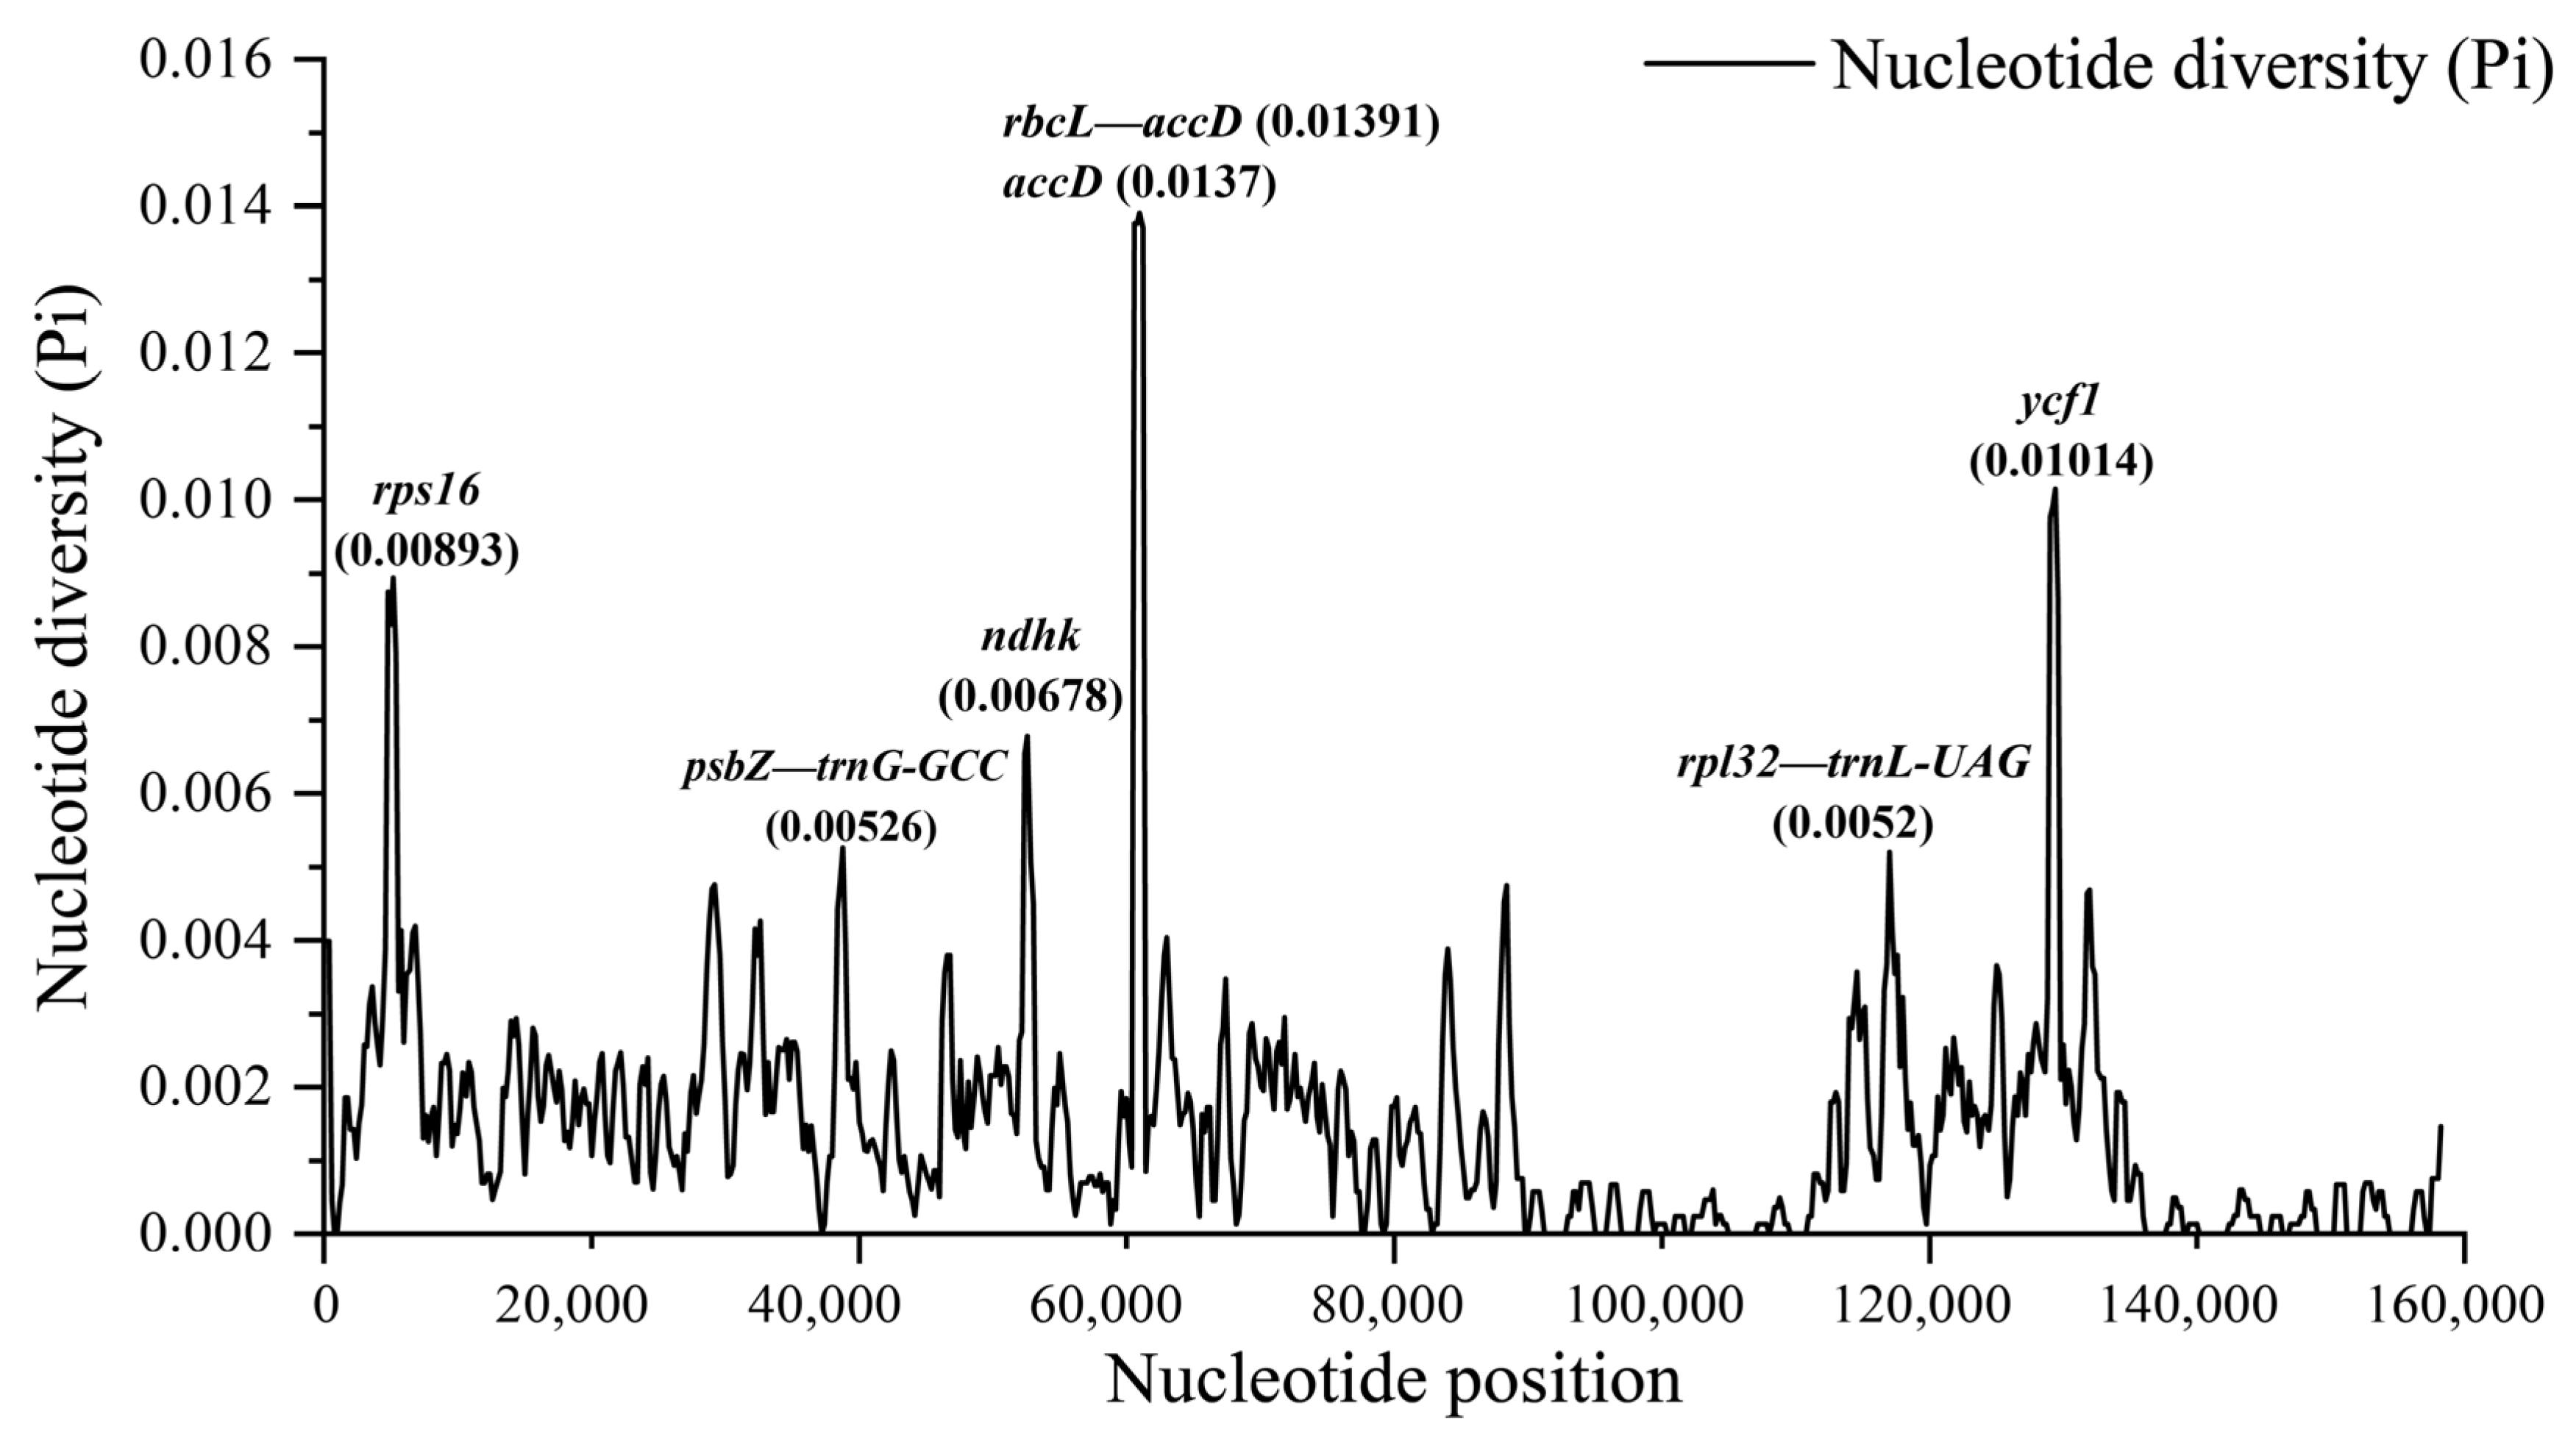
3.4. Comparative Genome of Chloroplast Genomes of Quercus Section Cyclobalanopsis

In this study, we used the Mauve plugin in Geneious R9.0.2 software to determine the differences between the chloroplast genomes of 20 Quercus section Cyclobalanopsis species. Multiple alignment analysis showed that the genome structure and gene arrangement were consistent and that there were no gene rearrangements or inversions with a good collinearity relationship (Figure S1). Therefore, the Mauve alignment further illustrated the high conservation of the 20 chloroplast genomes of Quercus.
The results of the contraction and expansion of the IR regions indicated that although the genome structure and size were highly conserved in the 20 chloroplast genomes, the boundary regions between the IR and LSC/SSC regions still varied slightly. The junction region of the LSC and IRb (JLB) lies in the IGS between rps19 and rpl2. The rps19 gene of most Quercus section Cyclobalanopsis species had an 11 bp shift at the JLB boundary, but Q. poilanei, Q. sessilifolia, and Q. pachyloma expanded to only a 4 bp shift. The ndhF gene of most Quercus section Cyclobalanopsis species was located in the SSC region, whereas different levels contracted to the IRb region in Q. helferiana, Q. camusiae, Q. semiserrata, and Q. neglecta. Specifically, the two junction regions between IRa/IRb and SSC (JSA and JSB) were located in two ycf1 genes. The ycf1 gene located in JSA varied between 1045 and 1089 bp in the IRa region and between 3845 and 4628 bp in the SSC region. However, the ycf1 gene located in JSB varied between 1045 and 1822 bp in the IRb region and only from one to 64 bp in the SSC region (Figure 6).
We used mVISTA to perform sequence variability analysis using Q. acuta as the reference genome. The results showed a high sequence similarity, where the non-coding and SC regions exhibited higher levels of differentiation than the coding and IR regions among the 20 chloroplast genomes of cycle-cup oaks. Overall, the ycf1 gene was particularly different among the 20 chloroplast genomes, and the sequence similarity of ycf1 gene was < 50% in the three species of Q. fleuryi, Q. glauca, and Q. pachyloma. Moreover, the exon regions of two PCGs (ndhF and ycf1) and the conserved non-coding regions of three IGS (petN—psbM, psbZ—trnG-UCC, and rpl32—trnL-UAG) showed high variability (Figure S2).
Sliding window analysis was performed using the DnaSP software to calculate nucleotide diversity values (Pi) among all chloroplast genomes. The results indicated that the Pi value in the chloroplast genomes of Quercus section Cyclobalanopsis ranged from 0 to 0.01391, with an average of 0.00149. We found seven highly divergent regions (Pi > 0.005), four of which were located in the PCGs (rps16, ndhk, accD, and ycf1) and three in the IGS (psbZ—trnG-GCC, rbcL—accD, and rpl32—trnL-UAG) (Figure 7). These results could potentially provide plastid markers for further taxonomic and phylogenetic studies of Quercus.

3.5. Phylogenetic Relationships

With respect to the ML approach, phylogenetic relationships were reconstructed based on the whole chloroplast genomes of the four species sequenced in this study and closely related species in the Quercus genus. The whole chloroplast genomes of the 31 Quercus species from four sections and two outgroups (F. engleriana and J. mandshurica) were aligned. The results indicated that 31 species of Quercus were clearly differentiated into two clades with high bootstrap support values (Figure 8). Quercus belonging to the subgenus Quercus formed one clade, whereas the other three sections belonging to the subgenus Cerris formed another clade. Of the three sections in the subgenus Cerris, the section Ilex split into two clusters, each nested with the other two sections. Quercus camusiae and Q. semiserrata detected in this study diverged first in the section Cyclobalanopsis and mixed with Q. engleriana from the section Ilex. Followed this cluster, Q. helferiana was differentiated alone. The section Cyclobalanopsis was divided into two major evolutionary clusters, in which Q. poilanei was also located (Figure 8).

3.6. Selection Pressure Analysis

In the present study, a site model of the PAML program was used to detect the selection pressure of common PCGs in the chloroplast genomes of 20 Quercus section Cyclobalanopsis species. A total of 28 and 33 genes with positive selection sites were identified in M2 and M8, respectively. Based on pairwise comparisons of M0 vs. M3, M1 vs. M2, and M7 vs. M8, 33 PCGs with positive selection sites were subjected to the likelihood ratio test (LRT). Genes with a significance of p < 0.05 were selected as positive selection sites. The results showed that a total of 11 PCGs underwent positive selection (atpF, ndhA, ndhD, ndhF, ndhK, petB, petD, rbcL, rpl22, ycf1, and ycf3). Based on the Bayesian empirical Bayes algorithm (BEB) analyses in model M8, 103 sites showed positive selection among the 11 PCGs, 24 of which showed significant positive selection (Table 6 and Table S4).

4. Discussion

4.1. Architecture of Chloroplast Genomes in Quercus Section Cyclobalanopsis

In this study, we successfully assembled the chloroplast genomes of four Quercus section Cyclobalanopsis species. The size of the four chloroplast genomes (~160 kb) corresponded to that of photosynthetic land plants, which vary in size from 120 to 170 kb [56]. Similar to the chloroplast genome structure of other Quercus species, we found that the chloroplast genomes of Quercus section Cyclobalanopsis are highly conserved with a typical circular tetrad structure [25,27,30,57]. The overall GC content was not distinct among the four species, but the IR regions had a significantly higher GC content than the SC regions owing the presence of unique rRNA genes [30,58]. Genome annotation revealed that the number, order, and function of genes were also highly conserved in Quercus section Cyclobalanopsis.
Nonetheless, the IR regions are important for stabilizing the chloroplast structure. The expansion and contraction of IRs regions are the main factors influencing the length of chloroplast genomes in different species [59]; therefore, they are of great significance for evolutionary research [60]. Differences in the four boundary regions among species frequently lead to further changes in chloroplast genome size [61]. In the present study, the distribution of the boundary genes in the four regions was conserved, except for a slight difference in ndhF in JSB. Most of the compared species of Quercus section Cyclobalanopsis found no significant expansion or contraction in the IR regions, as the same conditions with other Quercus species [25,27,62].
Repeat sequences are widespread in plant genomes and play important roles in the heredity, variation, and evolution of genomes [63,64,65]. We identified simple sequence repeat (SSRs), dispersed repeat sequences (D), and minisatellite repeat sequences (M) in the chloroplast genomes of four Quercus species. The results showed that the detected repeats were essentially composed of A and T bases with a strong A/T preference, which is consistent with previous findings [26,29,66]. Moreover, most of the repeat sequences were located in the LSC and IGS regions, which is consistent with the findings of previous studies [25,27,29]. As effective molecular markers, SSRs have been extensively studied in discrimination, breeding, conservation, and phylogenetic studies at both the species and population level [67,68,69].
Codon usage bias is an important evolutionary feature that is prevalent in biological taxa and subject to natural selection, base mutations, and other factors [70,71]. The GC content at the first, second, and third codon sites in the chloroplast genomes showed a decreasing trend of GC1 > GC2 > GC3. The GC content is the main factor responsible for codon usage bias and may play an important role in the evolution of genome structure [72]. The chloroplast genomes of the four Quercus section Cyclobalanopsis species had a relatively weak codon preference. A total of 30 of the 59 synonymous codons had RSCU values > 1 and ended with A/U. From the RSCU value and GC content, the third codon site was biased towards A/U, which is common in angiosperms [6,73].
The chloroplast genomes of 20 species in Quercus section Cyclobalanopsis were subjected to comparative genomic analyses to study the differences between them. The results showed differences in variation between the regions of the chloroplast genomes. The variation in the SC regions was higher than that in the IR regions, whereas that in the IGS regions was higher than that in the coding regions. In addition, the regions of high variability detected in this study can be used for DNA barcoding and species identification and classification [74,75].

4.2. Phylogeny and Evolution of the Quercus Chloroplast Genome

As a species-rich, widely distributed, and long-lived genus, Quercus is a hotspot plant for phylogenetic research [76,77,78,79,80,81]. Due to complex evolutionary issues such as convergent evolution, extensive introgressive hybridization, and incomplete lineage classification, the phylogenetic/phylogenomic studies of Quercus have received significant attention from botanists [82,83,84]. Therefore, we performed a phylogenetic analysis of Quercus species using four new complete chloroplast genomes from cycle-cup oaks.
Based on restriction site-associated DNA sequencing of nuclear DNA, Quercus subgenus Cerris is divided into three recognized sections: Cyclobalanopsis, Cerris, and Ilex [85,86]. The chloroplast phylogenomics in previous studies supported the nesting of the Cerris and Cyclobalanopsis sections in section Ilex [24,29]. Notably, Quercus section Ilex was paraphyletic, and the section Cerris nested into the first branch of Section Ilex. Except for Q. poilanei, the other three species in this study were located at the base in section Cyclobalanopsis. Incomplete lineage classification or introgression between the ancestral lineages in these three sections plays an important role in shaping the current relationships. In addition, oaks are actually considered typical hybrid species [85]. Overall, this study greatly enriches the chloroplast genome resources of Quercus, which provides convenience for further analysis of phylogenetic and internal genetic relationships.
At the chloroplast genome level, we found that 11 PCGs had undergone positive selection in the Quercus section Cyclobalanopsis. Among these, the ycf1 gene was found to have the most sites under positive selection; however, the possible evolutionary significance of this result remains to be elucidated owing to the uncertainty of the function of this gene. The atpF gene encodes a subunit of H+-ATP synthase, which is required for electron transport and photophosphorylation during photosynthesis [87]. The adaptive evolution of atpF may affect the chloroplast energy metabolism [88]. Positive selection was detected in four ndh genes (ndhA, ndhD, ndhF, and ndhK) whose adaptive evolution may influence energy conversion and resistance to photooxidative stress [89,90]. Notably, the ndh genes were lost or pseudogenized in many gymnosperms [91]. The rbcL gene plays an important role in photosynthesis and is subject to positive selection in many higher plants [92]. Furthermore, petD and petB also underwent positive selection; however, more evidence is needed to confirm their evolutionary significance. Some researchers have found that petD gene mutation can reduce the photosynthetic rate of chlamydomonas [93]. Our identification of positively selected genes in this analysis could lead to a better understanding of the evolution of Quercus species.

Supplementary Materials

The following supporting information can be downloaded at: https://www.mdpi.com/article/10.3390/genes15020230/s1. Figure S1: Mauve alignment of 20 chloroplast genomes of Quercus section Cyclobalanopsis. The box structure below the genome represents the corresponding gene annotation information: the white rectangle represents PCGs, the red rectangle represents rRNAs, and the green rectangle represents tRNAs. The introns are connected by line segments; Figure S2: Sequence alignment of the chloroplast genomes of four Quercus section Cyclobalanopsis species. The Q. acuta was used as reference. The gray arrow above the map shows the location of the reference sequence gene, and the direction of the arrow is the forward or reverse direction of the gene. The position of the genome is shown on the horizontal axis at the bottom of each block. The alignment similarity percentages are shown on the right side of the map (vertical axis). Genome regions are color coded as exon, UTR, mRNA, and conserved non-coding sequences (CNS); Table S1: Simple sequence repeats (SSRs) number in the chloroplast genomes of four Quercus section Cyclobalanopsis species. Abbreviations: LSC (Large Single Copy), SSC (Small Single Copy), IRs (Inverted Repeats), IGS (Intergenic Spacer), and GR (Gene Region); Table S2a: Codon parameter characterization of chloroplast genome of Q. poilanei. Abbreviations: ENC (Effective Number of Codon); Table S2b: Codon parameter characterization of chloroplast genome of Q. helferiana. Abbreviations: ENC (Effective Number of Codon); Table S2c: Codon parameter characterization of chloroplast genome of Q. camusiae and Q. semiserrata. Abbreviations: ENC (Effective Number of Codon); Table S3: The relative synonymous codon usage in four chloroplast genomes of Quercus section Cyclobalanopsis; Table S4: Likelihood ratio test (LRT) and positive selection sites under different site models of PCGs of four Quercus section Cyclobalanopsis.

Author Contributions

Conceptualization, Y.-G.S. and J.X.; methodology, L.-L.W. and Y.L.; software, L.-L.W. and Y.L.; validation, Y.L., J.X. and Y.-G.S.; formal analysis, L.-L.W.; investigation, Y.L.; resources, Y.-G.S.; data curation, L.-L.W. and Y.L.; writing—original draft preparation, L.-L.W. and Y.L.; writing—review and editing, Y.-G.S., G.K., S.-S.Z., J.X. and Y.L.; visualization, L.-L.W., Y.L. and Y.-G.S.; supervision, Y.-G.S. and J.X.; project administration, Y.-G.S.; funding acquisition, J.X. and Y.-G.S. All authors have read and agreed to the published version of the manuscript.

Funding

This work was supported by Youth Teacher Science and Technology Talent Development Program of Shanghai Institute of Technology (ZQ2022-17) and the Special Fund for Scientific Research of Shanghai Landscaping & City Appearance Administrative Bureau (G242414, G242416).

Institutional Review Board Statement

Not applicable.

Informed Consent Statement

Not applicable.

Data Availability Statement

The data that support the finding of this study are openly available in the GenBank of NCBI at https://www.ncbi.nlm.nih.gov (accessed on 15 July 2023), reference number (OR835153).

Conflicts of Interest

The authors declare no conflict of interest. The funders had no role in the design of the study; in the collection, analyses, or interpretation of data; in the writing of the manuscript; or in the decision to publish the results.

References

  1. Harlan, J.R. Our Vanishing Genetic Resources: Modern varieties replace ancient populations that have provided genetic variability for plant breeding programs. Science 1975, 188, 618–621. [Google Scholar] [CrossRef]
  2. Hoban, S.; Bruford, M.; Jackson, J.D.; Lopes-Fernandes, M.; Heuertz, M.; Hohenlohe, P.A.; Paz-Vinas, I.; Sjögren-Gulve, P.; Segelbacher, G.; Vernesi, C.; et al. Genetic diversity targets and indicators in the CBD post-2020 Global Biodiversity Framework must be improved. Conserv. Genet. 2020, 248, 108654. [Google Scholar] [CrossRef]
  3. Stange, M.; Barrett, R.D.; Hendry, A.P. The importance of genomic variation for biodiversity, ecosystems and people. Nat. Rev. Genet. 2021, 22, 89–105. [Google Scholar] [CrossRef] [PubMed]
  4. Hoban, S.; Archer, F.I.; Bertola, L.D.; Bragg, J.G.; Breed, M.F.; Bruford, M.W.; Coleman, M.A.; Ekblom, R.; Funk, W.C.; Grueber, C.E.; et al. Global genetic diversity status and trends: Towards a suite of Essential Biodiversity Variables (EBVs) for genetic composition. Biol. Rev. Camb. Philos. Soc. 2022, 97, 1511–1538. [Google Scholar] [CrossRef] [PubMed]
  5. Douglas, S.E. Chloroplast origins and evolution. In The Molecular Biology of Cyanobacteria; Springer: Dordrecht, The Netherlands, 1994; pp. 91–118. [Google Scholar]
  6. Jiang, H.; Tian, J.; Yang, J.X.; Dong, X.; Zhong, Z.X.; Mwachala, G.; Zhang, C.F.; Hu, G.W.; Wang, Q.F. Comparative and phylogenetic analyses of six Kenya Polystachya (Orchidaceae) species based on the complete chloroplast genome sequences. BMC Plant Biol. 2022, 22, 177. [Google Scholar] [CrossRef] [PubMed]
  7. Li, H.-T.; Yi, T.-S.; Gao, L.-M.; Ma, P.-F.; Zhang, T.; Yang, J.-B.; Gitzendanner, M.A.; Fritsch, P.W.; Cai, J.; Luo, Y.; et al. Origin of angiosperms and the puzzle of the Jurassic gap. Nat. Plants 2019, 5, 461–470. [Google Scholar] [CrossRef] [PubMed]
  8. Li, H.-T.; Luo, Y.; Gan, L.; Ma, P.-F.; Gao, L.-M.; Yang, J.-B.; Cai, J.; Gitzendanner, M.A.; Fritsch, P.W.; Zhang, T.; et al. Plastid phylogenomic insights into relationships of all flowering plant families. BMC Biol. 2021, 19, 232. [Google Scholar] [CrossRef] [PubMed]
  9. Birky, C.W., Jr. Uniparental inheritance of mitochondrial and chloroplast genes: Mechanisms and evolution. Proc. Natl. Acad. Sci. USA 1995, 92, 11331–11338. [Google Scholar] [CrossRef] [PubMed]
  10. Hodel, R.G.; Knowles, L.L.; McDaniel, S.F.; Payton, A.C.; Dunaway, J.F.; Soltis, P.S.; Soltis, D.E. Terrestrial species adapted to sea dispersal: Differences in propagule dispersal of two Caribbean mangroves. Mol. Ecol. 2018, 27, 4612–4626. [Google Scholar] [CrossRef]
  11. Nock, C.J.; Baten, A.; King, G.J. Complete chloroplast genome of Macadamia integrifoliaconfirms the position of the Gondwanan early-diverging eudicot family Proteaceae. BMC Genom. 2014, 15, S13. [Google Scholar] [CrossRef]
  12. Ramsey, A.J.; Mandel, J.R. When one genome is not enough: Organellar heteroplasmy in plants. Annu. Plant Rev. Online 2018, 2, 619–658. [Google Scholar] [CrossRef]
  13. Denk, T.; Grimm, G.W.; Manos, P.S.; Deng, M.; Hipp, A.L. An Updated Infrageneric Classification of the Oaks: Review of Previous Taxonomic Schemes and Synthesis of Evolutionary Patterns. In Oaks Physiological Ecology. Exploring the Functional Diversity of Genus Quercus L.; Gil-Pelegrin, E., Peguero-Pina, J., Eds.; Tree Physiology Book Series; Springer: Cham, Switzerland, 2017; Volume 7, pp. 13–38. [Google Scholar]
  14. Jin, D.M.; Yuan, Q.; Dai, X.L.; Kozlowski, G.; Song, Y.G. Enhanced precipitation has driven the evolution of subtropical evergreen broad-leaved forests in eastern China since the early Miocene: Evidence from ring-cupped oaks. J. Syst. Evol. 2023. ahead of print. [Google Scholar] [CrossRef]
  15. Carrero, C.; Jerome, D.; Beckman, E.; Byrne, A.; Coombes, A.J.; Deng, M.; González-Rodríguez, A.; Hoang, V.S.; Khoo, E.; Nguyen, N.; et al. The Red List of Oaks 2020; The Morton Arboretum: Lisle, IL, USA, 2020; p. 5. [Google Scholar]
  16. Manos, P.S.; Zhou, Z.K.; Cannon, C.H. Systematics of Fagaceae: Phylogenetic tests of reproductive trait evolution. Int. J. Plant Sci. 2001, 162, 1361–1379. [Google Scholar] [CrossRef]
  17. Denk, T.; Grimm, G.W. The oaks of western Eurasia: Traditional classifications and evidence from two nuclear markers. Taxon 2010, 59, 351–366. [Google Scholar] [CrossRef]
  18. Deng, M.; Zhou, Z.K.; Li, Q.S. Taxonomy and systematics of Quercus subgenus Cyclobalanopsis. Int. Oaks 2013, 24, 48–60. [Google Scholar]
  19. Xu, J.; Deng, M.; Jiang, X.L.; Westwood, M.; Song, Y.G.; Turkington, R. Phylogeography of Quercus glauca (Fagaceae), a dominant tree of East Asian subtropical evergreen forests, based on three chloroplast DNA interspace sequences. Tree Genet. Genomes 2015, 11, 805. [Google Scholar] [CrossRef]
  20. Xu, J.; Jiang, X.L.; Deng, M.; Westwood, M.; Song, Y.G.; Zheng, S.S. Conservation genetics of rare trees restricted to subtropical montane cloud forests in southern China: A case study from Quercus arbutifolia (Fagaceae). Tree Genet. Genomes 2016, 12, 90. [Google Scholar] [CrossRef]
  21. An, M.; Deng, M.; Zheng, S.S.; Jiang, X.L.; Song, Y.G. Introgression threatens the genetic diversity of Quercus austrocochinchinensis (Fagaceae), an endangered oak: A case inferred by molecular markers. Front. Plant Sci. 2017, 8, 229. [Google Scholar] [CrossRef] [PubMed]
  22. Deng, M.; Jiang, X.L.; Hipp, A.L.; Manos, P.S.; Hahn, M. Phylogeny and biogeography of East Asian evergreen oaks (Quercus section Cyclobalanopsis; Fagaceae): Insights into the Cenozoic history of evergreen broad-leaved forests in subtropical Asia. Mol. Phylogenetics Evol. 2018, 119, 170–181. [Google Scholar] [CrossRef]
  23. Xu, J.; Song, Y.G.; Deng, M.; Jiang, X.L.; Zheng, S.S.; Li, Y. Seed Germination Schedule and Environmental Context Shaped the Population Genetic Structure of Subtropical Evergreen Oaks on the Yun-Gui Plateau, Southwest China. Heredity 2020, 124, 499–513. [Google Scholar] [CrossRef]
  24. Yang, Y.; Zhou, T.; Qian, Z.; Zhao, G. Phylogenetic relationships in Chinese oaks (Fagaceae, Quercus): Evidence from plastid genome using low-coverage whole genome sequencing. Genomics 2021, 113, 1438–1447. [Google Scholar] [CrossRef]
  25. Li, Y.; Wang, T.R.; Kozlowski, G.; Liu, M.H.; Yi, L.T.; Song, Y.G. Complete chloroplast genome of an endangered species Quercus litseoides, and its comparative, evolutionary, and phylogenetic study with other Quercus section Cyclobalanopsis species. Genes 2022, 13, 1184. [Google Scholar] [CrossRef]
  26. Li, X.; Li, Y.; Zang, M.; Li, M.; Fang, Y. Complete chloroplast genome sequence and phylogenetic analysis of Quercus acutissima. Int. J. Mol. Sci. 2018, 19, 2443. [Google Scholar] [CrossRef]
  27. Wang, T.R.; Wang, Z.W.; Song, Y.G.; Kozlowski, G. The complete chloroplast genome sequence of Quercus ningangensis and its phylogenetic implication. Plant Fungal Syst. 2021, 66, 155–165. [Google Scholar] [CrossRef]
  28. Wei, R.; Li, Q. The complete chloroplast genome of endangered species Stemona parviflora: Insight into the phylogenetic relationship and conservation implications. Genes 2022, 13, 1361. [Google Scholar] [CrossRef] [PubMed]
  29. Zhang, R.-S.; Yang, J.; Hu, H.-L.; Xia, R.-X.; Li, Y.-P.; Su, J.-F.; Li, Q.; Liu, Y.-Q.; Qin, L. A high level of chloroplast genome sequence variability in the Sawtooth Oak Quercus acutissima. Int. J. Biol. Macromol. 2020, 152, 340–348. [Google Scholar] [CrossRef] [PubMed]
  30. Yang, Y.; Zhou, T.; Duan, D.; Yang, J.; Feng, L.; Zhao, G. Comparative Analysis of the Complete Chloroplast Genomes of Five Quercus Species. Front. Plant Sci. 2016, 7, 959. [Google Scholar] [CrossRef] [PubMed]
  31. Doyle, J.J.; Doyle, J.L. A rapid DNA isolation procedure for small quantities of fresh leaf tissue. Phytochem. Bull. 1987, 19, 11–15. [Google Scholar]
  32. Batzoglou, S.; Berger, B.; Mesirov, J.; Lander, E.S. Sequencing a genome by walking with clone-end sequences: A mathematical analysis. Genome Res. 1999, 9, 1163–1174. [Google Scholar] [CrossRef] [PubMed]
  33. Jin, J.J.; Yu, W.B.; Yang, J.B.; Song, Y.; DePamphilis, C.W.; Yi, T.S.; Li, D.Z. GetOrganelle: A fast and versatile toolkit for accurate de novo assembly of organelle genomes. Genome Biol. 2020, 21, 241. [Google Scholar] [CrossRef] [PubMed]
  34. Wick, R.R.; Schultz, M.B.; Zobel, J.; Holt, K.E. Bandage: Interactive visualization of de novo genome assemblies. Bioinformatics 2015, 31, 3350–3352. [Google Scholar] [CrossRef] [PubMed]
  35. Tillich, M.; Lehwark, P.; Pellizzer, T.; Ulbricht-Jones, E.S.; Fischer, A.; Bock, R.; Greiner, S. GeSeq–versatile and accurate annotation of organelle genomes. Nucleic Acids Res. 2017, 45, W6–W11. [Google Scholar] [CrossRef] [PubMed]
  36. Lohse, M.; Drechsel, O.; Kahlau, S.; Bock, R. OrganellarGenomeDRAW—A suite of tools for generating physical maps of plastid and mitochondrial genomes and visualizing expression data sets. Nucleic Acids Res. 2013, 41, W575–W581. [Google Scholar] [CrossRef] [PubMed]
  37. Kearse, M.; Moir, R.; Wilson, A.; Stones-Havas, S.; Cheung, M.; Sturrock, S.; Drummond, A. Geneious Basic: An integrated and extendable desktop software platform for the organization and analysis of sequence data. Bioinformatics 2012, 28, 1647–1649. [Google Scholar] [CrossRef] [PubMed]
  38. Beier, S.; Thiel, T.; Münch, T.; Scholz, U.; Mascher, M. MISA-web: A web server for microsatellite prediction. Bioinformatics 2017, 33, 2583–2585. [Google Scholar] [CrossRef]
  39. Kurtz, S.; Choudhuri, J.V.; Ohlebusch, E.; Schleiermacher, C.; Stoye, J.; Giegerich, R. REPuter: The manifold applications of repeat analysis on a genomic scale. Nucleic Acids Res. 2001, 29, 4633–4642. [Google Scholar] [CrossRef]
  40. Benson, G. Tandem repeats finder: A program to analyze DNA sequences. Nucleic Acids Res. 1999, 27, 573–580. [Google Scholar] [CrossRef]
  41. Liang, C.; Wang, L.; Lei, J.; Duan, B.; Ma, W.; Xiao, S.; Qi, H.; Wang, Z.; Liu, Y.; Shen, X.; et al. A comparative analysis of the chloroplast genomes of four Salvia medicinal plants. Engineering 2019, 5, 907–915. [Google Scholar] [CrossRef]
  42. Gribskov, M.; Devereux, J.; Burgess, R.R. The codon preference plot: Graphic analysis of protein coding sequences and prediction of gene expression. Nucleic Acids Res. 1984, 12, 539–549. [Google Scholar] [CrossRef] [PubMed]
  43. Sharp, P.M.; Li, W.H. The codon adaptation index-a measure of directional synonymous codon usage bias, and its potential applications. Nucleic Acids Res. 1987, 15, 1281–1295. [Google Scholar] [CrossRef]
  44. Amiryousefi, A.; Hyvönen, J.; Poczai, P. IRscope: An online program to visualize the junction sites of chloroplast genomes. Bioinformatics 2018, 34, 3030–3031. [Google Scholar] [CrossRef] [PubMed]
  45. Brudno, M.; Malde, S.; Poliakov, A.; Do, C.B.; Couronne, O.; Dubchak, I.; Batzoglou, S. Glocal alignment: Finding rearrangements during alignment. Bioinformatics 2003, 19 (Suppl. 1), i54–i62. [Google Scholar] [CrossRef] [PubMed]
  46. Katoh, K.; Standley, D.M. MAFFT multiple sequence alignment software version 7: Improvements in performance and usability. Mol. Biol. Evol. 2013, 30, 772–780. [Google Scholar] [CrossRef] [PubMed]
  47. Rozas, J.; Ferrer-Mata, A.; Sánchez-DelBarrio, J.C.; Guirao-Rico, S.; Librado, P.; Ramos-Onsins, S.E.; Sánchez-Gracia, A. DnaSP 6: DNA sequence polymorphism analysis of large data sets. Mol. Biol. Evol. 2017, 34, 3299–3302. [Google Scholar] [CrossRef] [PubMed]
  48. Gou, W.; Jia, S.B.; Price, M.; Guo, X.L.; Zhou, S.D.; He, X.J. Complete plastid genome sequencing of eight species from Hansenia, Haplosphaera and Sinodielsia (Apiaceae): Comparative analyses and phylogenetic implications. Plants 2020, 9, 1523. [Google Scholar] [CrossRef] [PubMed]
  49. Guindon, S.; Dufayard, J.F.; Lefort, V.; Anisimova, M.; Hordijk, W.; Gascuel, O. New algorithms and methods to estimate maximum-likelihood phylogenies: Assessing the performance of PhyML 3.0. Syst. Biol. 2010, 59, 307–321. [Google Scholar] [CrossRef] [PubMed]
  50. Nguyen, L.T.; Schmidt, H.A.; Von Haeseler, A.; Minh, B.Q. IQ-TREE: A fast and effective stochastic algorithm for estimating maximum-likelihood phylogenies. Mol. Biol. Evol. 2015, 32, 268–274. [Google Scholar] [CrossRef]
  51. Yang, Z. Estimating the pattern of nucleotide substitution. J. Mol. Evol. 1994, 39, 105–111. [Google Scholar] [CrossRef]
  52. Hurst, L.D. The Ka/Ks ratio: Diagnosing the form of sequence evolution. Trends Genet. 2002, 18, 486–487. [Google Scholar] [CrossRef]
  53. Yang, Z. PAML 4: Phylogenetic analysis by maximum likelihood. Mol. Biol. Evol. 2007, 24, 1586–1591. [Google Scholar] [CrossRef] [PubMed]
  54. Yang, Z.; Nielsen, R. Codon-substitution models for detecting molecular adaptation at individual sites along specific lineages. Mol. Biol. Evol. 2002, 19, 908–917. [Google Scholar] [CrossRef]
  55. Anisimova, M.; Gascuel, O. Approximate likelihood-ratio test for branches: A fast, accurate, and powerful alternative. Syst. Biol. 2006, 55, 539–552. [Google Scholar] [CrossRef]
  56. Wicke, S.; Schneeweiss, G.M.; Depamphilis, C.W.; Müller, K.F.; Quandt, D. The evolution of the plastid chromosome in land plants: Gene content, gene order, gene function. Plant Mol. Biol. 2011, 76, 273–297. [Google Scholar] [CrossRef] [PubMed]
  57. Yin, K.; Zhang, Y.; Li, Y.; Du, F.K. Different natural selection pressures on the atpF gene in evergreen sclerophyllous and deciduous oak species: Evidence from comparative analysis of the complete chloroplast genome of Quercus aquifolioides with other oak species. Int. J. Mol. Sci. 2018, 19, 1042. [Google Scholar] [CrossRef] [PubMed]
  58. Zong, D.; Zhou, A.; Zhang, Y.; Zou, X.; Li, D.; Duan, A.; He, C. Characterization of the complete chloroplast genomes of five Populus species from the western Sichuan plateau, southwest China: Comparative and phylogenetic analyses. PeerJ 2019, 7, e6386. [Google Scholar] [CrossRef] [PubMed]
  59. Maréchal, A.; Brisson, N. Recombination and the maintenance of plant organelle genome stability. New Phytol. 2010, 186, 299–317. [Google Scholar] [CrossRef] [PubMed]
  60. Cai, Z.; Penaflor, C.; Kuehl, J.V.; Leebens-Mack, J.; E Carlson, J.; Depamphilis, C.W.; Boore, J.L.; Jansen, R.K. Complete Plastid Genome Sequences of Drimys, Liriodendron, and Piper: Implications for the Phylogenetic Relationships of Magnoliids. BMC Evol. Biol. 2006, 6, 77. [Google Scholar] [CrossRef] [PubMed]
  61. Kim, K.; Lee, S.-C.; Lee, J.; Yu, Y.; Yang, K.; Choi, B.-S.; Koh, H.-J.; Waminal, N.E.; Choi, H.-I.; Kim, N.-H.; et al. Complete chloroplast and ribosomal sequences for 30 accessions elucidate evolution of Oryza AA genome species. Sci. Rep. 2015, 5, 15655. [Google Scholar] [CrossRef] [PubMed]
  62. Liu, X.; Chang, E.M.; Liu, J.F.; Huang, Y.N.; Wang, Y.; Yao, N.; Jiang, Z.P. Complete chloroplast genome sequence and phylogenetic analysis of Quercus bawanglingensis Huang, Li et Xing, a vulnerable oak tree in China. Forests 2019, 10, 587. [Google Scholar] [CrossRef]
  63. Novák, P.; Guignard, M.S.; Neumann, P.; Kelly, L.J.; Mlinarec, J.; Koblížková, A.; Leitch, A.R. Repeat-sequence turnover shifts fundamentally in species with large genomes. Nat. Plants 2020, 6, 1325–1329. [Google Scholar] [CrossRef]
  64. Weng, M.L.; Blazier, J.C.; Govindu, M.; Jansen, R.K. Reconstruction of the ancestral plastid genome in Geraniaceae reveals a correlation between genome rearrangements, repeats, and nucleotide substitution rates. Mol. Biol. Evol. 2014, 31, 645–659. [Google Scholar] [CrossRef] [PubMed]
  65. Timme, R.E.; Kuehl, J.V.; Boore, J.L.; Jansen, R.K. A comparative analysis of the Lactuca and Helianthus (Asteraceae) plastid genomes: Identification of divergent regions and categorization of shared repeats. Am. J. Bot. 2007, 94, 302–312. [Google Scholar] [CrossRef] [PubMed]
  66. Morton, B.R. The influence of neighboring base composition on substitutions in plant chloroplast coding sequences. Mol. Biol. Evol. 1997, 14, 189–194. [Google Scholar] [CrossRef]
  67. Yan, X.; Liu, T.; Yuan, X.; Xu, Y.; Yan, H.; Hao, G. Chloroplast genomes and comparative analyses among thirteen taxa within Myrsinaceae s. str. clade (Myrsinoideae, Primulaceae). Int. J. Mol. Sci. 2019, 20, 4534. [Google Scholar] [CrossRef] [PubMed]
  68. Nadeem, M.A.; Nawaz, M.A.; Shahid, M.Q.; Doğan, Y.; Comertpay, G.; Yıldız, M.; Hatipoğlu, R.; Ahmad, F.; Alsaleh, A.; Labhane, N.; et al. DNA molecular markers in plant breeding: Current status and recent advancements in genomic selection and genome editing. Biotechnol. Biotechnol. Equip. 2018, 32, 261–285. [Google Scholar] [CrossRef]
  69. Mohammad-Panah, N.; Shabanian, N.; Khadivi, A.; Rahmani, M.S.; Emami, A. Genetic structure of gall oak (Quercus infectoria) characterized by nuclear and chloroplast SSR markers. Tree Genet. Genomes 2017, 13, 70. [Google Scholar] [CrossRef]
  70. Xu, C.; Cai, X.; Chen, Q.; Zhou, H.; Cai, Y.; Ben, A. Factors affecting synonymous codon usage bias in chloroplast genome of oncidium gower ramsey. Evol. Bioinform. 2011, 7, 271–278. [Google Scholar] [CrossRef]
  71. Chakraborty, S.; Yengkhom, S.; Uddin, A. Analysis of codon usage bias of chloroplast genes in Oryza species: Codon usage of chloroplast genes in Oryza species. Planta 2020, 252, 67. [Google Scholar] [CrossRef]
  72. Yang, Y.; Zhu, J.; Feng, L.; Zhou, T.; Bai, G.; Yang, J.; Zhao, G. Plastid genome comparative and phylogenetic analyses of the key genera in Fagaceae: Highlighting the effect of codon composition bias in phylogenetic inference. Front. Plant Sci. 2018, 9, 82. [Google Scholar] [CrossRef]
  73. Chi, X.; Zhang, F.; Dong, Q.; Chen, S. Insights into Comparative Genomics, Codon Usage Bias, and Phylogenetic Relationship of Species from Biebersteiniaceae and Nitrariaceae Based on Complete Chloroplast Genomes. Plants 2020, 9, 1605. [Google Scholar] [CrossRef]
  74. Dong, W.; Liu, J.; Yu, J.; Wang, L.; Zhou, S. Highly variable chloroplast markers for evaluating plant phylogeny at low taxonomic levels and for DNA barcoding. PLoS ONE 2012, 7, e35071. [Google Scholar] [CrossRef] [PubMed]
  75. Dong, W.; Xu, C.; Li, C.; Sun, J.; Zuo, Y.; Shi, S.; Cheng, T.; Guo, J.; Zhou, S. Ycf1, the most promising plastid DNA barcode of land plants. Sci. Rep. 2015, 5, 8348. [Google Scholar] [CrossRef] [PubMed]
  76. Cavender-Bares, J.; González-Rodríguez, A.; Eaton, D.A.; Hipp, A.A.; Beulke, A.; Manos, P.S. Phylogeny and biogeography of the American live oaks (Quercus subsection Virentes): A genomic and population genetics approach. Mol. Ecol. 2015, 24, 3668–3687. [Google Scholar] [CrossRef] [PubMed]
  77. Eaton, D.A.; Hipp, A.L.; González-Rodríguez, A.; Cavender-Bares, J. Historical introgression among the American live oaks and the comparative nature of tests for introgression. Evolution 2015, 69, 2587–2601. [Google Scholar] [CrossRef] [PubMed]
  78. Gugger, P.F.; Cavender-Bares, J. Molecular and morphological support for a Florida origin of the Cuban oak. J. Biogeogr. 2013, 40, 632–645. [Google Scholar] [CrossRef]
  79. Hipp, A.L.; Eaton, D.A.; Cavender-Bares, J.; Fitzek, E.; Nipper, R.; Manos, P.S. A framework phylogeny of the American oak clade based on sequenced RAD data. PLoS ONE 2014, 9, e93975. [Google Scholar] [CrossRef]
  80. Manos, P.S.; Doyle, J.J.; Nixon, K.C. Phylogeny, biogeography, and processes of molecular differentiation in Quercus subgenus Quercus (Fagaceae). Mol. Phylogenetics Evol. 1999, 12, 333–349. [Google Scholar] [CrossRef]
  81. Petit, R.J.; Bodénès, C.; Ducousso, A.; Roussel, G.; Kremer, A. Hybridization as a mechanism of invasion in oaks. New Phytol. 2004, 161, 151–164. [Google Scholar] [CrossRef]
  82. Burgarella, C.; Lorenzo, Z.; Jabbour-Zahab, R.; Lumaret, R.; Guichoux, E.; Petit, R.J.; Soto, A.; Gil, L. Detection of hybrids in nature: Application to oaks (Quercus suber and Q. ilex). Heredity 2009, 102, 442–452. [Google Scholar] [CrossRef] [PubMed]
  83. Leroy, T.; Louvet, J.M.; Lalanne, C.; Le Provost, G.; Labadie, K.; Aury, J.M.; Delzon, S.; Plomion, C.; Kremer, A. Adaptive introgression as a driver of local adaptation to climate in European white oaks. New Phytol. 2020, 226, 1171–1182. [Google Scholar] [CrossRef] [PubMed]
  84. Ortego, J.; Gugger, P.F.; Riordan, E.C.; Sork, V.L. Influence of climatic niche suitability and geographical overlap on hybridization patterns among southern Californian oaks. J. Biogeogr. 2014, 41, 1895–1908. [Google Scholar] [CrossRef]
  85. Rushton, B.S. Natural hybridization within the genus Quercus L. Ann. For. Sci. 1993, 50, 73s–90s. [Google Scholar] [CrossRef]
  86. Hipp, A.L.; Manos, P.S.; Hahn, M.; Avishai, M.; Bodénès, C.; Cavender-Bares, J.; Crowl, A.A.; Deng, M.; Denk, T.; Fitz-Gibbon, S.; et al. Genomic landscape of the global oak phylogeny. New Phytol. 2020, 226, 1198–1212. [Google Scholar] [CrossRef] [PubMed]
  87. Hudson, G.S.; Mason, J.G. The chloroplast genes encoding subunits of the H+-ATP synthase. Photosynth. Res. 1988, 18, 205–222. [Google Scholar] [CrossRef] [PubMed]
  88. Mitchell, P. Chemiosmotic coupling in oxidative and photosynthetic phosphorylation. Biol. Rev. Camb. Philos. Soc. 1966, 41, 445–502. [Google Scholar] [CrossRef] [PubMed]
  89. Martin, M.; Casano, L.M.; Sabater, B. Identification of the product of ndhA gene as a thylakoid protein synthesized in response to photooxidative treatment. Plant Cell Physiol. 1996, 37, 293–298. [Google Scholar] [CrossRef] [PubMed]
  90. Endo, T.; Shikanai, T.; Takabayashi, A.; Asada, K.; Sato, F. The role of chloroplastic NAD(P)H dehydrogenase in photoprotection. FEBS Lett. 1999, 457, 5–8. [Google Scholar] [CrossRef] [PubMed]
  91. Martin, M.; Sabater, B. Plastid ndh genes in plant evolution. Plant Physiol. Biochem. 2010, 48, 636–645. [Google Scholar] [CrossRef] [PubMed]
  92. Martin-Avila, E.; Lim, Y.-L.; Birch, R.; Dirk, L.M.; Buck, S.; Rhodes, T.; Sharwood, R.E.; Kapralov, M.V.; Whitney, S.M. Modifying plant photosynthesis and growth via simultaneous chloroplast transformation of Rubisco large and small subunits. Plant Cell 2020, 32, 2898–2916. [Google Scholar] [CrossRef]
  93. Chen, X.; Kindle, K.; Stern, D. Initiation codon mutations in the Chlamydomonas chloroplast petD gene result in temperature-sensitive photosynthetic growth. EMBO J. 1993, 12, 3627–3635. [Google Scholar] [CrossRef]
Figure 1. The chloroplast genome map of four Quercus section Cyclobalanopsis species. The outermost circle is the genes annotated in the chloroplast genome. Genes outside the circle are transcribed in the counterclockwise direction, whereas those inside the circle are transcribed in the clockwise direction. Different colored genes refer to different functions. The length and boundary of the LSC, SSC, and two IRs are indicated in the inner circle. The dark gray area indicates GC content while the lighter gray corresponds to the AT content of the genome. The gray arrows represent that sequences are selected in a forward direction. “*” represents that gene has intron.
Genes 15 00230 g001
Figure 2. The number and distribution of SSRs of four Quercus section Cyclobalanopsis chloroplast genomes: (a) The number of SSRs with six repeat types (mononucleotides: mono-, dinucleotides: di-, trinucleotides: tri-, tetranucleotides: tetra-, pentanucleotides: penta-, and hexanucleotides: hexa-) and (b) The number of SSRs in different regions of chloroplast genomes.
Genes 15 00230 g002
Figure 3. The length distribution of dispersed repeat sequences: minisatellite repeat sequences (a) and minisatellite repeat sequences (b) of four Quercus section Cyclobalanopsis species.
Genes 15 00230 g003
Figure 4. The RSCU analysis of chloroplast genomes of four Quercus section Cyclobalanopsis species.
Genes 15 00230 g004
Figure 5. ENC-plot analysis (ad), PR2-bias-plot analysis (eh), and neutrality-plot analysis (il) of chloroplast genomes of four Quercus section Cyclobalanopsis species.
Genes 15 00230 g005
Figure 6. Comparison of the junction regions (JLA, JLB, JSB, and JSA) among 20 chloroplast genomes of Quercus section Cyclobalanopsis species. Genes are denoted by colored boxes. The numbers above the gene boxes indicates the distance between the end of the gene and the border sites.
Genes 15 00230 g006
Figure 7. Sliding window analysis of the 20 chloroplast genomes of Quercus section Cyclobalanopsis. The X-axis represents nucleotide positions of the middle point of the window and the Y-axis represents the value of nucleotide diversity (Pi) per window.
Genes 15 00230 g007
Figure 8. The phylogenetic tree among 33 of the chloroplast complete genomes based on the ML method. Values beside the branch represented bootstrap support (BS). Abbreviations: Quercus (Q.), Fagus (F.), and Juglans (J.).
Genes 15 00230 g008
Table 1. Basic information about four Quercus section Cyclobalanopsis species in this study.
SpeciesVoucher No.GenBank Accession No.Latitude (N)Longitude (E)Place of Collection
Q. poilaneiDM15650OR83515323.416667108.36667Daming Mountain, China
Q. helferianaDM19757OR83515418.49561199.302050Kun Tan National Park, Thailand
Q. camusiaeDM19880OR96688718.53958998.534078Mae Klang Luang Trail, Thailand
Q. semiserrataDM19890OR96688818.54148398.543278Mae Klang Luang Trail, Thailand
Table 2. Complete chloroplast genome structures and features of four Quercus section Cyclobalanopsis species. Abbreviations: LSC (Large Single Copy), SSC (Small Single Copy), IR (Inverted Repeat), GC (guanine and cytosine), PCGs (Protein coding genes), tRNA (Transfer RNA gene), and rRNA (Ribosomal RNA gene).
SpeciesQ. poilaneiQ. helferianaQ. camusiaeQ. semiserrata
Genome size (bp)160,784160,878161,632161,630
Length of LSC (bp)90,21690,34390,29490,292
Length of IRs (a/b) (bp)25,84225,82926,59326,593
Length of SSC (bp)18,88418,87718,15218,152
Total GC content (%)36.936.936.936.9
GC content of LSC (%)34.7434.7434.7534.75
GC content of IRs (%)42.7742.7042.3542.35
GC content of SSC (%)31.1131.1131.2231.22
Number of genes131131131131
Number of PCGs86868686
Number of tRNAs37373737
Number of rRNAs8888
Table 3. Gene classification of the chloroplast genomes of four Quercus section Cyclobalanopsis species. Genes marked with the * or ** sign are the genes with single or double introns, respectively. The duplicated genes located in IR regions are marked as (×2).
CategoryGene GroupGene Name
PhotosynthesisPhotosystem IpsaA, psaB, psaC, psaI, psaJ
Photosystem IIpsbA, psbB, psbC, psbD, psbE, psbF, psbH, psbI, psbJ, psbK, psbL, psbM, psbN, psbT, psbZ
NADH dehydrogenasendhA*, ndhB*(×2), ndhC, ndhD, ndhE, ndhF, ndhG, ndhH, ndhI, ndhJ, ndhK
Cytochrome b/f complexpetA, petB*, petD*, petG, petL, petN
ATP synthaseatpA, atpB, atpE, atpF*, atpH, atpI
Rubisco of Large subunitrbcL
Transcription and translationTranslation initiation factorinfA
Ribosomal Proteins (LSU)rpl14, rpl16*, rpl2*(×2), rpl20, rpl22,
rpl23(×2), rpl32, rpl33, rpl36
Ribosomal Proteins (SSU)rps11, rps12**(×2), rps14, rps15, rps16*, rps18, rps19, rps2, rps3, rps4, rps7(×2), rps8
RNA polymeraserpoA, rpoB, rpoC1*, rpoC2
Ribosomal RNAsrrn16(×2), rrn23(×2), rrn4.5(×2), rrn5(×2)
Transfer RNAstrnA-UGC*(×2), trnC-GCA, trnD-GUC, trnE-UUC, trnF-GAA, trnG-GCC, trnG-UCC*, trnH-GUG, trnI-CAU(×2), trnI-GAU*(×2), trnK-UUU*, trnL-CAA(×2), trnL-UAA*, trnL-UAG, trnM-CAU, trnN-GUU(×2), trnP-UGG, trnQ-UUG, trnR-ACG(×2), trnR-UCU, trnS-GCU, trnS-GGA, trnS-UGA, trnT-GGU, trnT-UGU, trnV-GAC(×2), trnV-UAC*, trnW-CCA, trnY-GUA, trnfM-CAU
BiosynthesisMaturasematK
ATP-dependendent Protease clpP1**
Acetyl-CoA carboxylaseaccD
Envelope membrane proteincemA
C-type cytochrome synthesis geneccsA
UnknownConserved hypothetical chloroplast ORFycf1(×2), ycf2(×2), ycf3 **, ycf4
Table 4. Distribution and number (proportion) of simple sequence repeats (SSRs) of four Quercus section Cyclobalanopsis species. Abbreviations: IGS (intergenic spacer) and CDS (coding sequence).
SpeciesNo. (Proportion) of SSRsDistribution of SSRs
LSCSSCIRsIGSCDSIntron
Q. poilanei116 (24.32%)881810841616
Q. helferiana115 (24.10%)87208801619
Q. camusiae123 (25.79%)902310852018
Q. semiserrata123 (25.79%)902310852018
Total477 (100%)355 (74.4%)84 (17.6%)38 (8%)334 (70%)72 (15.1%)71 (14.9%)
Table 5. The number and length distribution of minisatellite repeat sequences and dispersed repeat sequences of four Quercus section Cyclobalanopsis species. Abbreviations: M (minisatellite repeat sequence), D (dispersed repeat sequence), F (forward repeat sequence), R (reverse repeat sequence), C (complementary repeat sequence), and P (palindromic repeat sequence).
SpeciesNo. of Repeat SequencesLength Distribution of MLength Distribution of D
MFRPC910–1920–29313031–4041–5051–6064
Q. poilanei311432110181121522110
Q. helferiana30182230119822017510
Q. camusiae28152190119721519101
Q. semiserrata28152190019721618101
Total1176298212753386676822
Table 6. Likelihood ratio test (LRT) and positive selection sites under different site models of PCGs of four Quercus section Cyclobalanopsis (Taking atpF for example). “**” represents a value of positively selected sites greater than 99%.
GeneatpF
Model ComparisonM0 vs. M3M1 vs. M2M7 vs. M8
df422
ΔlnL36.48447821.96564122.022258
2ΔlnL72.96895643.93128244.044516
LRT (p-value)5.35604 × 10−152.88698 × 10−102.72807 × 10⁻¹⁰
Positively selected sites/17A (0.621), 49S (0.996 **), 50D (0.993 **), 52N (0.994 **), 54R (1.000 **), 104N (0.545)17A (0.674), 49S (0.998 **), 50D (0.997 **), 52N (0.998 **), 54R (1.000 **), 104N (0.598)
Disclaimer/Publisher’s Note: The statements, opinions and data contained in all publications are solely those of the individual author(s) and contributor(s) and not of MDPI and/or the editor(s). MDPI and/or the editor(s) disclaim responsibility for any injury to people or property resulting from any ideas, methods, instructions or products referred to in the content.

