
Comparative and Phylogenetic Analysis of Complete Chloroplast Genomes in Leymus (Triticodae, Poaceae)
by
 ,
,
Zinian Wu
1,2 ,
,
Chunyu Tian
1,2,
Yanting Yang
1,2,
Yuanheng Li
1,
Qian Liu
1,2,
Zhiyong Li
1,2,* and
Ke Jin
1,* 1
Institute of Grassland Research, Chinese Academy of Agricultural Sciences, Hohhot 010010, China
2
Key Laboratory of Grassland Resources and Utilization of Ministry of Agriculture, Hohhot 010010, China
*
Authors to whom correspondence should be addressed.
Genes 2022, 13(8), 1425; https://doi.org/10.3390/genes13081425
Submission received: 25 July 2022
/
Revised: 8 August 2022
/
Accepted: 8 August 2022
/
Published: 10 August 2022
(This article belongs to the Special Issue Advances in Evolution of Plant Organelle Genome)
Abstract
:Leymus is a perennial genus that belongs to the tribe Triticeae (Poaceae) which has an adaptive capacity to ecological conditions and strong resistance to cold, drought, and salinity. Most Leymus species are fine herbs that can be used for agriculture, conservation, and landscaping. Due to confusion taxonomy within genera, the complete chloroplast (cp) genome of 13 Leymus species was sequenced, assembled, and compared with those of three other previously published Leymus species (Leymus condensatus, Leymus angustus, and Leymus mollis) to clarify the issue. Overall, the whole cp genome size ranged between 135,057 (L. condensatus) and 136,906 bp (Leymus coreanus) and showed a typical quadripartite structure. All studied species had 129 genes, including 83 protein-coding genes, 38 transfer RNAs, and 8 ribosomal RNAs. In total, 800 tandem repeats and 707 SSR loci were detected, most of which were distributed in the large single-copy region, followed by the inverted repeat (IR) and small single-copy regions. The sequence identity of all sequences was highly similar, especially concerning the protein-coding and IR regions; in particular, the protein-coding regions were significantly similar to those in the IR regions, regardless of small sequence differences in the whole cp genome. Moreover, the coding regions were more conserved than the non-coding regions. Comparisons of the IR boundaries showed that IR contraction and expansion events were reflected in different locations of rpl22, rps19, ndhH, and psbA genes. The close phylogenetic relationship of Leymus and Psathyrostachys indicated that Psathyrostachys possibly is the donor of the Ns genome sequence identified in Leymus. Altogether, the complete cp genome sequence of Leymus will lay a solid foundation for future population genetics and phylogeography studies, as well as for the analysis of the evolution of economically valuable plants.
1. Introduction
Leymus Hochst is a significant perennial grass species of Triticeae (Poaceae) that is mainly distributed in Eurasia and North America [1,2] with strong adaptable characteristics to several environmental stressors such as drought, cold, and salinity [3]. Several species have been used for the genetic improvement of Triticeae cereal crops because of their larger spikes, higher grain yields, and better resistance to diseases and insects [4,5]. Nevertheless, its precise taxonomic status and the relationship among Leymus species are still debatable. Although morphological identification is relatively certain during the flowering period, it is difficult to perform morphological identification for roots, stems, and leaves in other growth stages, especially in the seedling stages. Initially, Nevski hypothesized that Leymus consisted of sect. Leymus and sect. Anisopyrum [6], but later on Tzvelev divided Leymus into four parts: sect. Leymus Hochst., sect. Anisopyrum (Griseb.) Tzvelev, sect. Aphanoneuron (Nevski) Tzvelev, and sect. Malacurus (Nevski) Tzvelev [7]. It has been confirmed that single-copy genes, the mitochondrial coxII intron, molecular markers containing AFLP, RAPD, and ISSR, as well as chloroplast intergenic spacers, are useful tools for Leymus species identification and these previous studies provide important evidence for the subdivision [8,9,10,11,12,13,14,15,16]; however, its complex evolutionary history remains unclear.
Chloroplasts (cp) are important semi-autonomous genetic organelles for the process of photosynthesis and carbon fixation [17,18]. The complete cp genome of most angiosperms has typically conserved quadripartite structures with a large single-copy (LSC) region, a small single-copy (SSC) region, and two copies of inverted repeat (IR) regions [18,19,20]. Few plants, such as some Leguminosae species, have cp genomes that are not the typical quadripartite structure owing to the loss of a reverse repetitive sequence [21]. CpDNA is predominantly inherited from the maternal parent; however, exceptions can be observed even though it rarely happens. The highly conserved cp genome can provide more reliable data for phylogenetic studies and is the optimal material for phylogeographic, system taxonomic, phylogenetic, and molecular evolution investigations [22]. To date, complete cp genomes are available for more than 100 Triticodae species, including five Leymus species. According to the evolutionary patterns of the cp genomes among 131 Triticodae species, L. arenarius (MK775256), L. chinensis (MK775258), and L. triticoides (NC_058745), Psathyrostachys species are believed to be closely related to the Eurasia Leymus species [23]. Although the cp genome is very significant, the number of published whole cp genome sequences of the Leymus species is still limited. Furthermore, some sequenced Leymus cp genomes have not been comprehensively and systemically studied.
The cp genome is uniparental, with large numbers of highly conserved and variable regions. Therefore, cpDNA sequences are valuable tools for determining plant barcoding and evolutionary relationships among plant species. Several cpDNA molecular markers, such as trnL-trnF, trnH-psbA, trnK-rps16, and ndhF, have been used to analyze the relationship among Leymus species and other Triticodae [8,11,13,14,24], and shed light into Leymus evolution. However, no systematic studies have been conducted on the development of cpDNA molecular markers of Leymus.
In this study, the cp genomes of 13 Leymus species were sequenced and analyzed along with publicly available data from three other specimens (L. condensatus, L. angustus, and L. mollis). Overall, the collected data were used to analyze and compare the genome characteristics, such as repeat sequences and IR boundaries. Moreover, cpDNA molecular markers for identifying Leymus germplasms were determined and the complete cp genomes were used to construct phylogenetic trees. Taken together, our results are expected to provide valuable genetic information, including new genetic markers for DNA barcoding, as well as enhance knowledge of the evolutionary relationships among Leymus species.
2. Materials and Methods
2.1. Sampling, DNA Extraction, and Genome Sequencing
The cp genomes of Leymus arenarius (MK775256.1), Leymus duthiei (NC_058748), and Leymus komarovii (NC_058744) were obtained from GenBank (Table S1). Plant seeds whose accession numbers start with PI and W6 were obtained from the U.S. National Plant Germplasm System, and those that start with CF were collected by us. The cp genomes of 13 Leymus species were sequenced. Voucher specimens were deposited in the National Medium Term Genebank Forage Germplasm (Hohhot, China) (Supplementary Table S1). Total genomic DNA was isolated from fresh leaves using the CTAB method [25] and sequenced using an Illumina MiSeq platform with PE150 at Sangon Biotech (Shanghai, China).
2.2. Genome Assembly and Genome Annotation
Assembly of the cp genome sequences was performed using GetOrganelle and annotated using PGA [26,27] with manual corrections by Geneious v9.0.2 [28]. The circular cp genome map was visualized using Organellar GenomeDRAW [29]. The 13 assembled complete cp genomes were deposited in GenBank (Table S1).
2.3. Repeats and SSR Identification
2.4. Comparative Genome Analysis
All 13 Leymus cp genomes were aligned using MAFFT v7.313 [32] with default settings. The BRIG [33] and mVISTA [34] software were used to compare the variations among all available Leymus cp genomes, with L. chinensis being set as the reference sequence. In addition, IRScope was used to compare and visualize the junctions and borders of the IR regions [35]. The nucleotide diversity (Pi) rates of sequence divergence between Leymus species were calculated using DnaSP v6.12 [36].
2.5. Phylogenetic Analysis
The complete cp genomes and shared protein-coding genes of the 13 newly sequenced Leymus species were used for phylogenetic analysis, along with those published in NCBI, which included those of three previously sequenced Leymus species (Table S1) and the outgroups Brachypodium distachyon (NC_0110320) and Oryza sativa (NC_011032). All datasets were aligned using MAFFT v7.313 [32] with default settings. ModelFinder was employed to find the best model in PhyloSuite v1.2.2 [37]. The best substitution model based on the complete cp genomes was TVM + F + R2 for the maximum likelihood (ML) and GTR + F + I + G4 for the Bayesian inference (BI) analyses, and the best substitution model based on the shared protein-coding genes was GTR + F + R3 for the maximum likelihood (ML) and GTR + F + I + G4 for the Bayesian inference (BI) analyses, which were performed using RAxML v8.2.11 [38] with 1000 non-parametric bootstrap replicates and MrBayes v3.2.6 [39], respectively.
3. Results
3.1. Characteristics of the Leymus Species Complete Chloroplast Genomes
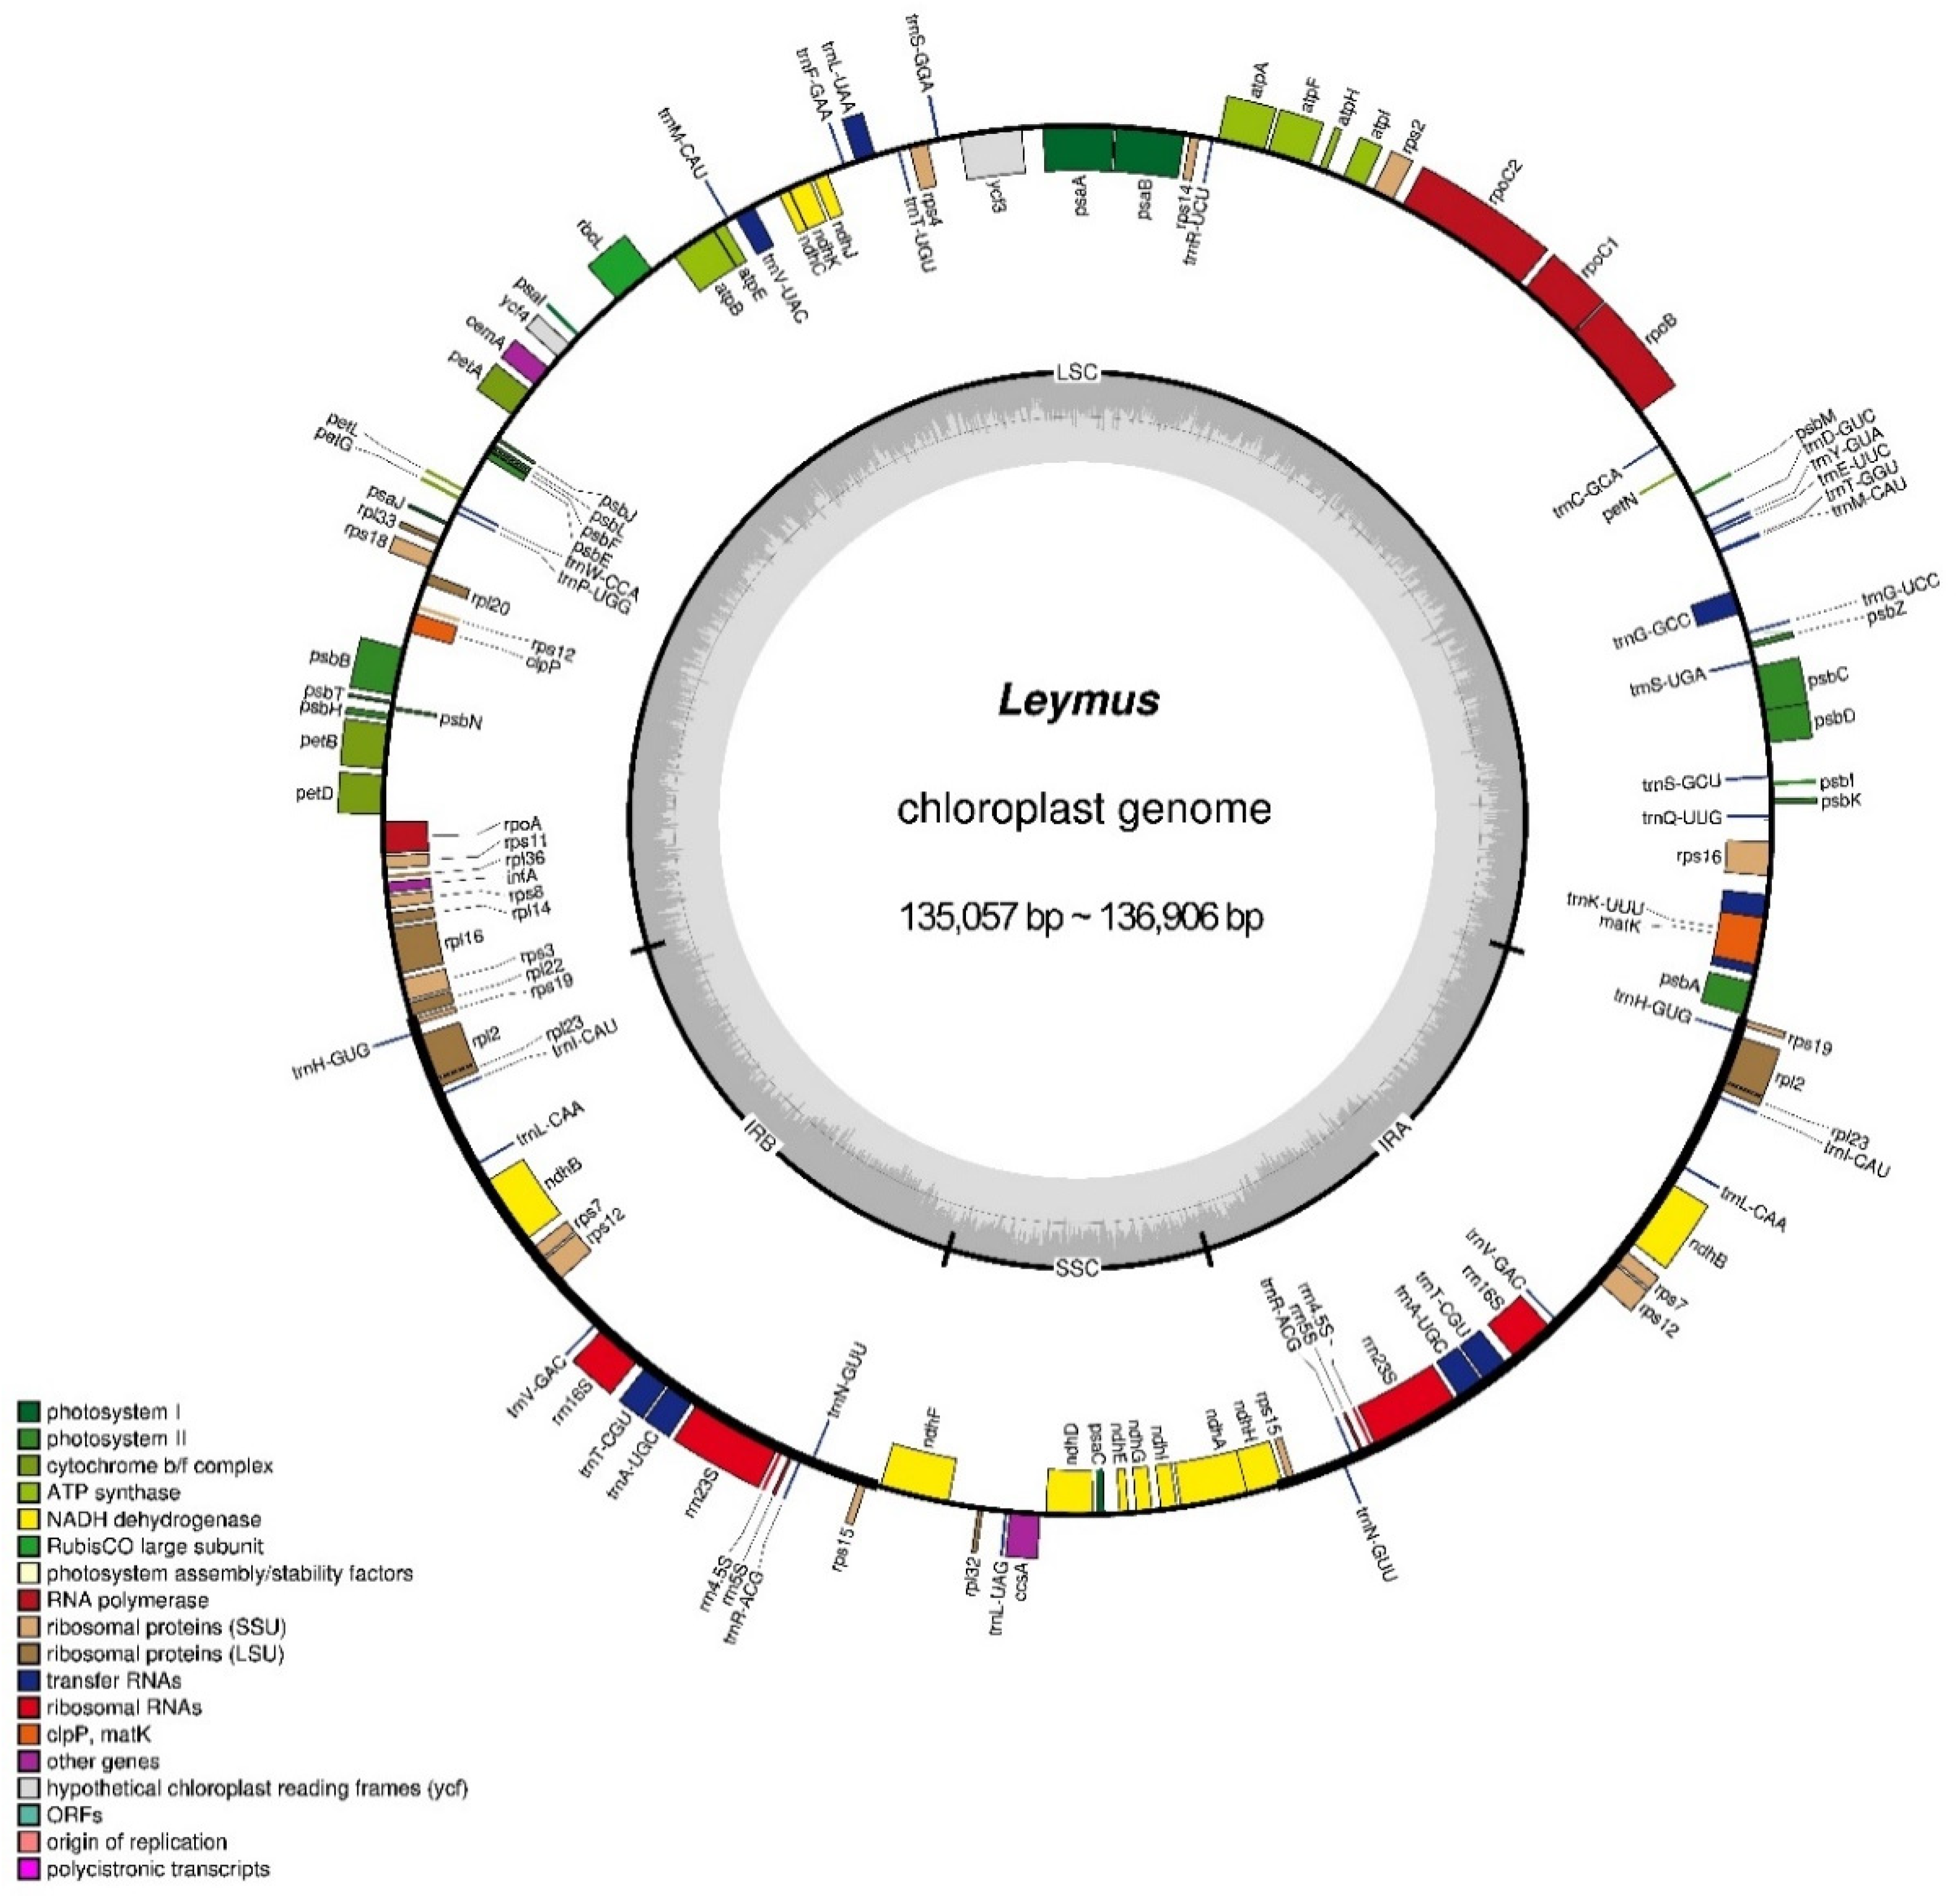
The cp genomes of the Leymus species had the typical quadripartite structure, with the length of the LSC, SSC, and IR regions ranging between 80,149 bp in L. triticoides and 81,053 bp in L. paboanus, 12,708 bp in L. karelinii and 12,797 bp in L. duthiei, and 20,813 bp in L. angustus and 21,578 bp in L. komarovii, respectively (Table S1). The size of the 16 Leymus cp genomes ranged from 135,057 bp of L. condensatus and 136,906 bp of L. coreanus (Figure 1, Table S1) and comprised 129 genes, including 83 protein-coding genes, 38 transfer RNA (tRNA) genes, and 8 ribosomal RNA (rRNA) genes (Table 1 and Table S2). Among these genes, six protein-coding genes, four rRNAs, and nine tRNA were the same in the two identified IR regions; in other words, these 19 genes were duplicated in the two IR regions. The LSC region contained 62 protein-coding genes and 20 tRNA genes, whereas 11 protein-coding genes and one tRNA gene were located in the SSC regions. Among all genes, seven protein-coding genes and six tRNAs were within one intron; additionally, two protein-coding genes (rps12 and ycf3) were within two introns (Tables S2 and S3). In particular, rps12 was trans-spliced, with the 5′-end–exon being located in the LSC region, and two 3′-end–exons being both in the IRs. The GC content of the cp genomes ranged from 38.33–38.42%, which was almost identical to that of all other Leymus species (Table S2), with the IR regions having the highest GC content (43.89–44.01%), followed by the LSC (36.35–36.41%) and SSC regions (32.23–32.63%). Noteworthily, the two IR regions had the same GC content (Table S2).
3.2. Analysis of Repeat Sequences and SSRs
All 16 Leymus cp genomes comprised 800 repeats, which consisted of 518 forward (F), 269 palindromic (P), seven reverse (R), and six complementary (C) repeats (Figure 2). The total number of repeats was consistent for each Leymus species, whereas the repeat type and distribution were different. L. condensatus and L. coreanus contained three repeat types, and L. karelinii and L. racemosus contained four repeat types, whereas all other species contained two repeat types. Among them, F repeats accounted for the biggest proportion (58–70%), followed by P repeats (30–38%), R repeats (L. condensatus, L. coreanus, L. karelinii, and L. racemosus had 4%, 2%, 4%, and 4%, respectively), and C repeats (6% in L. karelinii and L. racemosus) (Figure 2). The length of the repeats in all 16 Leymus cp genomes analyzed ranged from 30 to 286 bp, with most repeats being between 34 and 39 bp. The longest repeats were found in L. duthiei and L. komarovii.
In total, 707 SSRs were identified in the 16 Leymus cp genomes (Figure 3, Table 1). Mononucleotide repeats were the most abundant SSR among all Leymus species, accounting for 48.72–79.49% of all loci, followed by dinucleotide repeats (7.69–16.67%), trinucleotide repeats (4.88–7.69%), and tetranucleotide repeats (14.63–25.00%) (Table S4). Three pentanucleotide repeats were identified in L. cinereus and L. triticoides, two in L. coreanus, and one in L. angustus, L. condensatus, L. komarovii, and L. mollis. No hexanucleotide repeats were detected in the cp genomes. Most SSRs were composed of an A/T motif instead of a G/C motif. The pentanucleotide AAAAT/ATTTT and AAGAT/ATCTT repeats were identified in L. cinereus and L. triticoides, and the AATAT/ATATT repeat was found only in L. coreanus (Table S4).
The number of SSRs was not significantly different among the 16 Leymus cp genomes analyzed, ranging from 36 in L. duthiei to 50 in L. coreanus (Table 1). LSC was the region with more SSRs (mean 2.39 SSRs per kb), followed by the IR (mean 8.44 SSRs per kb) and SSC (mean 4.21 SSRs per kb) regions. Only two SSRs were located in the IRs (rrna4.5) of L. angustus, L. condensatus, and L. mollis, and the remaining species had 6–10 SSRs in the IR region (Figure 3, Table 1). Within the cp genomes of the 16 Leymus species, 56.76% and 67.35% SSR loci were found in the intergenic areas of L. mollis and L. karelinii, respectively. Moreover, the gene-coding regions of L. karelinii and L. racemosus had 20.41% and 27.03% SSR loci, and 11.11% and 16.67% SSR loci were found in the intron areas of L. duthiei and L. chinensis. (Table S5). What is needed to pay attention to is that SSR located in IGS (trnR-UCU, rps14), IGS (atpB, rbcL), IGS (psbE, petL), and IGS (ccsA, ndhD) only remain in Leymus cinereus, Leymus arenarius, Leymus coreanus, and Leymus paboanus (Supplementary Table S5)
3.3. Comparative Analysis of Genome Structure
All aligned cp genome sequences were found to be highly similar, especially in the protein-coding and IR regions (Figure 4 and Figure 5). In this study, the average Pi values for the genome, coding DNA sequence (CDS), and intergenic spacers (IGS) among the 16 Leymus species were 0.0049, 0.0034, and 0.0081, respectively (Tables S6 and S7). Similar to other plants, coding regions were the most conserved among all Leymus species, and conservation of the IGS regions was secondary. In particular, the IR was the most conserved region, with merely a few hotspot regions, with the majority of the hotspot sections located in the LSC and SSC regions. In the 76 CDS regions, Pi% values ranged from 0 (ndhE, petG, petN, psbF, psbI, psbN, psbT, psbZ, rpl36, and rps8) to 0.0159 (rpl32), and the regions with large variations were rps16, ndhH, matK, rpl22, psbM, and rpl32 (Pi% > 0.009) (Figure 6, Table S6). In the 121 IGS regions, Pi% values ranged from 0 (13 regions, Figure 6, Table S7) to 0.0431 (trnT-trnL), and the regions with large variations were petG-trnW, rpl32-trnL, rpl22-rps19, and trnT-trnL (Pi% > 0.03). These results indicate that these variable regions can be used as new genetic markers in DNA barcoding and phylogenetic studies of Leymus species.
3.4. Expansion and Contraction of the IR Region
The expansion or contraction of the IR region differs among plant species; therefore, LSC, SSC, and IR boundary structures were analyzed among the 16 Leymus species. Only minor differences in the junction positions were detected. In all species, the junction of LSC/IRb (JLB) was located between rp122 in LSC and rps19 in Irb (Figure 7): rp122 extended from 27 to 40 bp in length from LSC to Irb, and rps19 extended from 37 to 57 bp in length from Irb to LSC. Similarly, the JLAs (junction of Ira/LSC) were located between rps19 in Ira and psbA in LSC: rps19 extended from 37 to 57 bp in length from Ira to LSC, and psbA extended from 81 to 91 bp in length from LSC to Ira. The ndhF gene deviated from the junction of the Irb/SSC (JSB) region, ranging from 68 to 108 bp in length. The rps15 gene was located in the Irb, which ranged from 337 to 362 bp in length from the JSB border. Additionally, the ndhH gene of all Leymus species straddled the junction of the SSC/Ira (JSA) boundary regions, with 975 to 900 bp of the SSC region and 192 to 207 bp of the Ira region. Overall, the contraction and expansion events in Irs were reflected in the different locations of rpl22, rps19, ndhH, and psbA (Figure 7).
3.5. Phylogenetic Relationships between Leymus Species
Using Oryza sativa and Brachypodium distachyon as outgroups, cp complete genome and 74 shared protein-coding genes were used to perform phylogenetic analysis, respectively. The topological structure of the phylogenetic tree showed that 16 Leymus species were clustered in different clades with other 27 species across 11 genera of Triticum. In addition to L. condensatus, L. angustus, and L. mollis, the 13 Leymus species herein analyzed clustered along with two Psathyrostachys species in two clades. Two North American Leymus species (L. triticoides and L. cinereus) along with two Central Asia Leymus species (L. coreanus and L. komarovii) clustered into one clade and showed a close phylogenetic relationship. The other clade consisted of five Central Asia Leymus species (L. racemosus, L. karelinii, L. multicaulis, L. ramosus, and L. paboanus), one Eurasia species (L. arenarius), one East Asia species (L. chinensis), two Qinghai-Tibet Plateau Leymus species (L. secalinus and L. duthiei), and the two Psathyrostachys species (P. juncea and P. huashanica) (Figure 8).
4. Discussion
4.1. Genome Organization and Genome Features
Leymus is a genus of the botanical tribe Triticeae (Poaceae) comprising approximately 30 species and 19 subspecies, almost all of which are polyploid and cross-pollinating [1,2]. Leymus can be used for agriculture and conservation, and as an important genetic resource for Triticeae cereal crop improvement. In this study, 13 Leymus species were sequenced and comprehensively analyzed in comparison with three previously reported Leymus sequences. The cp genomes of all 16 Leymus species exhibited the typical quadripartite structure, which consisted of LSC, SSC, and two inverted repeats (IRa and IRb), and the cp genome size ranged from 135,057 bp (L. condensatus) to 136,906 bp (L. coreanus) (Figure 1, Table S2), which was in agreement with previously published data of Triticeae [23,40,41]. The cp genomes of Leymus species were highly conserved, with the same genomic structure and gene content. In particular, accD, ycf1, and ycf2 genes coded in the Leymus cp genomes gradually degraded as compared to those of other plants, such as cattail (Typha orientalis Presl) and tobacco (Nicotiana tabacum L.) [42], and were similar to that of Triticeae species [23,43]. This event may be explained by the insertion and deletion of the no-triple base in the pairing sequence which may have occurred many times, causing a frameshift mutation and gene loss [42]. Moreover, since 20 genes with introns were identified in Leymus species, contrasting with clpP and rpoC1 which had no introns, provides further evidence that the loss of clpP and rpoC1 introns occurs in most Poaceae species [23,43,44].
SSRs, which are highly diverse in copy number, are important molecular markers that play a significant role in plant population genetics and evolution investigations [45,46]. A total of 707 SSR loci were identified in the 16 Leymus cp genomes (Figure 3, Table 1). Due to the rich A/T stretches of the repeats, the cp genome contained a high A/T content (Table S4). It is observed that the number of SSRs in the non-coding region was higher than that in the coding region (Table S5). These results are similar to those of other Triticeae species [23,47,48] and may be the reason why the mutation rate in IGS regions is higher than in the coding regions [49].
4.2. Comparative Analysis of Leymus
Compared with the coding region, the nucleotide diversity was higher in a non-coding region of the Leymus species. These results are consistent with other species [22,40,48,50]. Our study revealed 10 hypervariable regions in Leymus species: five coding regions (rps16, ndhH, matK, rpl22, psbM, and rpl32) and five non-coding regions (petG-trnW, rpl32-trnL, rpl22-rps19, and trnT-trnL) (Figure 6, Tables S6 and S7). Interestingly, the highly variable regions of Leymus species were different from those previously reported for designing phylogenetic trees and species identification of Leymus, such as trnL-trnF, trnH-psbA, trnK-rps16, ndhF, rps16-trnQ, trnF-ndhJ, and ndhF-rpl32 [8,11,13,14,24,51,52,53]. Thus, by analyzing the variable regions of the 16 Leymus cp genomes, we were able to identify some molecular markers, such as SSRs [45,54] which can be more effectively used in DNA barcoding and to determine phylogenetic relationships in future studies.
4.3. Evolution and Origin of IRs
The IR regions of the cp genome are considered to be the most conserved regions [55]. Similar to previous studies on Triticeae, all 16 Leymus species had the same gene arrangement, in which six protein-coding genes (rpl2, rpl23, rps12, ndhB, rps15, and rps19) were duplicated [23,43,47]. Moreover, we identified the smallest reverse IR region in L. angustus (20,813 bp) and the largest in L. komarovii (21,578 bp) (Table S3). It was possibly the expansion and contraction of the IR regions, along with the spacer of a single copy, that caused variations in the length of the complete cp genomes [56]. Some reports have shown that slight expansion of the IR region may be caused by gene transfer, with double-strand break repair leading to wider expansion [57]. The different locations of rpl22, rps19, ndhH, and psbA may have been induced by IR contraction and expansion events in Leymus species, leading to changes in the IR boundaries among them. All Leymus species showed minor variations in junction positions of JLB (~13 bp), JSB (~34 bp), and JLA (~8 bp) (Figure 7). In addition, ndhH was found to straddle the JSA, which is consistent with previous data on other Triticeae species, such as Agropyron, Hordeum, and Festuca [23,47,58,59]. The different position of ndhH in the JSA border suggests that these variations may be caused by intramolecular recombination during early evolution [60,61,62].
4.4. Phylogenetic Relationships
Leymus has been widely recognized based on morphological, cytogenetic, and molecular data after Hochstetter separated it from the traditional Elymus L. in 1848; however, there is currently a lack of understanding of the evolutionary relationships among Leymus species. In this study, the whole cp genome sequences were used to perform phylogenetic analysis. Overall, the 16 Leymus species analyzed were clustered in different clades along with other 27 species across 11 genera of Triticum. The evolutionary relationships herein identified were consistent with those of previous studies based on nuclear DNA markers and, to some extent, cp genome data [11,13,14,24,51,52,53,63,64]. According to Sha’s research, Psathyrostachys is the donor of the Ns genome in Leymus species [14]. What needs more attention is that the phylogenetic tree based on cp genome sequences existed with minor differences from the phylogenetic tree based on shared protein-coding genes. We inferred that the reason for this is barcode genes laid in the cp genome, and the result is consistent with Liu’s and Guo’s research [11,16]. What is more, the close relationship between Elymus and Leymus may also be related to their origin of genome [11]. Here, we provide further evidence based on plastome data and protein-coding genes. The results of our phylogenetic analysis indicate that the cp genome can be used as a useful tool to explore species relationships.
5. Conclusions
Based on 13 newly sequenced and three previously reported Leymus cp genomes, we have found that the plastome is highly conserved and similar concerning its overall structure within this genus. Our findings demonstrate that most SSRs are A/T rich and are more commonly located in non-coding regions. The cp genome sequence identity is highly similar among Leymus species, especially in the protein-coding and IR regions. The differences identified in the CDS and IGS regions of Leymus species revealed 10 highly variable regions that may be used as new genetic markers for DNA barcoding and phylogeny research. In addition, comparisons of the IR boundaries further showed that the IR contraction and expansion events in Leymus species lead to different genomic locations of the rpl22, rps19, ndhH, and psbA genes. The close relationship between Leymus and Psathyrostachys highlighted by a phylogenetic tree design based on plastome data further indicated that as early as in the 1980s, Psathyrostachys may be the donor of the Ns genome to Leymus species. Taken together, these findings provide useful information for the identification and phylogenetic analysis of Leymus species.
Supplementary Materials
The following are available online at https://www.mdpi.com/article/10.3390/genes13081425/s1, Table S1: The information of Leymus species in this study; Table S2: Gene composition in Leymus chloroplast genome; Table S3: Summary of chloroplast genome characteristics in Leymus species; Table S4: Numbers of identified SSRs motifs in the 16 Leymus chloroplast genomes; Table S5: SSRs location in the 16 Leymus chloroplast genomes; Table S6: Eta, Pi value, and PICs of Protein-coding regions(CDS) in Leymus species; Table S7: Eta, Pi value, and PICs of non-coding regions in Leymus species.
Author Contributions
Z.W. designed the experiment, carried out the bioinformatic analyses, and wrote the first manuscript. C.T. collected the plant materials and manuscript revision. Y.Y. participated in carrying out some experiments. Q.L. and Y.L. contributed to the result interpretation and manuscript revision. Z.L. and K.J. conceived the experiments and revised the manuscript. All authors have read and agreed to the published version of the manuscript.
Funding
The research was funded by the Inner Mongolia Natural Science Fund (2022MS03073), Special Project for Scientific and Technological Achievements Transformation of Inner Mongolia (2021CG0019), the Central Public-interest Scientific Institution Basal Research Fund (1610332022001), and the Key Projects in Science and Technology of Inner Mongolia (2021ZD0031).
Institutional Review Board Statement
Not applicable.
Informed Consent Statement
Not applicable.
Data Availability Statement
The complete chloroplast genome sequences of the 13 species we sequenced were deposited at NCBI, GenBank accession number: MZ595315, NC_044900.1, MZ595314, MZ595313, MZ595312, MZ595316, MZ595311, MZ595317, MZ595318, MZ595319, MZ595320, MZ595321 and MZ595310. Row data are available at SRA under the accession number: SRR19118231, SRR13308283, SRR19118230, SRR19118227, SRR19118226, SRR19118225, SRR19118224, SRR19118223, SRR19118222, SRR19118221, SRR19118220, SRR19118229 and SRR19118228.
Conflicts of Interest
The authors declare no conflict of interest.
References
- Love, A. Conspectus of the Triticeae. Feddes Repert. 1984, 95, 425–521. [Google Scholar] [CrossRef]
- Dewey, D.R. The Genomic System of Classification as a Guide to Intergeneric Hybridization with the Perennial Triticeae. In Gene Manipulation in Plant Improvement: 16th Stadler Genetics Symposium; Gustafson, J.P., Ed.; Springer: Boston, MA, USA, 1984; pp. 209–279. [Google Scholar]
- Anamthawat-Jónsson, K.; Bödvarsdóttir, S.; Bragason, B.T.; Gudmundsson, J.; Martin, P.K.; Koebner, R. Wide hybridization between wheat (Triticum L.) and lymegrass (Leymus Hochst.). Euphytica 1997, 93, 293–300. [Google Scholar] [CrossRef]
- Plourde, A.; Comeau, A.; St-Pierrf, C.A. Barley yellow dwarf virus resistance in Triticum aestivum × Leymus angustus hybrids. Plant Breed. 2006, 108, 97–103. [Google Scholar] [CrossRef]
- Chen, P.; Liu, W.; Yuan, J.; Wang, X.; Zhou, B.; Wang, S.; Zhang, S.; Feng, Y.; Yang, B.; Liu, G.; et al. Development and characterization of wheat-Leymus racemosus translocation lines with resistance to Fusarium Head Blight. Theor. Appl. Genet. 2005, 111, 941–948. [Google Scholar] [CrossRef] [PubMed]
- Nevski, C.A. Agrostologische studien: IV. Uber das system tribe Hordeae Benth. Trudy Bot Inst Akad Nauk SSSR, Ser 1. Fl Sist Vyss Rast 1934, 1, 9–32. [Google Scholar]
- Tzvelev, N.N. Zlaki SSSR (Poaceae URSS). Leningr. Nauka 1976, 55, 176–189. [Google Scholar]
- Redinbaugh, M.G.; Jones, T.A.; Zhang, Y. Ubiquity of the St chloroplast genome in St-containing Triticeae polyploids. Genome 2000, 43, 846–852. [Google Scholar] [CrossRef]
- Anamthawat-Jónsson, K.; Bödvarsdóttir, S.K. Genomic and genetic relationships among species of Leymus (Poaceae: Triticeae) inferred from 18S–26S ribosomal genes. Am. J. Bot. 2001, 88, 553–559. [Google Scholar] [CrossRef]
- Yang, R.W.; Zhou, Y.H.; Ding, C.B.; Zhang, Y. Relationships among Leymus species assessed by RAPD markers. Biol. Plant. 2008, 52, 237–241. [Google Scholar] [CrossRef]
- Liu, Z.; Chen, Z.; Pan, J.; Li, X.; Liu, G. Phylogenetic relationships in Leymus (Poaceae: Triticeae) revealed by the nuclear ribosomal internal transcribed spacer and chloroplast trnL-F sequences. Mol. Phylogenet. Evol. 2008, 46, 278–289. [Google Scholar] [CrossRef]
- Sha, L.N.; Yang, R.W.; Fan, X.; Wang, X.L.; Zhou, Y.H. Phylogenetic analysis of Leymus (Poaceae: Triticeae) inferred from nuclear rDNA ITS sequences. Biochem. Genet. 2008, 46, 605–619. [Google Scholar] [CrossRef] [PubMed]
- Sha, L.; Fan, X.; Yang, R.; Kang, H.; Ding, C.; Zhang, L.; Zheng, Y.L.; Zhou, Y. Phylogenetic relationships between Hystrix and its closely related genera (Triticeae; Poaceae) based on nuclear Acc1, DMC1 and chloroplast trnL-F sequences. Mol. Phylogenet. Evol. 2010, 54, 327–335. [Google Scholar] [CrossRef] [PubMed]
- Sha, L.N.; Fan, X.; Zhang, H.Q.; Kang, H.Y.; Wang, Y.; Wang, X.L.; Zhang, L. Phylogenetic relationships in Leymus (Triticeae; Poaceae): Evidence from chloroplast trnH-psbA and mitochondrial coxII intron sequences. J. Syst. Evol. 2014, 52, 722–734. [Google Scholar] [CrossRef]
- Fan, X.; Sha, L.N.; Yang, R.W.; Zhang, H.Q.; Kang, H.Y.; Ding, C.B.; Zhang, L.; Zheng, Y.L.; Zhou, Y.H. Phylogeny and evolutionary history of Leymus (Triticeae; Poaceae) based on a single-copy nuclear gene encoding plastid acetyl-CoA carboxylase. BMC Evol. Biol. 2009, 9, 247. [Google Scholar] [CrossRef] [Green Version]
- Guo, G.Y.; Yang, R.W.; Ding, C.B.; Zhang, L.; Zhou, Y.H.; Chen, F.; Wang, S.H. Phylogenetic relationships between Leymus and related diploid Triticeae species revealed by ISSR markers. Biologia 2014, 69, 986–993. [Google Scholar] [CrossRef] [Green Version]
- Li, Y.; Wang, T.-R.; Kozlowski, G.; Liu, M.-H.; Yi, L.-T.; Song, Y.-G. Complete Chloroplast Genome of an Endangered Species Quercus litseoides, and Its Comparative, Evolutionary, and Phylogenetic Study with Other Quercus Section Cyclobalanopsis Species. Genes 2022, 13, 1184. [Google Scholar] [CrossRef]
- Sugiura, M. The chloroplast genome. In 10 Years Plant Molecular Biology; Springer Dordrecht: Dordrecht, The Netherlands, 1992; Volume 19, pp. 149–168. [Google Scholar] [CrossRef]
- Raubeson, L.A.; Jansen, R.K. Chloroplast genomes of plants. In Plant Diversity and Evolution: Genotypic and Phenotypic Variation in Higher Plants; CABI Publishing: Wallingford, UK, 2005; Volume 3, pp. 45–68. [Google Scholar]
- Curci, P.L.; De Paola, D.; Danzi, D.; Vendramin, G.G.; Sonnante, G. Complete Chloroplast Genome of the Multifunctional Crop globe Artichoke and Comparison with Other Asteraceae. PLoS ONE 2015, 10, e0120589. [Google Scholar] [CrossRef]
- Martin, G.E.; Rousseau-Gueutin, M.; Cordonnier, S.; Lima, O.; Michon-Coudouel, S.; Naquin, D.; Carvalho, J.F.; Aïnouche, M.; Salmon, A.; Aïnouche, A. The first complete chloroplast genome of the Genistoid legume Lupinus luteus: Evidence for a novel major lineage-specific rearrangement and new insights regarding plastome evolution in the legume family. Ann. Bot. 2014, 113, 1197–1210. [Google Scholar] [CrossRef] [Green Version]
- Goremykin, V.V.; Nikiforova, S.V.; Cavalieri, D.; Pindo, M.; Peter, L. The Root of flowering plants and total evidence. Syst. Biol. 2015, 64, 879–891. [Google Scholar] [CrossRef] [Green Version]
- Chen, N.; Chen, W.J.; Yan, H.; Wang, Y.; Kang, H.Y.; Zhang, H.Q.; Zhou, Y.-H.; Sun, G.L.; Sha, L.N.; Fan, X. Evolutionary patterns of plastome uncover diploid-polyploid maternal relationships in Triticeae. Mol. Phylogenet. Evol. 2020, 149, 106838. [Google Scholar] [CrossRef] [PubMed]
- Culumber, C.M.; Larson, S.R.; Jensen, K.B.; Jones, T.A. Genetic structure of Eurasian and North American Leymus (Triticeae) wildryes assessed by chloroplast DNA sequences and AFLP profiles. Plant Syst. Evol. 2011, 294, 207–225. [Google Scholar] [CrossRef]
- Doyle, J. A rapid DNA isolation procedure for small quantities of fresh leaf tissue. Phytochem. Bull. 1987, 19, 11–15. [Google Scholar]
- Qu, X.J.; Moore, M.J.; Li, D.Z.; Yi, T.S. PGA: A software package for rapid, accurate, and flexible batch annotation of plastomes. Plant Methods 2019, 15, 50. [Google Scholar] [CrossRef] [PubMed] [Green Version]
- Jin, J.J.; Yu, W.B.; Yang, J.B.; Song, Y.; DePamphilis, C.W.; Yi, T.S.; Li, D.Z. GetOrganelle: A fast and versatile toolkit for accurate de novo assembly of organelle genomes. Genome Biol. 2020, 21, 241. [Google Scholar] [CrossRef]
- Kearse, M.; Moir, R.; Wilson, A.; Stones-Havas, S.; Cheung, M.; Sturrock, S.; Buxton, S.; Cooper, A.; Markowitz, S.; Duran, C.; et al. Geneious Basic: An integrated and extendable desktop software platform for the organization and analysis of sequence data. Bioinformatics 2012, 28, 1647–1649. [Google Scholar] [CrossRef] [PubMed]
- Lohse, M.; Drechsel, O.; Bock, R. OrganellarGenomeDRAW (OGDRAW): A tool for the easy generation of high-quality custom graphical maps of plastid and mitochondrial genomes. Curr. Genet. 2007, 52, 267–274. [Google Scholar] [CrossRef]
- Kurtz, S.; Choudhuri, J.V.; Ohlebusch, E.; Schleiermacher, C.; Stoye, J.; Giegerich, R. REPuter: The manifold applications of repeat analysis on a genomic scale. Nucleic Acids Res. 2001, 29, 4633–4642. [Google Scholar] [CrossRef] [Green Version]
- Beier, S.; Thiel, T.; Münch, T.; Scholz, U.; Mascher, M. MISA-web: A web server for microsatellite prediction. Bioinformatics 2017, 33, 2583–2585. [Google Scholar] [CrossRef] [Green Version]
- Standley, D.M. MAFFT multiple sequence alignment software version 7: Improvements in performance and usability. Mol. Biol. Evol. 2013, 30, 772–780. [Google Scholar]
- Alikhan, N.F.; Petty, N.K.; Ben Zakour, N.; Beatson, S. BLAST Ring Image Generator (BRIG): Simple prokaryote genome comparisons. BMC Genom. 2011, 12, 402. [Google Scholar] [CrossRef] [PubMed] [Green Version]
- Frazer, K.A.; Lior, P.; Alexander, P.; Rubin, E.M.; Inna, D. VISTA: Computational tools for comparative genomics. Nucleic Acids Res. 2004, 32, W273–W279. [Google Scholar] [CrossRef] [PubMed]
- Amiryousefi, A.; Hyvönen, J.; Poczai, P. IRscope: An online program to visualize the junction sites of chloroplast genomes. Bioinformatics 2018, 34, 3030–3031. [Google Scholar] [CrossRef] [PubMed]
- Rozas, J.; Ferrer-Mata, A.; Sánchez-DelBarrio, J.C.; Guirao-Rico, S.; Librado, P.; Ramos-Onsins, S.E.; Sánchez-Gracia, A. DnaSP 6: DNA sequence polymorphism analysis of large data sets. Mol. Biol. Evol. 2017, 34, 3299–3302. [Google Scholar] [CrossRef]
- Zhang, D.; Gao, F.; Jakovlić, I.; Zou, H.; Zhang, J.; Li, W.X.; Wang, G.T. PhyloSuite: An I ntegrated and scalable desktop platform for streamlined molecular sequence data management and evolutionary phylogenetics studies. Mol. Ecol. Resour. 2020, 20, 348–355. [Google Scholar] [CrossRef]
- Stamatakis, A. RAxML version 8: A tool for phylogenetic analysis and post-analysis of large phylogenies. Bioinformatics 2014, 30, 1312–1313. [Google Scholar] [CrossRef]
- Huelsenbeck, J.P. MrBayes 3.2: Efficient Bayesian phylogenetic inference and model choice across a large model space. Syst. Biol. 2012, 61, 539–542. [Google Scholar]
- Bernhardt, N.; Brassac, J.; Kilia, B. Dated tribe-wide whole chloroplast genome phylogeny indicates recurrent hybridizations within Triticeae. BMC Evol. Biol. 2017, 17, 141. [Google Scholar] [CrossRef] [Green Version]
- Gornicki, P.; Zhu, H.; Wang, J.; Challa, G.S.; Zhang, Z.; Gill, B.S.; Li, W. The chloroplast view of the evolution of polyploid wheat. New Phytol. 2015, 204, 704–714. [Google Scholar] [CrossRef]
- Ping, T.; Qiuyan, R.; Cheng, P. Phylogeny in Structure Alterations of Poaceae cpDNA. Chin. Agric. Sci. Bull. 2011, 27, 171–176. [Google Scholar]
- Huang, Y.Y.; Cho, S.T.; Haryono, M.; Kuo, C.H. Complete chloroplast genome sequence of common bermudagrass (Cynodon dactylon (L.) Pers.) and comparative analysis within the family Poaceae. PLoS ONE 2017, 12, e0179055. [Google Scholar]
- Guisinger, M.M.; Chumley, T.W.; Kuehl, J.V.; Boore, J.L.; Jansen, R.K. Implications of the plastid genome sequence of typha (typhaceae, poales) for understanding genome evolution in poaceae. J. Mol. Evol. 2010, 70, 149–166. [Google Scholar] [CrossRef] [PubMed] [Green Version]
- Grassi, F.; Labra, M.; Scienza, A.; Imazio, S. Chloroplast SSR markers to assess DNA diversity in wild and cultivated grapevines. Vitis-Geilweilerhof 2002, 41, 157–158. [Google Scholar]
- Mariette, S.; Le Corre, V.; Austerlitz, F.; Kremer, A. Sampling within the genome for measuring within-population diversity: Trade-offs between markers. Mol. Ecol. 2002, 11, 1145–1156. [Google Scholar] [CrossRef] [PubMed] [Green Version]
- Han, H.; Qiu, R.; Liu, Y.; Zhou, X.; Gao, C.; Pang, Y.; Zhao, Y. Analysis of Chloroplast Genomes Provides Insights into the Evolution of Agropyron. Front. Genet. 2022, 13, 832809. [Google Scholar] [CrossRef] [PubMed]
- Asaf, S.; Jan, R.; Khan, A.L.; Ahmad, W.; Asif, S.; Al-Harrasi, A.; Ahmed, A.H.; Kim, K.M.; Lee, I.J. The Plastome Sequences of Triticum sphaerococcum (ABD) and Triticum turgidum subsp. durum (AB) Exhibit Evolutionary Changes, Structural Characterization, Comparative Analysis, Phylogenomics and Time Divergence. Int. J. Mol. Sci. 2022, 23, 2783. [Google Scholar]
- Lu, R.S.; Li, P.; Qiu, Y.X. The complete chloroplast genomes of three Cardiocrinum (Liliaceae) species: Comparative genomic and phylogenetic analyses. Front. Plant Sci. 2017, 7, 2054. [Google Scholar] [CrossRef]
- Gu, C.; Ma, L.; Wu, Z.; Chen, K.; Wang, Y. Comparative Analyses of Chloroplast Genomes from Lythraceae Species: Inferences for Phylogenetic Relationships and Genome Evolution within Myrtales. BMC Plant Biol. 2019, 19, 281. [Google Scholar] [CrossRef]
- Shaw, J.; Lickey, E.B.; Beck, J.T.; Farmer, S.B.; Liu, W.; Miller, J.; Siripun, K.C.; Winder, C.T.; Schilling, E.E.; Small, R.L. The tortoise and the hare II: Relative utility of 21 noncoding chloroplast DNA sequences for phylogenetic analysis. Am. J. Bot. 2005, 92, 142–166. [Google Scholar] [CrossRef] [Green Version]
- Shaw, J.; Lickey, E.B.; Schilling, E.E.; Small, R.L. Comparison of whole chloroplast genome sequences to choose noncoding regions for phylogenetic studies in angiosperms: The tortoise and the hare III. Am. J. Bot. 2007, 94, 275–288. [Google Scholar] [CrossRef] [Green Version]
- Guo, G.Y.; Yang, R.W.; Ding, C.B.; Fan, X.; Zhang, L.; Zhou, Y.H. Phylogenetic relationships among Leymus and related diploid genera (Triticeae: Poaceae) based on chloroplast trnQ–rps16 sequences. Nord. J. Bot. 2014, 32, 658–666. [Google Scholar] [CrossRef]
- Yang, H.; Wang, L.; Chen, H.; Jiang, M.; Wu, W.; Liu, S.; Wang, J.; Liu, C. Phylogenetic analysis and development of molecular markers for five medicinal Alpinia species based on complete plastome sequences. BMC Plant Biol. 2021, 21, 431. [Google Scholar] [CrossRef] [PubMed]
- Zhu, A.; Guo, W.; Gupta, S.; Fan, W.; Mower, J.P. Evolutionary dynamics of the plastid inverted repeat: The effects of expansion, contraction, and loss on substitution rates. New Phytol. 2016, 209, 1747–1756. [Google Scholar] [CrossRef] [PubMed] [Green Version]
- Guo, S.; Guo, L.; Zhao, W.; Xu, J.; Li, Y.; Zhang, X.; Shen, X.; Wu, M.L.; Hou, X. Complete chloroplast genome sequence and phylogenetic analysis of Paeonia ostii. Molecules 2018, 23, 246. [Google Scholar] [CrossRef] [PubMed] [Green Version]
- Wang, R.J.; Cheng, C.L.; Chang, C.C.; Wu, C.L.; Su, T.M.; Chaw, S.M. Dynamics and evolution of the inverted repeat-large single copy junctions in the chloroplast genomes of monocots. BMC Evol. Biol. 2008, 8, 36. [Google Scholar] [CrossRef] [PubMed] [Green Version]
- Chen, N.; Sha, L.N.; Dong, Z.Z.; Tang, C.; Wang, Y.; Kang, H.Y. Complete Structure and Variation of the Chloroplast Genome of Agropyron Cristatum (L.). Gaertn. Gene 2018, 640, 86–96. [Google Scholar] [CrossRef]
- Qiu, Y.J.; Hirsch, C.D.; Yang, Y.; Watkins, E. Towards Improved Molecular Identification Tools in fine Fescue (Festuca L., Poaceae) Turfgrasses Nuclear Genome Size, Ploidy, and Chloroplast Genome Sequencing. Front. Genet. 2019, 1012, 1223. [Google Scholar] [CrossRef] [Green Version]
- Maier, R.M.; Neckermann, K.; Igloi, G.L.; Kössel, H. Complete sequence of the maize chloroplast genome: Gene content, hotspots of divergence and fine tuning of genetic information by transcript editing. J. Mol. Biol. 1995, 251, 614–628. [Google Scholar] [CrossRef]
- Ogihara, Y.; Isono, K.; Kojima, T.; Endo, A.; Hanaoka, M.; Shiina, T.; Terachi, T.; Utsugi, S.; Murata, M.; Mori, N.; et al. Structural features of a wheat plastome as revealed by complete sequencing of chloroplast DNA. Mol. Genet. Genom. 2002, 266, 740–746. [Google Scholar] [CrossRef]
- Cahoon, A.B.; Sharpe, R.M.; Mysayphonh, C.; Thompson, E.J.; Ward, A.D.; Lin, A. The complete chloroplast genome of tall fescue (Lolium arundinaceum; Poaceae) and comparison of whole plastomes from the family Poaceae. Am. J. Bot. 2010, 97, 49–58. [Google Scholar] [CrossRef]
- Barkworth, M.E.; Atkins, R.J. Leymus hochst. (Gramineae: Triticeae) in North America: Taxonomy and distribution. Am. J. Bot. 1984, 71, 609–625. [Google Scholar] [CrossRef]
- Tzvelev, N.N. The system of grasses (Poaceae) and their evolution. Bot. Rev. 1989, 55, 14. [Google Scholar] [CrossRef]
Figure 1.
Chloroplast (cp) genome map of Leymus species with L. chinensis as reference. The inner circle shows the GC and AT content. LSC, SSC, and IR (IRa and IRb) represent the large single copy, small single copy, and inverted repeats, respectively. Genes inside of the large circle are transcribed clockwise and those outside are transcribed counterclockwise. Genes with different functions are shown in different color blocks.

Figure 2.
The number of the four types of repeats identified in the 16 Leymus cp genomes. F, P, R, and C represent forward, palindromic, reverse, and complementary repeats, respectively.
Figure 2.
The number of the four types of repeats identified in the 16 Leymus cp genomes. F, P, R, and C represent forward, palindromic, reverse, and complementary repeats, respectively.

Figure 3.
The number of repeats with different lengths in the 16 Leymus cp genomes.

Figure 4.
Sequence identity of the 16 Leymus species. The outermost circle represents the correspondence of protein-coding genes and intergenic spacer regions, and the innermost circle represents the L. chinensis genome as a reference. Other circles represent the output of the sequence identity analysis of the 15 Leymus species.

Figure 5.
Global alignment of the cp genome sequences of the Leymus species using L. chinensis as reference. The value of the vertical scale (from 50% to 100%) represents the percentage of identity. Arrows indicate the annotated genes and their transcriptional direction. Different colored boxes represent exons, transfer RNA, ribosomal RNA, and non-coding sequences (CNSs).

Figure 6.
Nucleotide diversity (Pi) was determined by sliding window analysis of the aligned whole cp genomes of the 16 Leymus species (window length: 600 bp; step size: 200 bp). The X-axis represents the position of the midpoint of the window and the Y-axis represents the Pi of each window.
Figure 6.
Nucleotide diversity (Pi) was determined by sliding window analysis of the aligned whole cp genomes of the 16 Leymus species (window length: 600 bp; step size: 200 bp). The X-axis represents the position of the midpoint of the window and the Y-axis represents the Pi of each window.

Figure 7.
Comparison of the borders of the large single-copy (LSC), inverted repeat (IR), and small single-copy (SSC) junction boundaries in the cp genomes of the 16 Leymus species. JLB, JSB, JSA, and JLA represent the LSC/Irb, SSC/Irb, SSC/Ira, and LSC/Ira junction regions, respectively.
Figure 7.
Comparison of the borders of the large single-copy (LSC), inverted repeat (IR), and small single-copy (SSC) junction boundaries in the cp genomes of the 16 Leymus species. JLB, JSB, JSA, and JLA represent the LSC/Irb, SSC/Irb, SSC/Ira, and LSC/Ira junction regions, respectively.

Figure 8.
Phylogenetic tree of the Leymus species. Brachypodium distachyon and Oryza sativa Indica were selected as the outgroups. The tree was constructed by maximum likelihood and Bayesian inference with bootstrap values or posterior probabilities being indicated above the branches. The bootstrap values or posterior probabilities no more than 50% or 0.5 were shown in “-”. (a) Based on complete cp genome data; (b) based on 74 shared protein-coding genes.


Table 1.
Number of SSRs in the chloroplast genomes of 16 Leymus species.
| Species | Total SSRs | Compound SSRs | Types | LSC | SSC | IRa | IRb | ||||
|---|---|---|---|---|---|---|---|---|---|---|---|
| Mono- | Di- | Tri- | Tetra- | Penta- | |||||||
| Leymus angustus | 39 | 2 | 26 | 3 | 3 | 6 | 1 | 33 | 4 | 1 | 1 |
| Leymus arenarius | 47 | 3 | 29 | 6 | 3 | 9 | 37 | 4 | 3 | 3 | |
| Leymus chinensis | 48 | 3 | 30 | 6 | 3 | 9 | 36 | 4 | 4 | 4 | |
| Leymus cinereus | 43 | 2 | 22 | 6 | 3 | 9 | 3 | 33 | 2 | 4 | 4 |
| Leymus condensatus | 41 | 2 | 28 | 4 | 2 | 6 | 1 | 36 | 3 | 1 | 1 |
| Leymus coreanus | 50 | 5 | 30 | 6 | 3 | 9 | 2 | 40 | 2 | 4 | 4 |
| Leymus duthiei | 36 | 2 | 19 | 6 | 2 | 9 | 27 | 3 | 3 | 3 | |
| Leymus karelinii | 49 | 3 | 31 | 6 | 3 | 9 | 36 | 3 | 5 | 5 | |
| Leymus komarovii | 43 | 6 | 23 | 6 | 3 | 10 | 1 | 33 | 2 | 4 | 4 |
| Leymus mollis | 37 | 1 | 24 | 4 | 2 | 6 | 1 | 31 | 4 | 1 | 1 |
| Leymus multicaulis | 47 | 3 | 29 | 6 | 3 | 9 | 36 | 3 | 4 | 4 | |
| Leymus paboanus | 44 | 1 | 26 | 6 | 3 | 9 | 31 | 5 | 4 | 4 | |
| Leymus racemosus | 49 | 3 | 31 | 6 | 3 | 9 | 37 | 4 | 4 | 4 | |
| Leymus ramosus | 47 | 2 | 29 | 6 | 3 | 9 | 35 | 4 | 4 | 4 | |
| Leymus secalinus | 46 | 2 | 28 | 6 | 3 | 9 | 34 | 4 | 4 | 4 | |
| Leymus triticoides | 41 | 2 | 20 | 6 | 3 | 9 | 3 | 31 | 2 | 4 | 4 |
| Total | 707 | 42 | 425 | 89 | 45 | 136 | 12 | 546 | 53 | 54 | 54 |
Publisher’s Note: MDPI stays neutral with regard to jurisdictional claims in published maps and institutional affiliations. |
© 2022 by the authors. Licensee MDPI, Basel, Switzerland. This article is an open access article distributed under the terms and conditions of the Creative Commons Attribution (CC BY) license (https://creativecommons.org/licenses/by/4.0/).
Share and Cite
MDPI and ACS Style
Wu, Z.; Tian, C.; Yang, Y.; Li, Y.; Liu, Q.; Li, Z.; Jin, K. Comparative and Phylogenetic Analysis of Complete Chloroplast Genomes in Leymus (Triticodae, Poaceae). Genes 2022, 13, 1425. https://doi.org/10.3390/genes13081425
AMA Style
Wu Z, Tian C, Yang Y, Li Y, Liu Q, Li Z, Jin K. Comparative and Phylogenetic Analysis of Complete Chloroplast Genomes in Leymus (Triticodae, Poaceae). Genes. 2022; 13(8):1425. https://doi.org/10.3390/genes13081425
Chicago/Turabian StyleWu, Zinian, Chunyu Tian, Yanting Yang, Yuanheng Li, Qian Liu, Zhiyong Li, and Ke Jin. 2022. "Comparative and Phylogenetic Analysis of Complete Chloroplast Genomes in Leymus (Triticodae, Poaceae)" Genes 13, no. 8: 1425. https://doi.org/10.3390/genes13081425
Note that from the first issue of 2016, this journal uses article numbers instead of page numbers. See further details here.