Article

Response of Temperate Leymus chinensis Meadow Steppe Plant Community Composition, Biomass Allocation, and Species Diversity to Nitrogen and Phosphorus Addition

1
Institute of Agricultural Resources and Regional Planning, Chinese Academy of Agricultural Sciences, Beijing 100081, China
2
Institute of Grassland Science, Northeast Normal University, Changchun 130024, China
3
Digital Agriculture Rural Promotion Center, Beijing Municipal Bureau of Agriculture and Rural Affairs, Beijing 100101, China
*
Author to whom correspondence should be addressed.
Agronomy 2023, 13(1), 208; https://doi.org/10.3390/agronomy13010208
Submission received: 13 December 2022 / Revised: 30 December 2022 / Accepted: 9 January 2023 / Published: 10 January 2023

Abstract

:
Studies on the impacts of fertilization on plant production and species diversity are crucial for better maintaining the stability of grassland ecosystems and restoring degraded grasslands. Using a controlled fertilization experimental platform in a temperate Leymus chinensis meadow steppe ecosystem, the effects of different levels of nitrogen (N) and phosphorus (P) addition on plant community structure, biomass allocation, diversity, and the correlation relationship were explored. The major results were as follows: (1) The structural composition of the plant community changed after different levels of N and P addition; the dominance ratio and biomass of Poaceae plants increased gradually with increasing N and P addition levels. (2) The addition of N and P increased the height, density and coverage of the plant community, the biomass of the dominant L. chinensis and plant community and the total productivity of grassland, and reduced the root–shoot ratio of grassland biomass. For example, plant community biomass, gramineous plant biomass and grassland total productivity increased by 84.46–204.08%, 162.64–424.20%, and 38.12–46.44%, respectively, after N and P addition. (3) The community richness, diversity, and evenness indices decreased overall and showed binomial regression after N and P addition; the functional group of Poaceae plants was highly significantly negatively correlated with species diversity indices and was highly significantly positively correlated with the aboveground biomass of L. chinensis and community; Leguminosae plants and Ranunculaceae plants were highly significantly positively correlated with Margalef and Patrick richness indices; Ranunculaceae plants were highly significantly and negatively correlated with L. chinensis biomass, community biomass, and Poaceae plants. Moderate fertilization not only improved the plant community structure and productivity but was also beneficial for maintaining the grassland species diversity and stability.

1. Introduction

Grasslands are the largest terrestrial ecosystem in China, with grassland ecosystems covering approximately 2.5 million km2 and accounting for a quarter of China’s total land area [1,2]. The steppe grasslands of the Inner Mongolia autonomous region are extensive [3], especially the Hulunbuir grassland in Northeast China, which is not only an important base for agricultural and livestock production and processing in China but also an important green ecological barrier in the north of the country. However, grassland ecological degradation has increased due to frequent natural disasters (i.e., snowstorms, droughts, and dust storms) and intense human activities (i.e., long-term mowing and overgrazing) in recent decades [4,5,6]. According to previous reports, approximately 90% of natural grasslands are degraded to varying degrees [7], and nearly 50% of China’s grasslands have experienced varying degrees of productivity decline [8], which is a serious challenge for maintaining grassland resources. The long-term mowing and grazing utilization of the Hulunbuir grassland is increasing each year, leading to a nutrient imbalance in the grassland ecosystem, lack of soil seed bank and obstruction of forage growth and renewal, and the growing conditions of good forage grasses have been severely damaged [9]. The decline in vegetation ground cover and biomass has progressively worsened as grassland degradation has increased, resulting in soil nutrient depletion and soil hardening [10,11,12,13]. Fertilization has become an important management measure for maintaining the nutrient balance of grassland ecosystems and restoring degraded grasslands.
Reasonably balanced fertilization measures could not only increase soil fertility, improve grassland plant community structure, promote the restoration of grassland productivity and protect plant community diversity, but they can also affect the biogeochemical cycle of nitrogen, phosphorus, and other elements in the soil; thus, changing the structure and function of grassland vegetation [14]. Typically, increases in different elements in the soil can alleviate N limitation in sandy or arid soils and increase plant productivity and density [15,16] at rates that vary with fertilizer application, and N and P also play an important role in root–shoot circulation [17], which is essential for improving plant productivity and agronomic application. However, some other studies in different grassland types have also shown [18,19,20] that community diversity declines and species loss rates increase with increasing levels of fertilizer application. In addition, the excessive application of chemical fertilizers causes soil compaction and acidification, nutrient imbalance, grassland degradation, and other serious threats to grassland ecosystem function. These studies investigated the structure and function of grasslands and their response to degradation from different perspectives and positively contributed to the understanding of the effect of different degradation processes on vegetation structure and function and their influencing factors. However, fertilizer application has an important role in agricultural production and has not been applied as frequently to the improvement of vegetation and soil in natural grassland ecosystems. Research on the effects of different levels of nitrogen and phosphorus addition on the community structure, biomass allocation, and diversity of L. chinensis meadows is even less common.
Therefore, based on the long-term improvement experiment of the L. chinensis meadow steppe in the Hulunbuir National Field Scientific Observation and Research Station of Inner Mongolia, China, this study examined the effects of fertilization on grassland improvement and restoration. The main purposes were (1) to analyse the response of the plant community structure and function of the L. chinensis meadow steppe to different fertilization treatments; (2) to explore the changes in grassland biomass and its distribution after N and P addition; and (3) to reveal the response of plant community species diversity and its interaction with functional groups to different levels of N and P addition, which is of great significance for elucidating the restoration mechanism of degraded grasslands and promoting the high-quality stability development of grassland agriculture and animal husbandry.

2. Materials and Methods

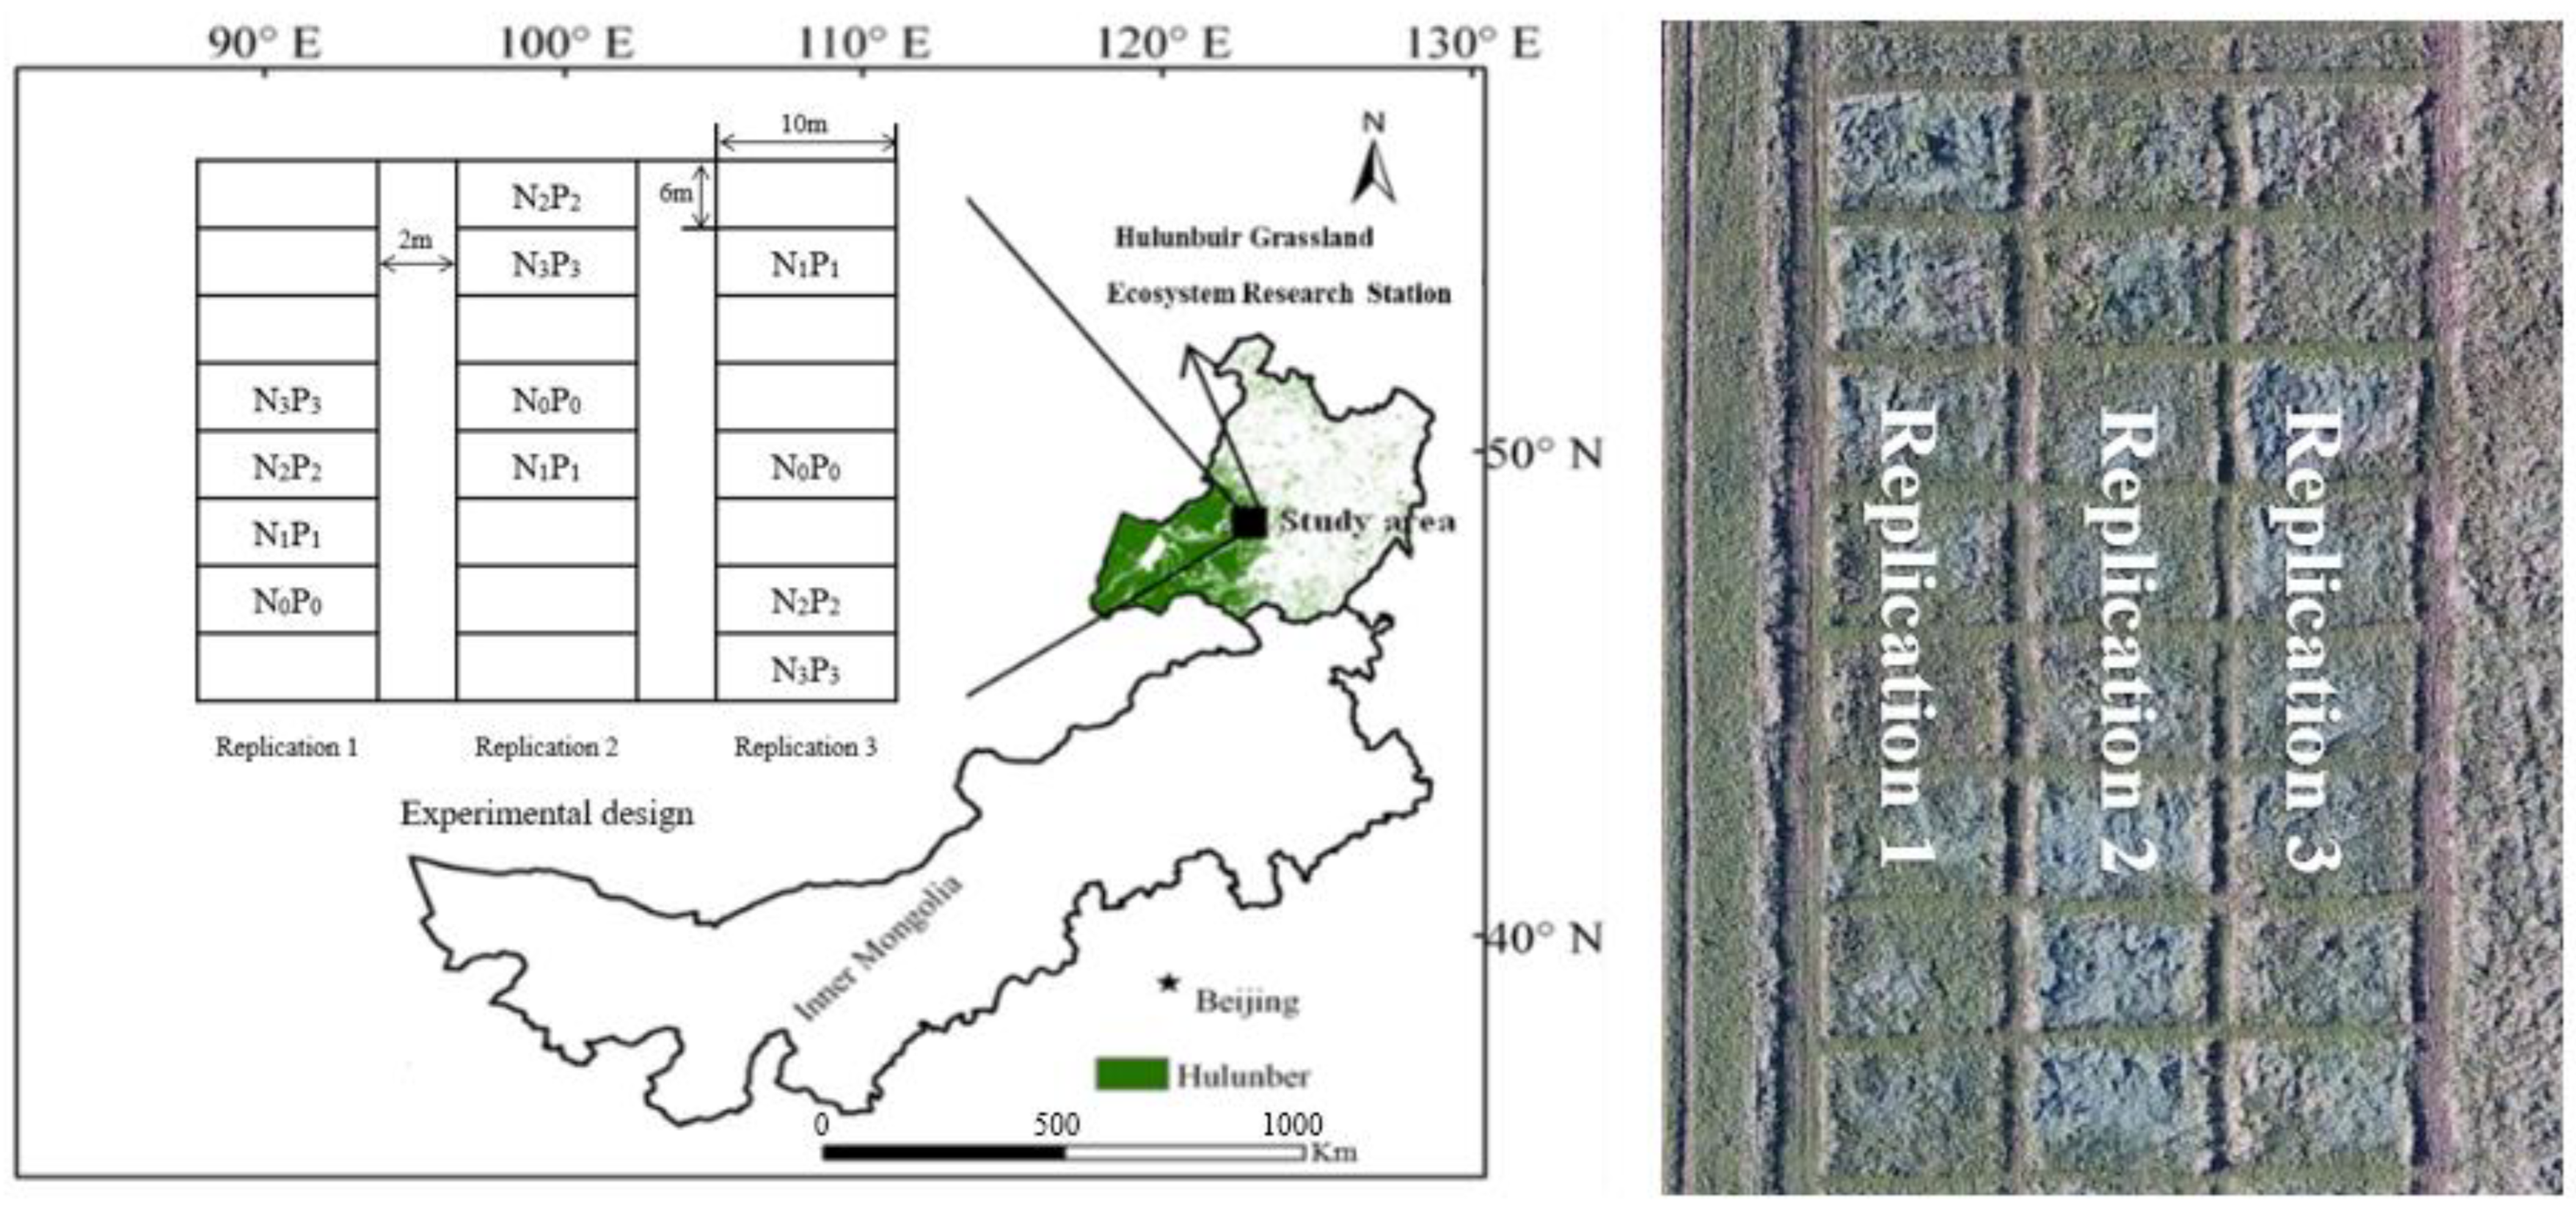
2.1. Overview of the Experimental Site

The study area is located in the Hulunbuir grassland in northeastern Inner Mongolia and is part of a long-term improvement experimental platform of the National Field Scientific Observatory of Grassland Ecosystems, Chinese Academy of Agricultural Sciences (49°23′ N, 120°02′ E), Inner Mongolia Autonomous Region, China; the site has an average altitude of 631 m above sea level and gentle terrain. The area has a medium-temperate semi-arid continental climate, with an annual average of 110 frost-free days. The annual mean precipitation ranges from 350 to 400 mm, approximately 80% of which falls between July and September. The annual mean air temperature is between −5 °C and −2 °C. The monthly average temperature and precipitation data at the study site for 2021 are shown in Figure 1, with a monthly average precipitation of 384.50 mm and a monthly average temperature of 0.64 °C. The test area is a zonal meadow grassland, with Leymus chinensis as the dominant species and Vicia amoena, Thalictrum squarrosum, and Pulsatilla turczaninovii as the auxiliary species. The soil type of the test site is chestnut caliche or dark chestnut caliche, and the soil texture is sandy loam. Sand, silt, and clay account for 71.3%, 24.9%, and 3.8%, respectively. The results of the soil background survey (0–10 m, 10–20 m, 20–30 m) in August 2013 are shown in Table 1. The C:N of soil is 10.1~11.6, and the nutrient content of the soil in this experiment is high, indicating high fertility.

2.2. Fertilizer Application Trial Design

The improvement experiment was established in 2013. The experiment was conducted in a randomized block design with eight treatments and three replicates per treatment for a total of 24 plots, as shown in Figure 2. Each plot was 60 m2 in size, with a 2 m buffer strip between plots, and fertilizer was applied in early June each year from 2014–2021. The results of the soil background survey (0–10 m, 10–20 m, 20–30 m) in August 2013 are shown in Table 1. The C:N of soil was 10.1~11.6, and the nutrient content of soil in this experiment was high, indicating high fertility. Based on the results of the soil base survey and previous studies, we selected four nitrogen and phosphorus fertilization treatments. Among them, the mixed ratio of N and P was 2:1, the nitrogen fertilizer was organic urea (CON2H4, total N content ≥46.4%), and the phosphorus fertilizer was organic calcium superphosphate (P2O5 content ≥16.0%). The four nitrogen and phosphorus fertilization levels were: (1) control (N0P0), fertilization amount was N 0 g·m−2 + P 0 g·m−2; (2) low level (N1P1), fertilization rate was N 3.5 g·m−2 + P 1.7 g·m−2; (3) medium level (N2P2), the amount of fertilizer was N 7.0 g·m−2 + P 3.4 g·m−2; and (4) high level (N3P3), N 10.5 g·m−2 + P 5.1 g·m−2. Other details are provided in previous research [21].

2.3. Research Methodology

2.3.1. Data Collection

Three 1 × 1 m2 quadrats were randomly located in each experimental plot during the peak biomass period in early August 2021. Within each quadrat, the species composition and canopy height and cover of each species were measured. A 50 cm × 50 cm point frame grid with 100 crosshairs was used to measure coverage; plant natural height was measured by the multipoint method with a ruler and averaged. The density of individuals or bunches was acquired by counting them in each quadrat [22]. The canopy was clipped to ground level, and the harvested plant biomass of each species was oven dried for 48 h at 65 °C to constant weight. Belowground biomass (BGB) was sampled by using a root auger (7 cm diameter) to soil depths of 0–10, 10–20, and 20–30 cm per sample, with three replicate profiles for each experimental unit being sampled at the same locations and at the same time as for the peak canopy biomass measurements.

2.3.2. Data Calculation and Processing

The importance value was calculated as follows: (relative height + relative density + relative cover)/3. Relative height was the percentage of the plant height to the total height of all plants; relative density was the percentage of the plant density to the total density of all plants; and relative cover was the percentage of the cover of one plant species to the total cover of all plants [23].
The community species diversity–ecosystem functioning relationship is a key concern for ecologists worldwide, and the sustainability and productivity of grassland ecosystems is heavily dependent on the biodiversity of plant communities [24,25]. The Margalef richness index (Ma), Patrick richness index (Pa), Shannon–Wiener diversity index (H’), Simpson diversity index (D), Pielou evenness index (JP), and Alatalo evenness index (Ea) were used to measure plant diversity. The formula was calculated as follows [26,27,28,29,30,31].
Margalef   richness   index = ( S 1 ) / l n N
Patrick   richness   index = S
Shannon Wiener   index = P i l n P i
Simpson   index = 1 P i 2
Pielou   evenness   index = H / l n S
Alatalo   evenness   index = ( 1 ( P i ) 2 1 ) / ( e P i l n P i 1 )
In the above equations, Pi is the relative importance of plant species i in the sample, Pi = N i / N ; Ni is the absolute importance of plant species i, N is the sum of the absolute importance of each plant species in the sample where plant species i is located, S is the number of species in the sample, and N is the total number of plants in the sample.
In this study, Microsoft Excel 2019 (Microsoft, Seattle, WA, USA) and IBM SPSS Statistics 22 (IBM Corporation, Armonk, NY, USA) were used for data collation and statistical analysis, and Origin 2022 (OriginLab Corporation, Northampton, MA, USA) was used for data plotting. One-way analysis of variance (ANOVA) was used for plant community characteristics and species diversity indices under different N and P addition treatments, with a least significant difference (LSD) test for multiple comparisons and a significance level set at p < 0.05. Pearson’s correlation analysis was used to determine the relation of species diversity indices, functional group importance values and plant community biomass. Phylogeographic clustering analysis based on plant community species importance values was performed using the mean distance method with Euclidean distance.

3. Results

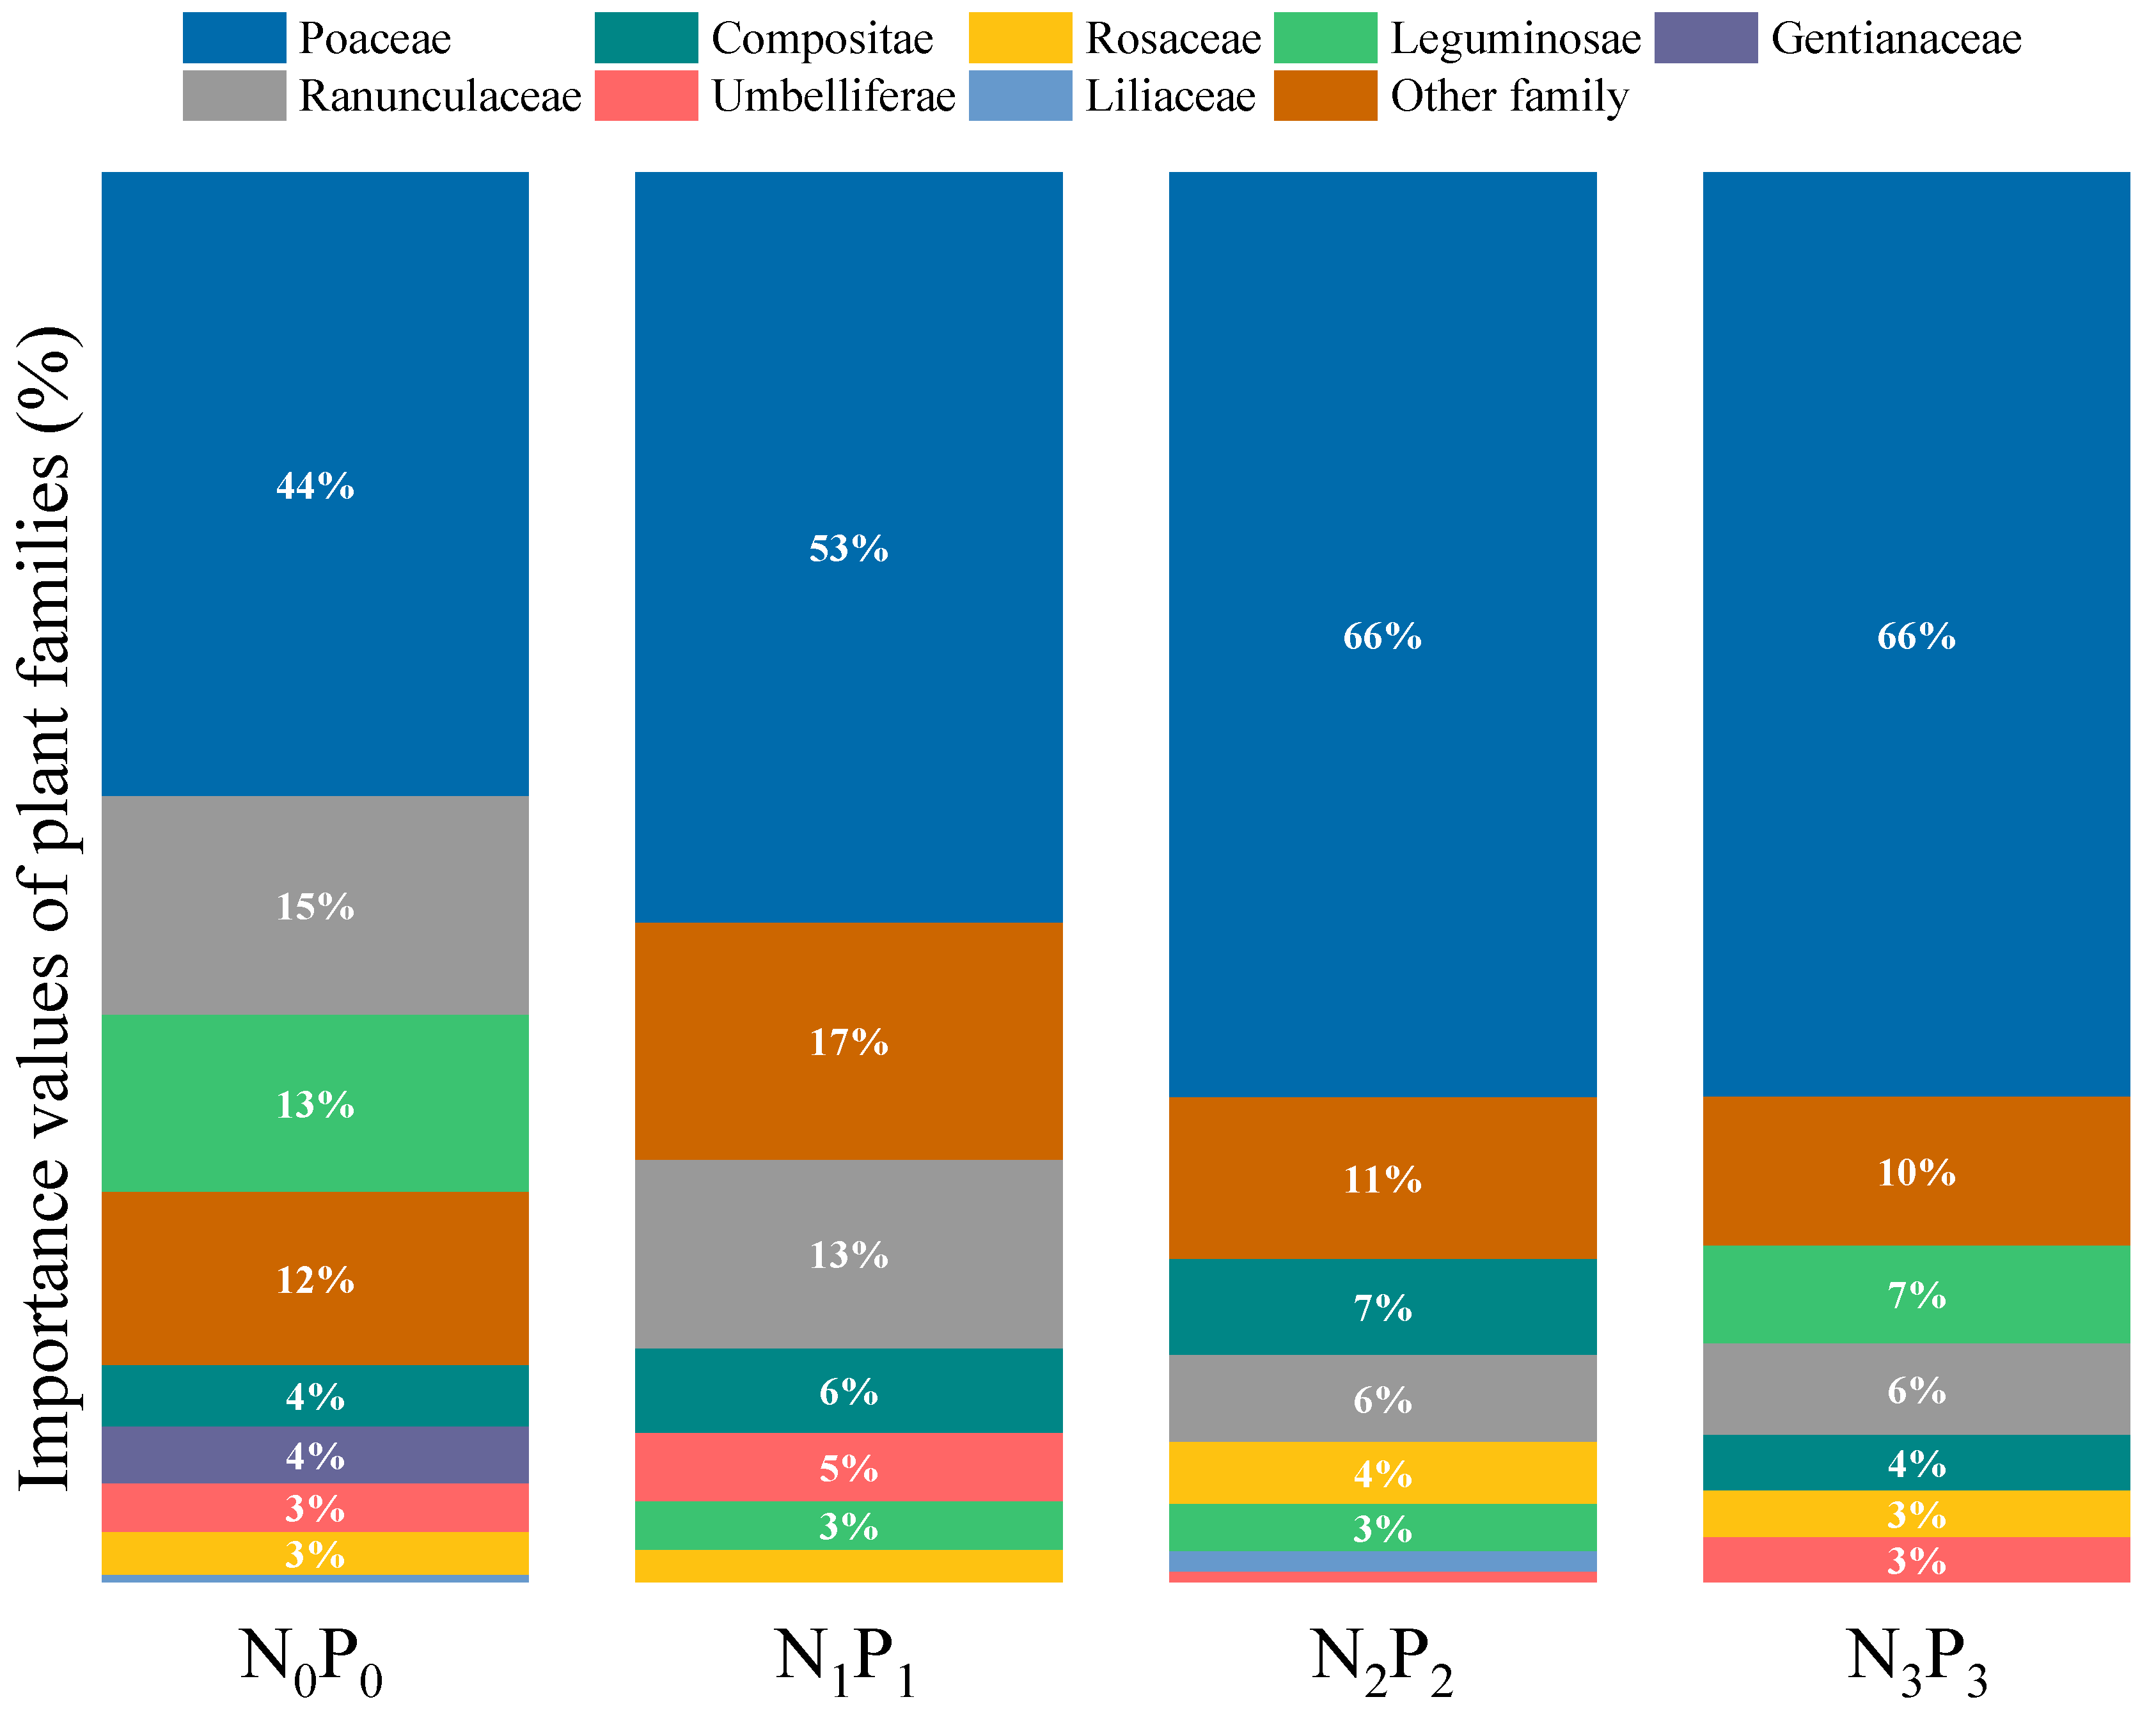
3.1. Effect of N and P Addition on Plant Community Composition and Quantitative Characteristics

The species composition of the grassland community varied with different levels of N and P addition, and the plant species changed with different treatments (Table 2). The results showed that L. chinensis was the dominant species under all treatments, and the importance value of L. chinensis under the N1P1, N2P2, and N3P3 treatments was higher than that under the N0P0 treatment. The importance values of L. chinensis under the N1P1, N2P2, and N3P3 treatments increased by 49.37%, 92.58%, and 92.49%, respectively, compared with the N0P0 treatment. Thirty-seven percent of the species in the community (all Gentianaceae plants, three species of Poaceae plants, two species of Leguminosae plants, and five other species) had higher importance values in the N0P0 treatment, and the more dominant species became more dominant with higher N and P application.
Thirty-five species from the 12 sample plots of the N and P addition trials were systematically clustered and quantitatively classified according to their importance values, and the plants in the four treatments of N0P0, N1P1, N2P2, and N3P3 were grouped into five plant community types with similarity values of 78%, 88%, 92%, and 91%, respectively (Figure 3). Communities were named according to the plant species with the ’most representative observations’ and ‘least representative observations’ of importance in the plant community. The plant community types for the N0P0 treatment were divided into the L. chinensis community, the Heteropappus altaicus + Bupleurum scorzonerifolium community (involving 6 families with 20 plant species), the Achnatherum sibiricum community, the Linaria vulgaris + P. turczaninovii community (involving 10 families with 12 plant species), and the T. squarrosum community; the N1P1 treatment was divided into the L. chinensis community, the C. squarrosa + Serratula centauroides community (involving 2 families with a total of 7 plant species), the Potentilla acaulis + Artemisia tanacetifolia community (involving 4 families with 13 plant species), the T. squarrosum community, and the Dianthus chinensis + Galium verum community (involving 11 families with 13 plant species); the N2P2 treatment was divided into the L. chinensis community, the C. squarrosa + Potentilla bifurca community (involving 3 families with a total of 14 plant species), the Lomatogonium micranthum + Allium ramosum community (involving 5 families with a total of 11 plant species), the T. squarrosum community, and the Linaria vulgaris + Carex duriuscula community (involving 8 plant species in 8 families); the plant community types for the N3P3 treatment were divided into the L. chinensis community, the Lactuca sativa + V. amoena community (involving 4 families with 17 plant species), the P. turczaninovii + Bupleurum scorzonerifolium community (involving 4 families with 8 plant species), the L. vulgaris + C. duriuscula community (involving 8 families with 8 plant species), and the T. squarrosum community.
The importance values of plant families after the addition of different levels of N and P (Figure 4) showed that the dominance of Poaceae plants showed an overall increasing trend under different treatments; the dominance of plants of the Compositae, Rosaceae, Umbelliferae, Liliaceae and other families showed an increasing trend followed by a decreasing trend; the dominance of Leguminosae plants showed an overall decreasing trend followed by an increasing trend; the dominance of Ranunculaceae plants showed an overall decreasing trend; and the dominance of Gentianaceae plants appeared only under the N0P0 treatment and was zero after the addition of nitrogen and phosphorus.
The height, cover, and density of the meadow steppe plant community and the dominant species L. chinensis were significantly increased by different levels of N and P addition (Figure 5). The height of the community under the N2P2 and N3P3 treatments was significantly higher than that under the N0P0 treatment, and the different levels of N and P addition (N1P1, N2P2, and N3P3) all resulted in a significant increase in the height of the dominant species, L. chinensis, by 32.96%, 68.16%, and 67.60%, respectively. The density of the plant community and the dominant species L. chinensis under the different treatments showed a consistent trend, with the density of the community and the dominant species L. chinensis under the N1P1, N2P2, and N3P3 treatments being significantly higher than those under the N0P0 treatment, with no significant difference in the density of the community between the N2P2 and N3P3 treatments. In terms of cover, the plant community and the dominant species L. chinensis cover were significantly higher under different levels of N and P addition than under the N0P0 treatment, but there were no significant differences in community cover among the three N and P addition treatments (N1P1, N2P2, and N3P3) and the dominant species under medium-to-high levels of N and P addition (N2P2, N3P3). The L. chinensis cover in those treatments was significantly higher than that of the N1P1 treatment, by 44.44% and 40.00%, respectively.

3.2. Effect of N and P Addition on Plant Biomass and Its Allocation

3.2.1. Effect of N and P Addition on Plant Community Biomass and Root-to-Shoot Ratio

Figure 6 shows that the aboveground biomass of the community and the dominant species L. chinensis under the N1P1, N2P2, and N3P3 treatments was significantly higher than that under the N0P0 treatment, and the community biomass increased by 84.46%, 176.12%, and 204.08% after low, medium, and high levels of N and P addition, respectively, compared to the non-addition treatments. The total grassland biomass was significantly higher under the N1P1, N2P2, and N3P3 treatments than under the N0P0 treatment, by 38.12%, 36.31%, and 46.44%, respectively, with nonsignificant differences among treatments for each N and P addition level. With increasing levels of N and P addition, the belowground biomass was significantly higher in the 0–30 cm soil layer under the low-level N1P1 treatment than under the N0P0 treatment; overall, the root-to-shoot ratio showed a significant reduction, and the ANOVA results showed that the root-to-shoot ratio and the proportion of belowground biomass were significantly lower for the low, medium, and high levels (N1P1, N2P2, and N3P3) of N and P addition than for the N0P0 treatment; differences between treatments with medium to high levels of N and P addition (N2P2, N3P3) were not significant but were significantly lower than those with low levels (N1P1), but the proportion of aboveground biomass showed the opposite pattern. In summary, this study found that N and P addition significantly increased the aboveground biomass of the dominant species L. chinensis and the community, the belowground biomass, the total grassland biomass, and the aboveground biomass ratio of the community but decreased the belowground biomass ratio, showing significant inhibition of the root-to-shoot ratio of the plant community.

3.2.2. Biomass of Plant Families in the Community after N and P Addition

Changes in plant family biomass occurred after different levels of N and P addition (Figure 7), and there was a gradual increase in the plant biomass of Poaceae under different treatments, with a biomass increase of 162.64%, 379.60%, and 424.20% under N1P1, N2P2, and N3P3 treatments, respectively, compared to the N0P0 treatment; the biomass of Leguminosae plants, although showing numerical decreasing then increasing trends, remained the greatest under the N0P0 treatment, with an overall trend of decreasing biomass; the biomass of Compositae and Rosaceae plants showed an overall trend of increasing followed by decreasing; the biomass of Ranunculaceae plants showed a trend of decreasing followed by increasing; Umbelliferae plants had the highest biomass under the N1P1 treatment with a value of 4.24 g·m−2; the biomass values for Gentianaceae and Liliaceae plants were small and did not vary significantly; and the biomass change in other plant families was greatest in the N1P1 treatment, with a value of 68.01 g·m−2.

3.3. Effect of N and P Addition on Community Species Diversity Indices

The Margalef richness index, Patrick richness index, Shannon–Wiener diversity index, Simpson diversity index, and Pielou evenness index of the plant community gradually showed a significant decreasing trend with increasing levels of N and P addition (Figure 8). Among them, the Margalef and Patrick richness indices and Shannon–Wiener and Simpson diversity indices were significantly higher under the N0P0 treatment than under the N1P1, N2P2, and N3P3 treatments (p < 0.05), and the Margalef and Patrick richness indices were significantly higher under the N1P1 treatment than under the N3P3 treatment (p < 0.05). For the Pielou and Alatalo evenness indices, the N0P0 treatment was significantly higher than the N2P2 treatment (p < 0.05).

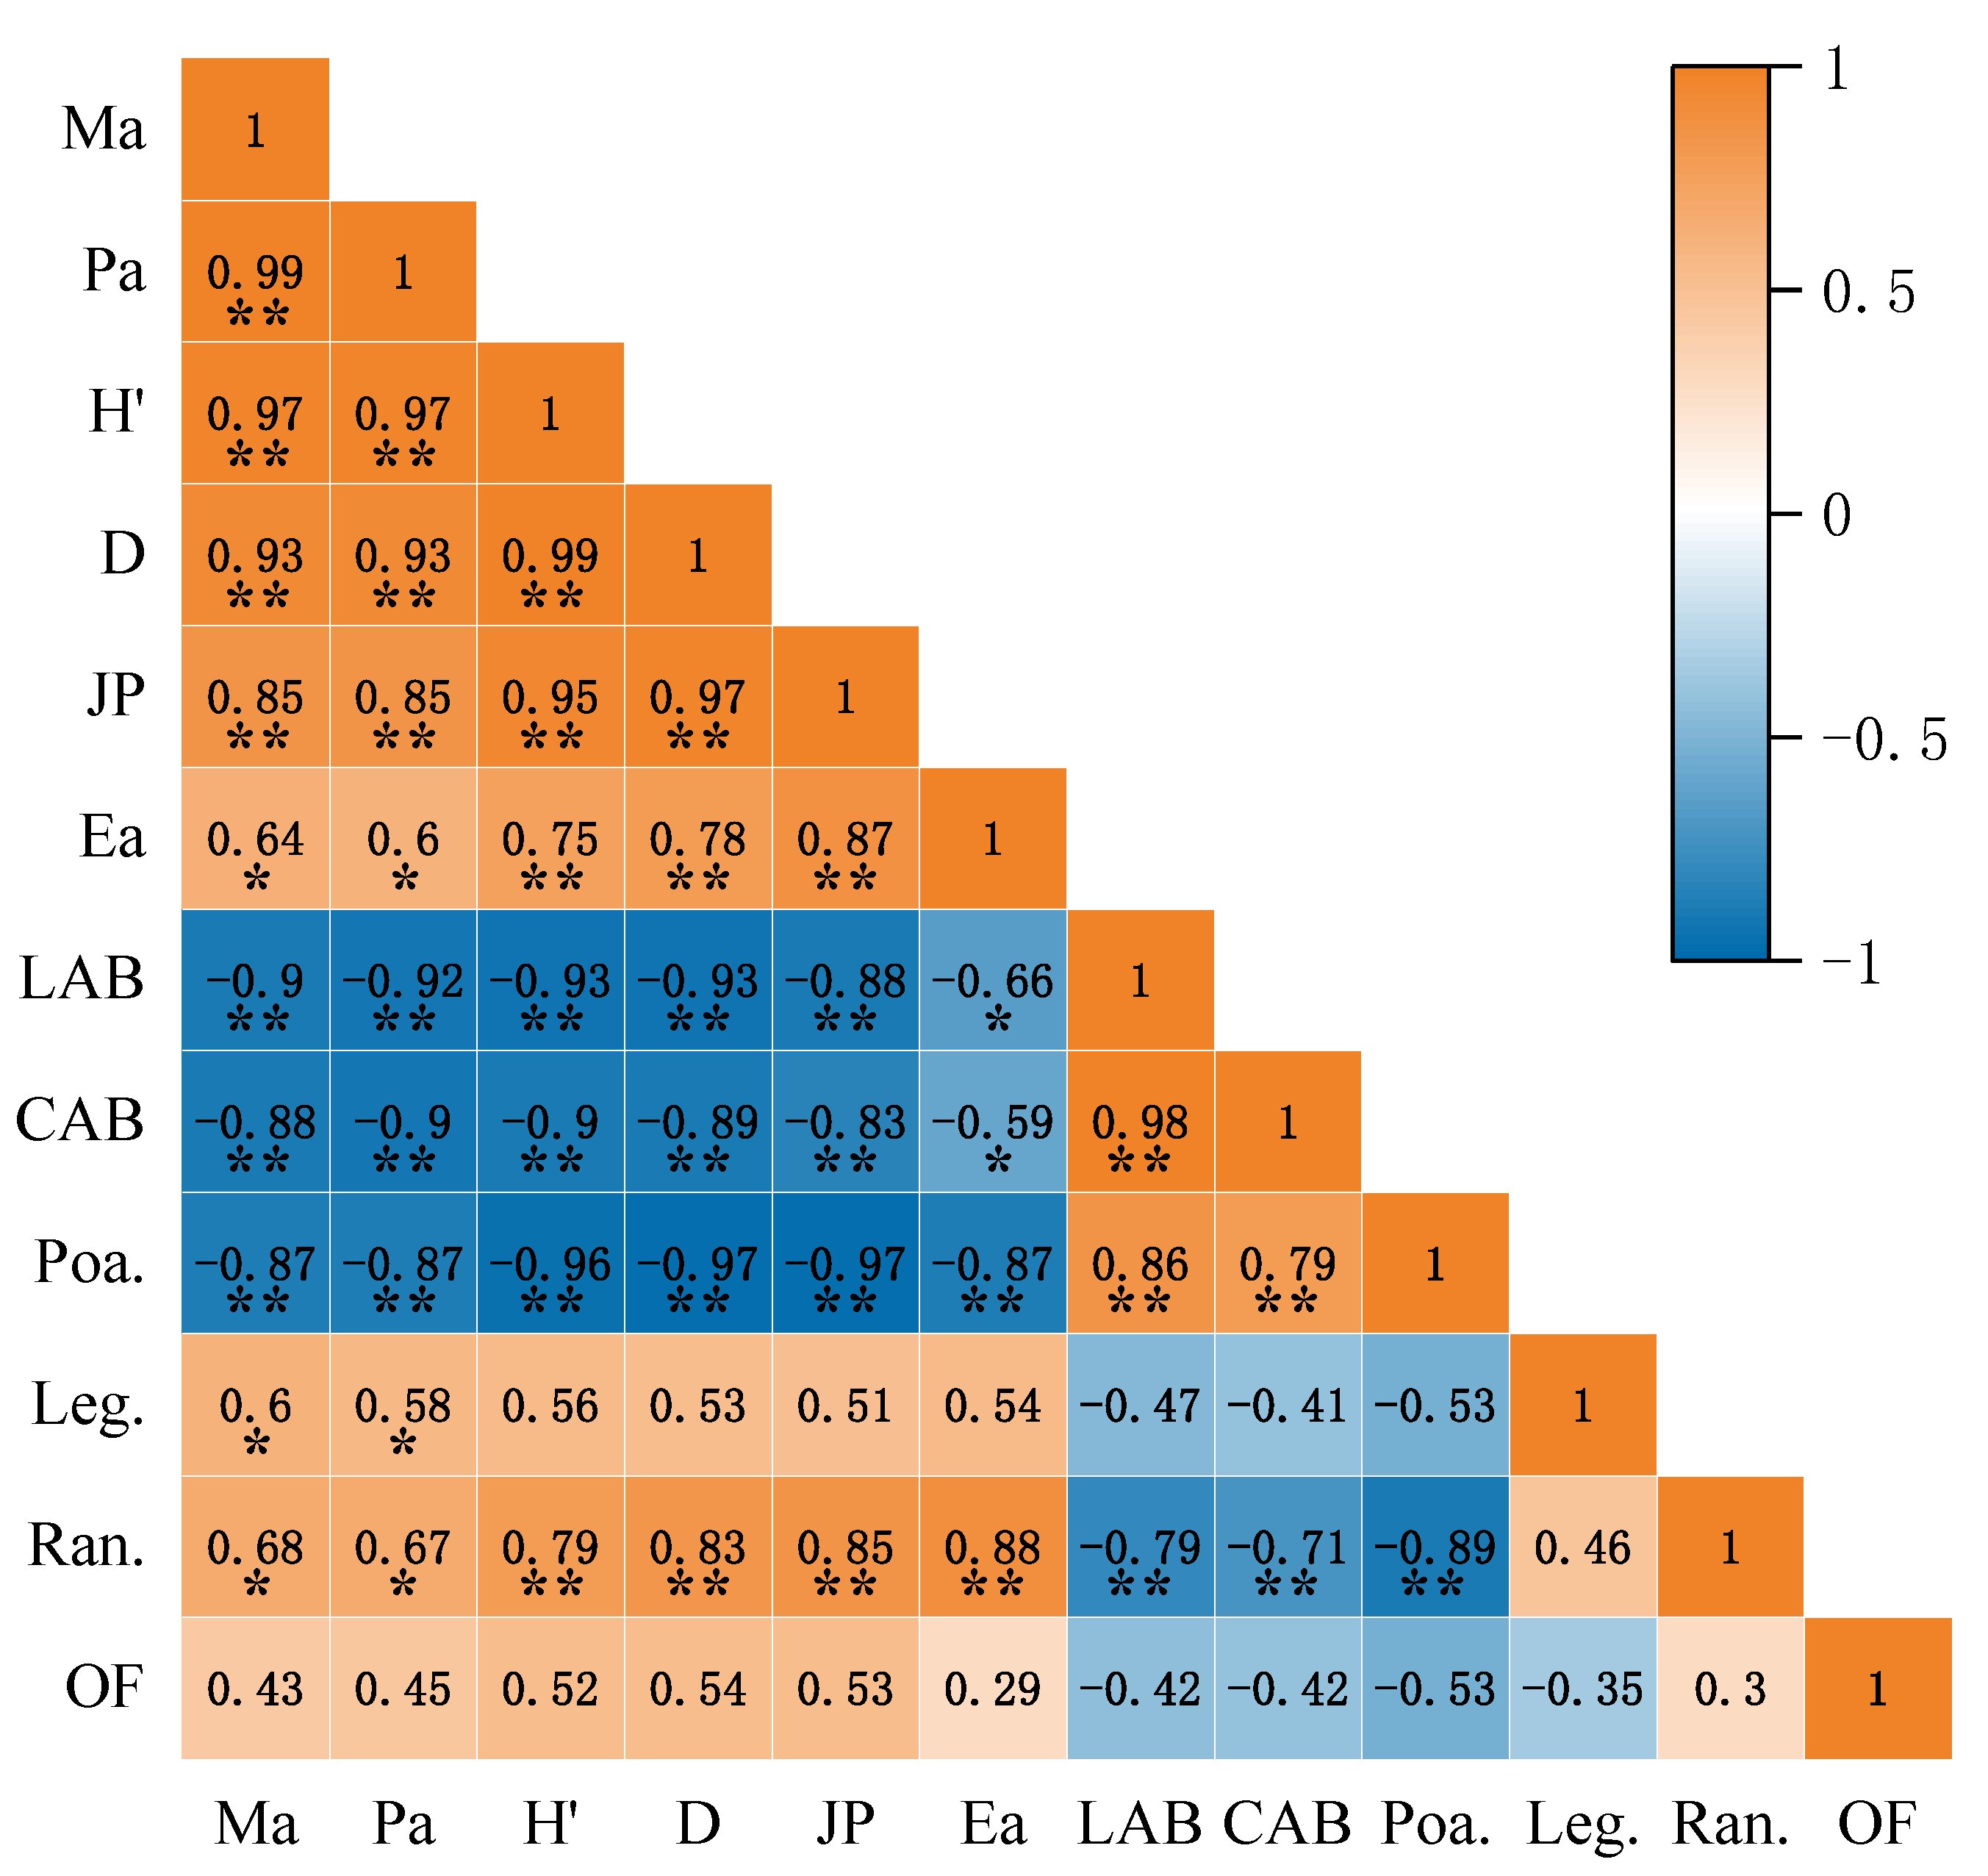
3.4. Effect of N and P Addition on the Correlation of Community Species Diversity Indices, Biomass, and Plant Functional Group Importance Values

We found (Figure 9) a highly significant positive correlation among the Margalef richness index, Patrick richness index, Shannon–Wiener diversity index, Simpson diversity index, and Pielou evenness index (p < 0.01); the aboveground biomass of L. chinensis and the community was significantly negatively correlated with the Alatalo evenness index (p < 0.05) and with the other five community species diversity indices, which were highly significant (p < 0.01); Poaceae plants were highly significantly negatively correlated with all six community species diversity indices and were highly significantly positively correlated with the aboveground biomass of L. chinensis and the community (p < 0.01); Leguminosae plants were significantly positively correlated with the Margalef and Patrick richness indices (p < 0.05); Ranunculaceae plants were significantly positively correlated with the Margalef and Patrick richness indices (p < 0.05) and were also highly significantly positively correlated with the Shannon–Wiener diversity index, the Simpson diversity index, and the Pielou and Alatalo evenness indices (p < 0.01); Ranunculaceae plants were highly significantly negatively correlated with L. chinensis aboveground biomass, community aboveground biomass, and Poaceae plants (p < 0.01).

4. Discussion

4.1. Effects of N and P Addition on the Species Composition of Communities and Their Quantitative Characteristics

The relationships between species changes in habitats after nutrient addition. In this experimental study, no clear pattern of changes in the importance values of individual species was found in the meadow grassland communities after fertilization, but the division of species into higher plant families revealed that the importance values of functional groups composed of different plant species changed significantly with the addition of nitrogen and phosphorus. Phoenix et al. [32] have shown that anthropogenic increases or decreases in nutrients in ecosystems can have a wide range of effects on terrestrial plant communities, while Reich et al. [33] and Suding et al. [34] have suggested that some species and functional groups are more susceptible to decline than others in the presence of increased resources. The height, density, and cover of the dominant species L. chinensis in the plant community of this experimental sample plot increased significantly with the application of nitrogen and phosphorus. The importance value also increased and enhanced the uptake, utilization, and transformation of nitrogen by Poaceae plants [35], and N and P addition caused a significant increase in the dominance of the entire Poaceae functional group. In this experiment, the decrease in the functional group importance of Leguminosae in the three treatments after the addition of nitrogen and phosphorus was related to the inherent nitrogen fixation capacity of Leguminosae plants and the amount of fertilizer applied. N and P addition had a strong effect on the growth of Leguminosae plants, but due to their unique nitrogen fixation capacity, their growth was inhibited to a certain extent when certain nitrogen levels were reached [36]. Poaceae plants are overwhelmingly dominant throughout the community, and their competitiveness throughout the habitat was strongest after the addition of nitrogen and phosphorus, with an abundance of resources and vigorous growth, as these tall plants outcompeted shorter plants for light and limited their growth in the community, which in turn meant that the sum of the importance values of the other plant functional groups (Compositae, Rosaceae, Umbelliferae, Liliaceae, Ranunculaceae, Gentianaceae, etc.) of nondominant species in the community could not compete with that of a single Poaceae. The systematic clustering analysis of Huangshan pine communities in the Daiyunshan National Nature Reserve by Ren et al. [37] reflected the differences in the structure and function of different types of communities and inferred that these differences were mainly determined by the ecological characteristics of different species, suggesting that it is feasible to express the ecological characteristics of different communities using the species diversity index at the community organization level. A study by Birhanu et al. [38] found that changes in plant communities were closely related to environmental factors such as altitude, organic matter, soil nitrogen, and phosphorus. In the present study, the plant community of the L. chinensis meadow grassland was clustered and classified according to the importance values of plant species as reference indicators, and the obtained results generally reflected the effects of N and P addition on the plant community structure at different levels. The dominant communities in this experiment, the L. chinensis community and Thalictrum squarrosum community, were present in all four treatments, while the other three plant communities had different community compositions under different treatments, indicating that the plant community structure of the L. chinensis meadow grassland changed with the different levels of N and P addition.
Vegetation structure is influenced by plant diversity, while plant community cover, biomass, species height and density significantly influence community structure [39,40,41]. The functional traits of plants reflect the impact of environmental variability on ecosystems and are the basis for seeking relationships between plants and their environment while being closely related to plant growth, reproduction, and evolution [42]. Recently, many researchers have explored the mechanisms of nitrogen and phosphorus effects on plant height. The results of this experiment showed that the community canopy height increased significantly after medium to high levels of N and P addition, and the height of the dominant species L. chinensis increased significantly under the three N and P addition treatments, which is consistent with the results of previous studies [43,44,45,46]. Nitrogen application leads to a loss of dwarf species through competitive exclusion, resulting in taller species becoming dominant and increasing the height of the community. The graminoid L. chinensis in this experiment uses fertilizer more efficiently than other species when the soil is supplemented with nitrogen and phosphorus, and its superiority in terms of height growth is fully demonstrated, making it a strong competitor among community species and a dominant player in community height. In a study on the improvement of degraded L. chinensis grasslands, Qilimin et al. [47] found that the L. chinensis population density showed an increasing trend with increasing nitrogen addition without considering other treatments, but there was no significant difference between the treatments. The results of this experiment were similar, but with slight differences. The first difference was that the density of the meadow steppe community and the dominant species L. chinensis decreased slightly when high levels of nitrogen and phosphorus were added; the second difference was that the density of L. chinensis reached its maximum with medium levels of nitrogen and phosphorus fertilization and was significantly greater than that in the no fertilization treatment. Nitrogen and phosphorus can change the soil nutrient content and other characteristics of the plant community. Combining these two differences, it can be concluded that the supplementation of nitrogen and phosphorus improved the vegetation growth environment, and the habitat conditions of the grass L. chinensis in the community were optimal (with the best growth condition and highest density) at a medium level of elemental supplementation; however, the continued increase in nitrogen and phosphorus supplementation increased the size of the dominant plants that were adapted to this environment, and the increase in their individual sizes led to a decrease in community density. The L. chinensis meadow steppe community and the dominant species L. chinensis cover under the N1P1, N2P2, and N3P3 treatments in this experiment were significantly higher than those under the N0P0 treatment, which is the same as the results of previous studies on degraded alpine grasslands [48,49,50,51]. This indicated that fast-acting soil nutrients were increased by the addition of exogenous N and P elements, which reduced potential limitations in vegetation growth and development factors and improved the habitat for the vegetation, especially the dominant graminoid L. chinensis in the community, resulting in taller plants with enhanced access to light resources [51], as shown by increasing the cover of the community and the Poaceae plant L. chinensis.

4.2. Effects of N and P Addition on Grassland Biomass

The productivity of terrestrial ecosystems is limited by a combination of N and P [52,53,54], and the homeostasis of soil nutrients is altered by the addition of nutrient elements, a change that is usually more favorable for the accumulation of dry matter by the plant body. In contrast, nitrogen and phosphorus are functional substances for the plant body, and the productivity of forage grasses can be affected by them [55]. Studies by Elser et al. [56], Xia et al. [57], and Fornara et al. [58] have shown that in most terrestrial ecosystems, fertilization usually increases plant biomass. The total grassland biomass in this experiment was significantly increased by the addition of nitrogen and phosphorus, and the aboveground biomass of the community as well as L. chinensis was significantly greater with the addition of nitrogen and phosphorus than without their addition. The biomass of the aboveground treatments with the addition of medium to high levels of nitrogen and phosphorus was significantly higher than that in the treatment with low levels of nitrogen and phosphorus, where the aboveground biomass of the community increased 1.84–3.04-fold and the biomass of L. chinensis increased 2.87–5.75-fold. The increase in the aboveground biomass of plant communities with increasing fertilizer gradients is because the mixed application of N and P fertilizers balances the soil nutrients and increases the activity of related enzymes (soil phosphatase, urease, etc.) in the soil; thus, promoting the decomposition of N and P [55]; this also indicates that N and P are important limiting factors in the growth of meadow grassland plants, and the increases in their amounts relieve their limitations on plant growth and development to a certain extent, promoting tiller branching and photosynthesis [59]. The root system is an important component of plant performance and crop yield, synthesising and transporting physiologically-active substances [60,61]. Studies have shown that root growth is significantly affected by the addition of nitrogen and phosphorus, with increased fertilizer application promoting increased root biomass [62,63], and Gaudin et al. showed that low levels of elemental addition enhanced root elongation in crops that were subjected to nitrogen stress [64]. The results of this study were the same, with low levels of N and P addition significantly increasing root biomass and moderate fertilizer application promoting nutrient uptake, improving the photosynthetic capacity of the plant and increasing the root distribution in the soil. The root-to-crown ratio reflects the response strategy of plants to their environment [65], and a study by Wang et al. [66] found that high N effectiveness reduced root biomass. In this study, we found that N and P addition significantly inhibited the root-to-crown ratio in plant communities. As aboveground biomass is more sensitive to N and P addition, coupled with the improved soil nutrient status after years of N and P addition, N and P addition can contribute to a decrease in the number of primary roots and an increase in the number of adventitious roots, which in turn leads to a decrease in the root-to-crown ratio.
Groups of species in a system that are directly related to a function and constitute a group of species are often referred to as functional groups, and plant biomass and community productivity are more significantly influenced by the number of species within a functional group [67,68]. Nitrogen is considered to be a key determinant of aboveground net primary productivity, and phosphorus, a nutrient that is essential for plant growth and development, plays an important role in processes such as plant energy synthesis and material conversion [59]. In this experiment, to study the effect of N and P addition on the biomass of functional groups of L. chinensis meadow grassland plants, the plant community was divided into nine functional groups, namely, Poaceae, Compositae, Rosaceae, Leguminosae, Gentianaceae, Ranunculaceae, Umbelliferae, Liliaceae and other families, taking into account the profile and species distribution of the test sample site. Hautier et al. [45] showed that the addition of N and P alleviated the growth limitation of graminoids; Walker et al. [69] found that the increase in biomass of Poaceae and Cyperaceae was closely related to the application of N and P fertilizers. The results of this experiment showed a trend of gradual increase in plant biomass of Poaceae with the increase of nitrogen and phosphorus elements, and the biomass under the N1P1, N2P2, and N3P3 treatments increased by 162.65%, 379.61%, and 424.21%, respectively, compared with the N0P0 treatment. First, light was the main limiting factor in the whole plant community, with Poaceae plants having greater heights and cover than other functional groups, and the graminoid L. chinensis was the dominant species in this plant community, occupying more light resources than other families; second, soil nutrients were also important limiting factors of plant productivity, as Poaceae plants, especially L. chinensis, are in a dominant position to obtain water as well as nutrients from the soil. This stronger ability of Poaceae to compete for environmental resources in the community allows for their better efficiency in using added nitrogen and phosphorus elements and promotes their increased plant biomass.
The results of Hector’s study showed that the biomass of Leguminosae, as a nitrogen-fixing plant in the ecosystem was affected by the addition of nitrogen and phosphorus, but the effect was not significant [70]. Although the biomass of Leguminosae plants in this experiment tended to decrease and then increase numerically, the biomass continued to be the greatest under the N0P0 treatment, with an overall decreasing trend. Leguminosae plants are naturally nitrogen-fixing plants, so the addition of nitrogen and phosphorus increases their productivity, but due to their nature and the increased biomass of Poaceae plants in the community, they are less competitive for light and nutrients, and their growth is limited, resulting in a reduction in the overall productivity of Leguminosae plants in the community. The biomass of Ranunculaceae plants tends to decrease and then increase, considering that Ranunculaceae plants usually contain alkaloids throughout the plant, mostly in the roots, which affect the plant’s uptake of nutrients and, thus, the physiological and biochemical processes involved in the synthesis of various nutrients in the plant. Plants of the Compositae, Rosaceae, and other families showed an overall trend of increasing and then decreasing biomass, all of which were greatest in the N1P1 treatment, probably due to the low levels of N and P addition that allowed these plant species to survive in optimum conditions with better plant growth and higher productivity than in the other treatments. The results of Bai’s experiments in degraded grasslands showed that nitrogen addition reduced the biomass of miscellaneous perennial grasslands [71], and the biomass of Umbelliferae, Gentianaceae, and Liliaceae plants in this experiment had small values and did not vary significantly. The dominant Poaceae plants in the community grew vigorously after the application of nitrogen and phosphorus fertilizers, causing other species in the community to grow as smaller plants as their competitiveness in the habitat was threatened, and the uptake and use of nutrients by lower, shade-intolerant plant species was inhibited [72], resulting in smaller biomass and lower productivity of the miscellaneous grasses in the community as a whole.

4.3. Effects of N and P Addition on Plant Community Diversity

Ecosystem functioning, driven by global change, may be influenced directly or indirectly by plant diversity [73]. Plant competition for a particular nutrient is the most important factor controlling the species composition of plant communities [74]. One of the important characteristics of biomes is the diversity of the community, and importance values are important indicators for assessing species diversity, which together reflect plant community characteristics and the relationship between community and environmental interactions [24]. Several authors have shown that an increase in nutrient availability following fertilizer application reduces plant species diversity [75,76,77]. The study of the L. chinensis meadow steppe in this experiment found that the plant community richness index, diversity index, and evenness index showed an overall significant decrease with increasing levels of N and P addition. In habitats where the nutrient composition deficit was not severe compared to nutrient-poor land, the addition of nitrogen and phosphorus promoted the growth of vegetation and significantly increased the height and cover of the dominant species in the community, especially L. chinensis, resulting in less light penetrating the upper layers of the herbaceous community and reaching the shorter species in the community. As a result, the dominant species outcompete the others and grow more vigorously, and the disadvantaged species are gradually eliminated by exclusion, resulting in a more homogeneous community and reduced species diversity [78].

4.4. Correlation Analysis of Functional Groups, Biomass, and Diversity under Nitrogen and Phosphorus Addition

Differences in utilization and management methods affect biological diversity to varying degrees, and diversity is an important factor in determining ecosystem functions. Many studies have found that the relationship between plant functional groups and community species diversity is more noteworthy than the one-way effects of different treatments on plant species’ importance and community species diversity [79,80,81]. With the increase in fertilization level, the higher the dominance of Poaceae plants, resulting in a significant negative correlation between the biomass, Poaceae plants, and species diversity index. The reason may be that the soil nutrients required for plant growth were guaranteed after fertilization treatment, and the biomass of L. chinensis, the main representative plant of Poaceae, was especially significantly improved, which significantly enhanced its competitiveness and ability to survive in the community. Only a few plants are dominant in the community, and the function of the ecosystem is mainly regulated by these few dominant plants. The increase in other nondominant plants cannot significantly improve the function of the ecosystem [82]. The dominant species L. chinensis preempted the growth environment resources of Leguminosae, Gentianaceae, Ranunculaceae, Umbelliferae, Cyperaceae, and other plants; thus, simplifying the community structure and reducing the community species diversity.

5. Conclusions

Significant changes in the structural composition of plant communities followed different levels of N and P addition. The importance value of L. chinensis showed a trend of increasing with increasing levels of N and P addition and was higher under the N2P2 treatment than under the other treatments. N and P addition increased the dominance proportion and biomass of Poaceae plants, the plant community height, density, cover, aboveground biomass, and belowground biomass but reduced the community species diversity index and the root-to-shoot ratio of the plant community. The community species diversity was highly significantly negatively correlated with the aboveground biomass of L. chinensis and the community and the functional group of Poaceae plants. Leguminosae plants and Ranunculaceae plants were highly significantly positively correlated according to the Margalef and Patrick richness indices. Overall, moderate fertilization not only improved the plant community structure and productivity but was also beneficial for maintaining the grassland species diversity and stability. We acknowledge that multi-year studies with a variety of fertilizers are extremely necessary for empirical testing of fertilizing measures’ effects on the improvement and restoration of degraded grassland and the stability of grassland ecosystems.

Author Contributions

Conceptualization, C.Z. and R.Y.; methodology, C.Z.; investigation, C.Z., Y.Z., S.C. and T.Y.; data curation, C.Z., Y.L. and R.Y.; writing—original draft preparation, C.Z.; writing—review and editing, C.Z., M.W. and R.Y.; and funding acquisition, G.Y., R.Y. and X.X. All authors have read and agreed to the published version of the manuscript.

Funding

This work was funded by the National Key Research and Development Program of China (2021YFF0703904), the Hulunbuir City “Science and Technology” Action Focus Special Project (2021hzzx03), the Science and Technology Plan Project of Inner Mongolia Autonomous Region (2022YFDZ0019), the Fundamental Research Funds Central Nonprofit Scientific Institution (1610132021016), the Special Funding for Modern Agricultural Technology Systems from the Chinese Ministry of Agriculture (CARS-34), and the Agricultural Science and Technology Innovation Alliance Construction—Basic Long-term Scientific and Technological Work in Agriculture (NAES037SQ18).

Data Availability Statement

Not applicable.

Acknowledgments

The authors thank the reviewers and editor for their insightful comments and constructive suggestions.

Conflicts of Interest

The authors declare no conflict of interest.

References

  1. Hao, L.; Sun, G.; Liu, Y.Q.; Gao, Z.Q.; He, J.J.; Shi, T.T.; Wu, B.J. Effects of precipitation on grassland ecosystem restoration under grazing exclusion in Inner Mongolia, China. Landsc. Ecol. 2014, 29, 1657–1673. [Google Scholar] [CrossRef]
  2. Dong, S.K.; Sherman, R. Enhancing the resilience of coupled human and natural systems of alpine rangelands on the Qinghai-Tibetan Plateau. Rangel. J. 2015, 37, 1–3. [Google Scholar] [CrossRef] [Green Version]
  3. Kawamura, K.; Akiyama, T.; Yokota, H.O.; Tsutsumi, M.; Yasuda, T.; Watanabe, O.; Wang, S.P. Quantifying grazing intensities using geographic information systems and satellite remote sensing in the Xilingol steppe region, Inner Mongolia, China. Agric. Ecosyst. Environ. 2005, 107, 83–93. [Google Scholar] [CrossRef]
  4. Dong, S.K.; Shang, Z.H.; Gao, J.X.; Boone, R.B. Enhancing sustainability of grassland ecosystems through ecological restoration and grazing management in an era of climate change on Qinghai-Tibetan Plateau. Agric. Ecosyst. Environ. 2020, 287, 106684. [Google Scholar] [CrossRef]
  5. Báez, S.; Fargione, J.; Moore, D.I.; Collins, S.L.; Gosz, J.R. Atmospheric nitrogen deposition in the northern Chihuahuan desert: Temporal trends and potential consequences. J. Arid Environ. 2007, 68, 640–651. [Google Scholar] [CrossRef]
  6. Galloway, J.N.; Dentener, F.J.; Capone, D.G.; Boyer, E.W.; Howarth, R.W.; Seitzinger, S.P.; Asner, G.P.; Cleveland, C.C.; Green, P.A.; Holland, E.A.; et al. Nitrogen cycles: Past, present, and future. Biogeochemistry 2004, 70, 153–226. [Google Scholar] [CrossRef]
  7. Li, M.Y.; Zhao, P.J.; Wu, L.B.; Chen, K. Effects of value perception, environmental regulation and their interaction on the improvement of herdsmen’s grassland ecological policy satisfaction. Int. J. Environ. Res. Public Health 2021, 18, 3078. [Google Scholar] [CrossRef]
  8. Wang, J.; Geng, Z.Z.; Xiao, H.F. Influence of Grassland Ecological Protection Subsidy-award Policies on Breeding Scale in China: An Empirical Study Based on Provincial Panel Data. J. PKU Aeronaut. Astronaut. Soc. Sci. 2018, 31, 84–93. [Google Scholar] [CrossRef]
  9. Basto, S.; Thompson, K.; Phoenix, G.; Sloan, V.; Leake, J.; Rees, M. Long-term nitrogen deposition depletes grassland seed banks. Nat. Commun. 2015, 6, 6185. [Google Scholar] [CrossRef] [Green Version]
  10. Virágh, K.; Tóth, T.; Somodi, I. Effect of slight vegetation degradation on soil properties in Brachypodium pinnatum grasslands. Plant Soil 2011, 345, 303–313. [Google Scholar] [CrossRef]
  11. Li, S.Y.; Verburg, P.H.; Lv, S.H.; Wu, J.L.; Li, X.B. Spatial analysis of the driving factors of grassland degradation under conditions of climate change and intensive use in Inner Mongolia, China. Reg. Environ. Chang. 2012, 12, 461–474. [Google Scholar] [CrossRef]
  12. Dlamini, P.; Chivenge, P.; Manson, A.; Chaplot, V. Land degradation impact on soil organic carbon and nitrogen stocks of subtropical humid grasslands in South Africa. Geoderma 2014, 235, 372–381. [Google Scholar] [CrossRef]
  13. Mekuria, W.; Veldkamp, E.; Haile, M.; Nyssen, J.; Muys, B.; Gebrehiwot, K. Effectiveness of exclosures to restore degraded soils as a result of overgrazing in Tigray, Ethiopia. J. Arid Environ. 2007, 69, 270–284. [Google Scholar] [CrossRef]
  14. Schlesinger, W.H.; Bernhardt, E.S. Biogeochemistry: An Analysis of Global Change; Academic Press: Waltham, MA, USA, 2013; pp. 1–672. ISBN 978-01-2385-874-0. [Google Scholar]
  15. Li, K.H.; Liu, X.J.; Song, L.; Gong, Y.M.; Lu, C.F.; Yue, P.; Tian, C.Y.; Zhang, F.S. Response of alpine grassland to elevated nitrogen deposition and water supply in China. Oecologia 2015, 177, 65–72. [Google Scholar] [CrossRef]
  16. Plassmann, K.; Edwards-Jones, G.; Jones, M.L.M. The effects of low levels of nitrogen deposition and grazing on dune grassland. Sci. Total Environ. 2009, 407, 1391–1404. [Google Scholar] [CrossRef]
  17. Gu, J.F.; Li, Z.K.; Mao, Y.Q.; Struik, P.C.; Zhang, H.; Liu, L.J.; Wang, Z.Q.; Yang, J.C. Roles of nitrogen and cytokinin signals in root and shoot communications in maximizing of plant productivity and their agronomic applications. Plant Sci. 2018, 274, 320–331. [Google Scholar] [CrossRef]
  18. Song, M.H.; Yu, F.H. Reduced compensatory effects explain the nitrogen-mediated reduction in stability of an alpine meadow on the Tibetan Plateau. New Phytol. 2015, 207, 70–77. [Google Scholar] [CrossRef] [PubMed]
  19. Christopher, M.C.; Philip, E.M.; Frank, S.G.; Linda, H.P. Estimated losses of plant biodiversity in the United States from historical N deposition (1985–2010). Ecology 2013, 94, 1441–1448. [Google Scholar] [CrossRef]
  20. Simkin, S.M.; Allen, E.B.; Bowman, W.D.; Clark, C.M.; Belnap, J.; Brooks, M.L.; Cade, B.S.; Collins, S.L.; Geiser, L.H.; Gilliam, F.S.; et al. Conditional vulnerability of plant diversity to atmospheric nitrogen deposition across the United States. Proc. Natl. Acad. Sci. USA 2016, 113, 4086–4091. [Google Scholar] [CrossRef] [Green Version]
  21. Dai, J. Effects of Root Cutting and Fertilizer Application on Vegetation and Soil of Leymus Chinensis Meadow Mowing; Inner Mongolia Agricultural University: Huhehaote, China, 2016; pp. 13–29. [Google Scholar]
  22. Yan, R.R.; Xin, X.P.; Yan, Y.C.; Wang, X.; Zhang, B.H.; Yang, G.X.; Liu, S.M.; Deng, Y.; Li, L.H. Impacts of Differing Grazing Rates on Canopy Structure and Species Composition in Hulunber Meadow Steppe. Rangel. Ecol. Manag. 2015, 68, 54–64. [Google Scholar] [CrossRef]
  23. Zhang, Y.; Hou, L.L.; Yan, R.R.; Xin, X.P. Effects of grazing intensity on plant community characteristics and nutritional quality of meadow grassland. Chin. Agric. Sci. 2020, 53, 2550–2561. [Google Scholar] [CrossRef]
  24. Tilman, D.; Wedin, D.; Knops, J. Productivity and sustainability influenced by biodiversity in grassland ecosystems. Nature 1996, 379, 718–720. [Google Scholar] [CrossRef]
  25. Tilman, D.; Downing, J.A. Biodiversity and stability in grasslands. Nature 1994, 367, 363–365. [Google Scholar] [CrossRef]
  26. Shannon, C.E. A mathematical theory of communication. Bell Syst. Tech. J. 1948, 27, 379–423. [Google Scholar] [CrossRef] [Green Version]
  27. Simpson, E.H. Measurement of diversity. Nature 1949, 163, 688. [Google Scholar] [CrossRef]
  28. Margalef, R. On certain unifying principles in ecology. Am. Nat. 1963, 97, 357–374. [Google Scholar] [CrossRef]
  29. Pielou, E.C. Species-diversity and pattern-diversity in the study of ecological succession. J. Theor. Biol. 1966, 10, 370–383. [Google Scholar] [CrossRef]
  30. Ma, K.P.; Huang, J.H.; Yu, S.L. Study in species diversity, richness index, evenness index, species diversity index of vegetation community in Donglingshan Area in Beijing. Ecol. J. 1995, 15, 268–277. [Google Scholar] [CrossRef]
  31. Ma, K.P.; Liu, Y.M. Measure method of biocommunity’s diversity. Chin. Biodiv. 1994, 2, 231–239. [Google Scholar]
  32. Phoenix, G.K.; Hicks, W.K.; Cinderby, S.; Kuylenstierna, J.C.I.; Stock, W.D.; Dentener, F.J.; Giller, K.E.; Austin, A.T.; Lefroy, R.D.B.; Gimeno, B.S.; et al. Atmospheric nitrogen deposition in world biodiversity hotspots: The need for a greater global perspective in assessing N deposition impacts. Glob. Change Biol. 2006, 12, 470–476. [Google Scholar] [CrossRef]
  33. Reich, P.B.; Buschena, C.; Tjoelker, M.G.; Wrage, K.; Knops, J.; Tilman, D.; Machado, J.L. Variation in growth rate and ecophysiology among 34 grassland and savanna species under contrasting N supply: A test of functional group differences. New Phytol. 2003, 157, 617–631. [Google Scholar] [CrossRef]
  34. Suding, K.N.; Collins, S.L.; Gough, L.; Clark, C.; Cleland, E.E.; Gross, K.L.; Milchunas, D.G.; Pennings, S. Functional- and abundance-based mechanisms explain diversity loss due to N fertilization. Proc. Natl. Acad. Sci. USA 2005, 102, 4387–4392. [Google Scholar] [CrossRef] [PubMed] [Green Version]
  35. Bowman, W.D.; Gartner, J.R.; Holland, K.; Wiedermann, M. Nitrogen Critical Loads for Alpine Vegetation and Terrestrial Ecosystem Response: Are We There Yet? Ecol. Appl. 2006, 16, 1183–1193. [Google Scholar] [CrossRef]
  36. Eardly, B.D.; Hannaway, D.B.; Bottomley, P.J. Nitrogen Nutrition and Yield of Seedling Alfalfa as Affected by Ammonium Nitrate Fertilization1. Agron. J. 1985, 77, 57–62. [Google Scholar] [CrossRef]
  37. Ren, G.X.; Liu, J.F.; Xu, D.W.; Hong, W.; Zheng, S.Q.; Huang, Z.S. Analysis on classification and species diversity of Pinus taiwanensis community in Daiyun Mountain National Nature Reserve. J. Plant Resour. Environ. 2011, 20, 82–88. [Google Scholar] [CrossRef]
  38. Birhanu, L.; Bekele, T.; Tesfaw, B.; Demissew, S.H.M. Relationships between topographic factors, soil and plant communities in a dry Afromontane Forest Patches of Northwestern Ethiopia. PLoS ONE 2021, 16, e0247966. [Google Scholar] [CrossRef]
  39. Spehn, E.M.; Joshi, J.; Schmid, B.; Diemer, M.; Körner, C. Above-groud resource use increase with plant species richness in experiment grassland ecosystem. Funct. Ecol. 2000, 14, 326–337. [Google Scholar] [CrossRef]
  40. Jiang, Y.X.; Wang, B.S.; Zang, R.G.; Jin, J.H.; Liao, W.B. The Biodiversity and Its Formation Mechanism of Tropical Forests in Hainan Island; Science Press: Beijing, China, 2002; pp. 217–233. [Google Scholar]
  41. Feng, Y.Z. Species diversity and managed ecosystem stability. J. Appl. Ecol. 2003, 14, 853–857. [Google Scholar]
  42. Liu, Z.Y.; Baoyin, T.G.T.; Duan, J.J.; Yang, G.F.; Sun, J.; Li, X.L. Nutrient Characteristics in Relation to Plant Size of a Perennial Grass Under Grazing Exclusion in Degraded Grassland. Front. Plant Sci. 2018, 9, 295. [Google Scholar] [CrossRef]
  43. Zhou, X.L.; Guo, Z.; Zhang, P.F.; Du, G.Z. Shift in community functional composition following nitrogen fertilization in an alpine meadow through intraspecific trait variation and community composition change. Plant Soil 2018, 431, 289–302. [Google Scholar] [CrossRef]
  44. Schellberg, J.; Pontes, L.S. Plant functional traits and nutrient gradients on grassland. Grass Forage Sci. 2012, 67, 305–319. [Google Scholar] [CrossRef]
  45. Hautier, Y.; Niklaus, P.A.; Hector, A. Competition for light causes plant biodiversity loss after eutrophication. Science 2009, 324, 636–638. [Google Scholar] [CrossRef]
  46. Zhou, X.L.; Guo, Z.; Zhang, P.F.; Li, H.L.; Chu, C.J.; Li, X.L.; Du, G.Z. Different categories of biodiversity explain productivity variation after fertilization in a Tibetan alpine meadow community. Ecol. Evol. 2017, 7, 3464–3474. [Google Scholar] [CrossRef] [PubMed]
  47. Qi, L.M.; Baoyin, T.G.T.; Li, Y.R.; Li, Y.H.; Chen, J.S. Analysis of the effect of root cutting method and nitrogen addition on the improvement of degraded Leymus chinensis grassland. Chin. J. Grassl. 2017, 39, 67–71. [Google Scholar] [CrossRef]
  48. Zong, N.; Shi, P.L. Enhanced community production rather than structure improvement under nitrogen and phosphorus addition in severely degraded alpine meadows. Sustainability 2019, 11, 2023. [Google Scholar] [CrossRef] [Green Version]
  49. Jiang, J.; Shi, P.L.; Zong, N.; Fu, G.; Shen, Z.X.; Zhang, X.Z.; Song, M. H, Climatic patterns modulate ecosystem and soil respiration responses to fertilization in an alpine meadow on the Tibetan Plateau, China. Ecol. Res. 2015, 30, 3–13. [Google Scholar] [CrossRef]
  50. Yang, X.X.; Ren, F.; Zhou, H.K.; He, J.S. Responses of plant community biomass to nitrogen and phosphorus additions in an alpine meadow on the Qinghai-Xizang Plateau. J. Plant Ecol. 2014, 38, 159–166. [Google Scholar] [CrossRef]
  51. Li, C.Q.; Li, Q.; Zhao, L.; Zhao, X.Q. Responses of plant community biomass to nitrogen and phosphorus additions in natural and restored grasslands around Qinghai Lake Basin. J. Plant Ecol. 2016, 40, 1015–1027. [Google Scholar] [CrossRef] [Green Version]
  52. Harpole, W.S.; Ngai, J.T.; Cleland, E.E.; Seabloom, E.W.; Borer, E.T.; Bracken, M.E.S.; Elser, J.J.; Gruner, D.S.; Hillebrand, H.; Shurin, J.B.; et al. Nutrient colimitation of primary producer communities. Ecol. Lett. 2011, 14, 852–862. [Google Scholar] [CrossRef]
  53. Carnicer, J.; Sardans, J.; Stefanescu, C.; Ubach, A.; Bartrons, M.; Asensio, D.; Penuelas, J. Global biodiversity, stoichiometry and ecosystem function responses to human-induced C–N–P imbalances. J. Plant Physiol. 2015, 172, 82–91. [Google Scholar] [CrossRef] [Green Version]
  54. Bracken, M.E.S.; Hillebrand, H.; Borer, E.T.; Seabloom, E.W.; Cebrian, J.; Cleland, E.E.; Elser, J.J.; Gruner, D.S.; Harpole, W.S.; Ngai, J.T.; et al. Signatures of nutrient limitation and colimitation: Responses of autotroph internal nutrient concentrations to nitrogen and phosphorus additions. Oikos 2015, 124, 113–121. [Google Scholar] [CrossRef]
  55. Wei, C.Z.; Yu, Q.; Bai, E.; Lü, X.T.; Li, Q.; Xia, J.Y.; Kardol, P.; Liang, W.J.; Wang, Z.W.; Han, X.G. Nitrogen deposition weakens plant–microbe interactions in grassland ecosystems. Glob. Chang. Biol. 2013, 19, 3688–3697. [Google Scholar] [CrossRef]
  56. Elser, J.J.; Bracken, M.E.S.; Cleland, E.E.; Gruner, D.S.; Harpole, W.S.; Hillebrand, H.; Ngai, J.T.; Seabloom, E.W.; Shurin, J.B.; Smith, J.E. Global analysis of nitrogen and phosphorus limitation of primary producers in freshwater, marine and terrestrial ecosystems. Ecol. Lett. 2007, 10, 1135–1142. [Google Scholar] [CrossRef] [Green Version]
  57. Xia, J.Y.; Wan, S.Q. Global response patterns of terrestrial plant species to nitrogen addition. New Phytol. 2008, 179, 428–439. [Google Scholar] [CrossRef] [PubMed]
  58. Fornara, D.A.; Banin, L.; Crawley, M.J. Multinutrient vs. nitrogen-only effects on carbon sequestration in grassland soils. Glob. Chang. Biol. 2013, 19, 3848–3857. [Google Scholar] [CrossRef] [Green Version]
  59. Johnston, A.E.; Poulton, P.R. The role of phosphorus in crop production and soil fertility:150 years of field experiments at Rothamsted, United Kingdon. In Phosphate Fertilizers and the Environment: Proceedings of an International Workshop; Schultz, J.J., Ed.; International Fertilizer Development Center: Tampa, FL, USA, 1992; pp. 45–64. [Google Scholar]
  60. Palta, J.A.; Yang, J.C. Crop root system behaviour and yield. Field Crop. Res. 2014, 165, 1–149. [Google Scholar] [CrossRef]
  61. Mohd-Radzman, N.A.; Djordjevic, M.A.; Imin, N. Nitrogen modulation of legume root architecture signalling pathways involves phytohormones and small regulatory molecules. Front. Plant Sci. 2013, 4, 385. [Google Scholar] [CrossRef] [Green Version]
  62. Fan, J.B.; Zhang, Y.L.; Turner, D.; Yin-Hua, D.; Dong-Sheng, W.; Qi-Rong, S. Root physiological and morphological characteristics of two rice cultivars with different nitrogen-use efficiency. Pedosphere 2010, 20, 446–455. [Google Scholar] [CrossRef]
  63. Zhang, H.Z.; Khan, A.; Tan, D.K.Y.; Luo, H.H. Rational water and nitrogen management improves root growth, increases yield and maintains water use efficiency of cotton under mulch drip irrigation. Front. Plant Sci. 2017, 8, 912. [Google Scholar] [CrossRef]
  64. Gaudin, A.C.M.; Mcclymont, S.A.; Holmes, B.M.; Lyons, E.; Raizada, M.N. Novel temporal, fine-scale and growth variation phenotypes in roots of adult-stage maize (Zea mays L.) in response to low nitrogen stress. Plant Cell Environ. 2011, 34, 2122–2137. [Google Scholar] [CrossRef] [PubMed]
  65. Wang, L.M.; Li, L.H.; Chen, X.; Tian, X.; Wang, X.K.; Luo, G.P. Biomass Allocation Patterns across China’s Terrestrial Biomes. PLoS ONE 2014, 9, e93566. [Google Scholar] [CrossRef] [PubMed]
  66. Wang, Y.; Mi, G.H.; Chen, F.J.; Zhang, J.H.; Zhang, F.S. Response of root morphology to nitrate supply and its contribution to nitrogen accumulation in maize. J. Plant Nutr. 2005, 27, 2189–2202. [Google Scholar] [CrossRef]
  67. Bengtsson, J. Which species? What kind of diversity? Which ecosystem function? Some problems in studies of relations between biodiversity and ecosystem function. Appl. Soil Ecol. 1998, 10, 191–199. [Google Scholar] [CrossRef]
  68. Naeem, S.; Li, S. Biodiversity enhance ecosystem reliability. Nature 1997, 390, 507–509. [Google Scholar] [CrossRef]
  69. Walker, M.D.; Webber, P.J.; Arnold, E.H.; Ebert-May, D. Effects of interannual climate variation on aboveground phytomass in alpine vegetation. Ecology 1994, 75, 393–408. [Google Scholar] [CrossRef]
  70. Hector, A.; Schmid, B.; Beierkuhnlein, C.; Caldeira, M.C.; Diemer, M.; Dimitrakopoulos, P.G.; Finn, J.A.; Freitas, H.; Giller, P.S.; Good, J.; et al. Plant diversity and productivity experiments in european grasslands. Science 1999, 286, 1123–1127. [Google Scholar] [CrossRef] [Green Version]
  71. Bai, Y.F.; Wu, J.G.; Clark, C.M.; Naeem, S.; Pan, Q.M.; Huang, J.H.; Zhang, L.X.; Han, X.G. Tradeoffs and thresholds in the effects of nitrogen addition on biodiversity and ecosystem functioning: Evidence from Inner Mongolia grasslands. Glob. Change Biol. 2010, 16, 358–372. [Google Scholar] [CrossRef]
  72. Tilman, D. Secondary succession and the pattern of plant dominance along experimental nitrogen gradients. Ecol. Monogr. 1987, 57, 189–214. [Google Scholar] [CrossRef]
  73. Balvanera, P.; Pfisterer, A.B.; Buchmann, N.; He, J.S.; Nakashizuka, T.; Raffaelli, D.; Schmid, B. Quantifying the evidence for biodiversity effects on ecosystem functioning and services. Ecol. Lett. 2006, 9, 1146–1156. [Google Scholar] [CrossRef] [Green Version]
  74. Huston, M.; Smith, T. Plant Succession: Life History and Competition. Am. Nat. 1987, 130, 168–198. [Google Scholar] [CrossRef]
  75. Borer, E.T.; Seabloom, E.W.; Gruner, D.S.; Harpole, W.S.; Hillebrand, H.; Lind, E.M.; Adler, P.B.; Alberti, J.; Anderson, T.M.; Bakker, J.D.; et al. Herbivores and nutrients control grassland plant diversity via light limitation. Nature 2014, 508, 517–520. [Google Scholar] [CrossRef] [Green Version]
  76. Yang, Z.L.; Hautier, Y.; Borer, E.T.; Zhang, C.H.; Du, G.Z. Abundance-and functional-based mechanisms of plant diversity loss with fertilization in the presence and absence of herbivores. Oecologia 2015, 179, 261–270. [Google Scholar] [CrossRef] [PubMed]
  77. Harpole, W.S.; Sullivan, L.L.; Lind, E.M.; Firn, J.; Adler, P.B.; Borer, E.T.; Chase, J.; Fay, P.A.; Hautier, Y.; Hillebrand, H.; et al. Addition of multiple limiting resources reduces grassland diversity. Nature 2016, 537, 93–96. [Google Scholar] [CrossRef] [Green Version]
  78. Zhao, Y.N.; Yang, B.; Li, M.X.; Xiao, R.Q.; Rao, K.Y.; Wang, J.Q.; Zhang, T.; Guo, J.X. Community Composition, Structure and Productivity in Response to Nitrogen and Phosphorus Additions in a Temperate Meadow. Sci. Total Environ. 2019, 654, 863–871. [Google Scholar] [CrossRef]
  79. Bellard, C.; Bertelsmeier, C.; Leadley, P.; Thuiller, W.; Courchamp, F. Impacts of climate change on the future of biodiversity. Ecol. Lett. 2012, 15, 365–377. [Google Scholar] [CrossRef] [Green Version]
  80. Minden, V.; Scherber, C.; Cebrián, P.; Miguel, A.; Trinogga, J.; Trenkamp, A.; Mantilla-Contreras, J.; Lienin, P.; Kleyer, M. Consistent drivers of plant biodiversity across managed ecosystems. Philos. Trans. R. Soc. B 2016, 371, 1694. [Google Scholar] [CrossRef] [Green Version]
  81. Drescher, J.; Rembold, K.; Allen, K.; Beckschäfer, P.; Buchori, D.; Clough, Y.; Faust, H.; Fauzi, A.M.; Gunawan, D.; Hertel, D.; et al. Ecological and socioeconomic functions across tropical land use systems after rainforest conversion. Philos. Trans. R. Soc. B 2016, 371, 1694. [Google Scholar] [CrossRef] [Green Version]
  82. Lawton, J.H. What do species do in ecosystems? Oikos 1994, 71, 367–374. [Google Scholar] [CrossRef]
Figure 1. Monthly average temperature and precipitation in the experimental area for 2021.
Agronomy 13 00208 g001
Figure 2. Study area geographic location and the experimental layout.
Agronomy 13 00208 g002
Figure 3. Clustered dendrograms of the plant community systems under different nitrogen and phosphorus addition treatments. (A) No NP addition (N0P0), (B) low-level NP addition (N1P1), (C) medium-level NP addition (N2P2), and (D) high-level NP addition (N3P3). The different colors indicate that the plant species have been divided into different subcommunities.
Agronomy 13 00208 g003
Figure 4. Importance values of plant families among N and P addition treatments. The basic unit of plant classification is the species, and some species with more commonalities are grouped into families. We classify plants according to families, which can represent the different functional groups of plants.
Agronomy 13 00208 g004
Figure 5. Quantitative characteristics of the plant community and L. chinensis among N and P addition treatments. (A) Height, (B) density, (C) cover. The black box line diagrams represent L. chinensis, the red box line diagrams represent the plant community (the plant community includes L. chinensis), and the blue circles represent the average of the data indicators under the corresponding treatment. Lower case letters in the graphs indicate significant differences (p < 0.05, LSD test).
Agronomy 13 00208 g005
Figure 6. Changes in plant community biomass and root-to-shoot ratio after N and P addition. (A) Aboveground biomass of L. chinensis, (B) aboveground biomass of the community, (C) belowground biomass in the 0–30 cm soil layer, (D) total biomass of grassland, (E) root–shoot ratio, (F) biomass allocation ratio. Lower case letters in the graphs indicate significant differences. Lower case letters in the graphs indicate significant differences (p < 0.05, LSD test).
Agronomy 13 00208 g006
Figure 7. Aboveground biomass of plant families in the community among NP addition treatments.
Agronomy 13 00208 g007
Figure 8. Changes in the species diversity index of L. chinensis meadow grassland communities after NP addition. (A) Margalef richness index, (B) Shannon–Wiener diversity index, (C) Pielou evenness index, (D) Patrick richness index, (E) Simpson diversity index, (F) Alatalo evenness index. The y function is the corresponding quadratic fitting equation, and R2 represents the goodness-of-fit value. Lower case letters in the graphs indicate significant differences (p < 0.05, LSD test).
Agronomy 13 00208 g008
Figure 9. Heatmap for correlation analysis of community species diversity, biomass, and plant functional group importance values under N and P addition. Ma, Margalef richness index; Pa, Patrick richness index; H’, Shannon–Wiener diversity index; D, Simpson diversity index; JP, Pielou evenness index; Ea, Alatalo evenness index; LAB, aboveground biomass of L. chinensis; CAB, aboveground biomass of the community; Poa., the importance values of Poaceae plants; Leg., the importance values of Leguminosae plants; Ran., the importance values of Ranunculaceae plants; OF, the importance values of other families. * and ** represent a significant correlation at the 0.05 and 0.01 levels, respectively.
Agronomy 13 00208 g009
Table 1. Soil basic properties indicator of the test site.
Soil Depth (cm)TN (g·kg−1)TP (g·kg−1)TK (g·kg−1)TC (g·kg−1)pH
0–103.280.5122.6237.796.97
10–202.770.5024.2329.337.01
20–302.120.4522.3821.677.13
Note: TN, total nitrogen; TP, total phosphorus; TK, total potassium; TC, total carbon.
Table 2. Plant species importance values among NP addition treatments.
FamilySpeciesN0P0N1P1N2P2N3P3
PoaceaeLeymus chinensis34.09 ± 8.6950.92 ± 3.0165.65 ± 1.9865.62 ± 0.34
Stipa baicalensis2.05 ± 2.05000
Koeleria cristata0.44 ± 0.440.59 ± 0.5900
Poa annua0.00 ± 0.001.32 ± 1.3200
Achnatherum sibiricum6.09 ± 3.12000
Cleistogenes squarrosa1.61 ± 0.090.43 ± 0.4300
CompositaeArtemisia frigida0.42 ± 0.421.65 ± 0.951.12 ± 1.120
Serratula centauroides1.74 ± 0.921.85 ± 1.851.39 ± 1.390
Lactuca sativa001.66 ± 1.660
Artemisia tanacetifolia2.25 ± 1.242.54 ± 1.322.71 ± 1.571.34 ± 1.34
Artemisia dracunculus0001.52 ± 1.52
Heteropappus altaicus0001.14 ± 1.14
RosaceaePotentilla tanacetifolia0.87 ± 0.8703.08 ± 0.851.33 ± 1.33
Potentilla acaulis0.21 ± 0.21000
Potentilla bifurca1.99 ± 0.282.29 ± 1.301.38 ± 1.381.98 ± 1.98
LeguminosaeVicia amoena7.30 ± 1.371.15 ± 1.151.25 ± 1.252.88 ± 2.88
Thermopsis lanceolata0.96 ± 0.961.28 ± 1.280.88 ± 0.881.41 ± 1.41
Astragalus melilotoides4.35 ± 2.421.04 ± 1.041.23 ± 1.232.69 ± 1.36
GentianaceaeGentianopsis barbata0.91 ± 0.91000
Gentiana squarrosa0.94 ± 0.52000
Lomatogonium micranthum2.17 ± 0.11000
RanunculaceaeThalictrum squarrosum8.97 ± 4.8910.27 ± 2.595.33 ± 0.416.46 ± 1.20
Pulsatilla turczaninovii6.51 ± 4.083.12 ± 1.210.77 ± 0.770
UmbelliferaeBupleurum scorzonerifolium3.42 ± 0.293.97 ± 0.210.76 ± 0.763.14 ± 1.60
Saposhnikovia divaricata00.83 ± 0.8300
LiliaceaeAllium ramosum001.38 ± 1.380
Allium bidentatum0.48 ± 0.48000
Other familiesCarex duriuscula5.94 ± 1.665.13 ± 2.594.07 ± 2.193.19 ± 3.19
Adenophora stricta1.67 ± 1.672.55 ± 1.3601.84 ± 1.84
Dianthus chinensis0.81 ± 0.81000
Galium verum2.95 ± 0.266.57 ± 1.564.37 ± 0.505.46 ± 0.56
Linaria vulgaris01.29 ± 1.2900
Iris ventricosa0.84 ± 0.8401.52 ± 1.520
Schizonepeta multifida01.22 ± 1.2200
Dontostemon micranthus001.46 ± 1.460
Note: The data in the table are mean values and standard error values (p < 0.05, LSD test).
Disclaimer/Publisher’s Note: The statements, opinions and data contained in all publications are solely those of the individual author(s) and contributor(s) and not of MDPI and/or the editor(s). MDPI and/or the editor(s) disclaim responsibility for any injury to people or property resulting from any ideas, methods, instructions or products referred to in the content.

