Article

Selection of Non-Crop Plant Mixes Informed by Arthropod-Plant Network Analyses for Multiple Ecosystem Services Delivery Towards Ecological Intensification of Agriculture

1
Centre for Agroecology & Pollination Studies, University of Calcutta, Kolkata 700019, India
2
Department of Zoology, University of Calcutta, Kolkata 700019, India
3
Centre for Agroecology Water and Resilience, Coventry University, Coventry CV8 3LG, UK
*
Author to whom correspondence should be addressed.
Sustainability 2022, 14(3), 1903; https://doi.org/10.3390/su14031903
Submission received: 8 January 2022 / Revised: 28 January 2022 / Accepted: 29 January 2022 / Published: 7 February 2022
(This article belongs to the Special Issue Agro-Ecosystem Approaches for Sustainable Food Production)

Abstract

:
Ecological intensification (EI) of agriculture through the improvement of ecosystem service delivery has recently emerged as the alternative to the conventional intensification of agriculture that is widely considered unsustainable and has negative impacts on the environment. Although tropical agricultural landscapes are still heterogeneous, they are rapidly losing diversity due to agricultural intensification. Restoration of natural or semi-natural habitats, habitat diversity, and provision of multiple benefits have been identified as important targets for the transition to EI. Choosing the right plant mixes for the restoration of habitats that can offer multiple ecosystem service benefits is therefore crucial. The selection of candidate species for plant mixes is generally informed by studies focusing on a specific ecosystem service (e.g., pollination) and not based on the whole arthropod—non-crop plant interactions matrix. In this study, we try to identify non-crop plant mixes that would provide habitat for pollinators, act as refugia for natural pest predators, and also as a trap crop for potential crop pests by studying non-crop plants—arthropod interaction network. We have identified the non-crop plant species mixes by first identifying the connector species based on their centrality in the network and then by studying how their sequential exclusions affect the stability of the network.

1. Introduction

Although high external input (HEI) driven intensification of agriculture or the “Green Revolution agriculture” has been able to address the growing global demand for food by improving productivity, the unsustainability of this production system is now well established [1,2]. Among various negative impacts, agricultural intensification has emerged as one of the largest drivers of global biodiversity loss and threatens 86% of species facing extinction [3]. This massive loss of biodiversity also led to a degeneration of critical ecosystem services that underpin the agroecosystems [4,5].
An alternative food production paradigm that will be able to cater to our long-term food demand sustainably while keeping the ecological externalities at a minimum is an urgent challenge. Among the various alternatives that have been developed over the last few decades [6], ecological intensification (EI) has recently emerged as a major alternative [7,8]. EI minimises negative environmental impacts on the agroecosystem while matching the yield levels of conventional intensive farms by integrating and improving the ecosystem service delivery through the restoration of biodiversity in agricultural landscapes that was conventionally intensified before [6,9].
Garibaldi et al. [8] has suggested ten major policy targets to facilitate the transition from conventional to ecological intensification. Apart from the policy target of synthetic input reduction, some of the defining targets include enhancement of above and below-ground diversity, maintenance and restoration of natural or semi-natural habitats, enhancement of habitat diversity, and the provision of multiple services. While an overall increase in non-crop wild plant diversity in the landscape will be the key to achieving these targets, the provision of multiple ecosystem services through such restoration is a key consideration. Restoration strategies must identify and choose candidate species that can provide multiple ecosystem services, including the regulating services, e.g., pollination and natural pest control.
The creation of wilderness areas and floral strips to support pollinators and pollination service has been part of the agricultural management policy in the Western temperate countries where the landscape had become more homogeneous [6,10,11]. The impacts of such habitat management on pollination service delivery are also well-reviewed [12,13,14]. However, there are various gaps in our understanding about how landscape and farm management can impact natural pest regulation [7], and literature on the impacts of natural habitat restoration for natural pest predators is still emerging [12,13,14,15].
In most parts of the tropics, the landscape is typically heterogeneous and still supports habitats for key regulatory service providers, like pollinators and natural enemies [16]. However, such landscapes are fast disappearing due to pressure on land and the move towards conventional agricultural intensification [17,18]. Moreover, despite growing awareness, habitat creation is not part of the agricultural land management strategy in the tropics [19,20]. Small fragmented landholdings are a major obstacle to sparing land for habitat creation and pose additional hindrances [21,22]. Selection of candidate non-crop plant species for habitat creation that will provide multiple ecosystem service benefits in limited available space is therefore crucial for the tropics.
If the purpose of restoration is multiple ecosystem services, such restored habitats should not only attract pollinators and natural enemies but should be able to act as a sink or ‘trap’ for crop pests and thereby regulate their raiding the crop fields [23]. The principle of trap cropping has been in use in traditional subsistence tropical agriculture; however, its potential is largely under utilised [24,25]. We argue that in the multiple ecosystem service context, the stability of interactions with pollinators, natural enemies, and pests should be a determining criterion for selecting non-crop plant species. The candidate non-crop plant species should enhance the stability of the plant—pollinator and plant—natural pest regulator network and also the plant—pest network.
Network analyses can inform system-level understanding of various mutual and trophic interactions, roles, and nature of the association between participating species and can also predict the future vulnerability of the system [26]. Higher nestedness of a network signifies more resilience and stability of the system and indicates a greater number of interactions between specialist species with the species that form a subset of the generalist ones [27]. Different network metrics express different properties of the network, including the contribution and role of individual partner species (node) and therefore their relative importance in providing network stability. The more central the location of a species within a network, the more is its influence over other species at the periphery and therefore have control over the persistence of a network [28]. Centrality measures of species are indicative of such roles and, therefore, should be considered while selecting key species for habitat restoration. The inclusion of central plants as floral candidates in designed habitats would attract more arthropods towards the system, thereby contributing to facilitating ecosystem service delivery. We used this approach to identify the centrally important non-crop plant species that act as connectors and, therefore, connect many functional guilds/modules to the greater generalist core of the network. Among different centrality indices, betweenness centrality (BC) measures the importance of a species or node in linking different isolated hubs or modules or guilds of the networks [29]. Extinction of a connector species may cause secondary extinction of several specialised species due to their isolation from the generalist core and, therefore, affect whole network integrity. Hence, the fitness of central species is critical for the maintenance of the whole system and needs specific conservation efforts.
In this study, we tried to identify a suite of candidate non-crop plant species by identifying central non-crop plant species in the non-crop—arthropod network that connects pollinators, natural enemies, and pests, and thereby can strengthen the delivery of multiple ecosystem services by being a stable host for pollinators, natural enemies and also for pests (as ‘trap’).

2. Materials and Methods

2.1. Study Sites

The study area was located within semi-natural habitats surrounding an agricultural landscape (from 21°34’45.79” N, 86°36’4.42” E to 21°21’17.06” N, 86°48’35.34” E covering an area of about 728 km2) in the district of Balasore in an eastern Indian state of Odisha. The area was about 30 km away from the coastal zone of the state and situated within a mosaic of agricultural lands, homestead clusters, and other anthropogenic structures. This region had semi-evergreen and dry deciduous vegetation cover with typical tropical climatic conditions having an average annual temperature of 32 °C and about 1300 mm average annual rainfall [30].
We selected a total of 20 semi-natural habitat plots or study sites of 50 m × 50 m area. In each site, 50 m × 50 m area was divided into notional 10 m × 10 m grids; from which three 10 m × 10 m plots were selected randomly for survey [31]. Within each of the three 10 m × 10 m plots, three permanent 1 m × 1 m quadrats (i.e., nine quadrats (3 (1 m2) × 3) in each study site) were established randomly [31] and these 1 m2 were used for focal observation of arthropods and plants throughout the study period. The average distance between the sites was 10.68 ± 0.39 km and all the sites were similar with respect to altitude (74.3 ± 6.06 m above sea level). Our study sites were situated adjacent to the crop fields where different types of crops, such as vegetables (e.g., eggplant, Solanum melongena; chilli, Capsicum frutescens; cucumber, Cucumis sativus; tomato, Solanum lycopersicum; bitter gourd, Momordica charantia; mustard, Brassica juncea; pumpkin, Cucurbita maxima; pointed gourd, Trichosanthes dioica; okra, Abelmoschus esculentus, etc.), as well as cereals (e.g., rice paddy, Oryza sativa; maize, Zea mays, etc.), were cultivated throughout the year. Besides crop fields, there were human habitations and man-made structures existing within the landscape. Non-crop plant species within the study sites grew completely naturally, but to some extent were exposed to disturbance by human activities. The study was conducted during the peak blooming period of the non-crops (August 2014 to January 2015) with the expectation of encountering frequent interactions of arthropods with flowering plants.

2.2. Focal Observations of Plant—Arthropod Interactions

Observations of bees, arthropod natural enemies, and potential insect pests were carried out in all 1 m2 quadrats at each study site. Observation in each study site was replicated three times, with an interval of 22 days. In each site, a 10 min observation session was conducted in each of the nine 1 m2 quadrats from 0700 h to 1500 h (i.e., total 24 h (8 h × 3-day replicates) of observation/quadrat/site, and a total of 480 h for all the 20 study sites). Between two consecutive 10 min observation sessions, a 15 min interval was taken. Bees were recorded only when they touched the floral reproductive parts of non-crops present within the quadrats. Natural enemies were recorded when they were found searching for, capturing, or parasitizing prey species on non-crop plants. Pests were counted only when they were found actively feeding within the focal quadrats. In all the cases, respective non-crop plant species were also recorded for further analyses of specific interactions.
Unidentified arthropods were captured with a sweep net or forceps or vials and stored in 70% alcohol for further identification [32]. All the arthropods were identified at the finest taxonomic resolution possible using keys [33,34], otherwise, they were differentiated based on morpho-taxonomy. Unidentified non-crop plant species were photographed and collected as herbarium specimens for further identification.

2.3. Data Analyses

We pooled all the interactions between non-crops and arthropods across all the study sites. Interaction frequency of each bee, natural enemy, and pest species was calculated by averaging all the visits it made per non-crop plant species per 1 m2 throughout the total observation time spent for each of the non-crops. Most of the natural enemy and pest species could only be identified up to family or genus level and therefore, were assigned to distinct morphospecies based on morphological differences. The same method was applied to unidentified bee species. These morphospecies were considered as distinct species throughout our analyses.
An interaction network was formed separately between non-crop plants and three arthropod groups, as well as another ‘combined’ network was formed by combining all the interactions together. Constructions of all the networks and analyses of its respective metrics were performed in R software (version 4.0.3) [35] using the ‘Bipartite’ [36] and ‘Vegan’ [37] packages, and the graphical representation of multi-trophic ‘combined’ network was constructed using the Cytoscape 3.9.0 application (https://cytoscape.org/; accessed on 10 December 2021) which is an open-source software based on java. Interaction frequencies between non-crop plants and arthropods were used to calculate network metrics and to construct three separate network visualisations.
Network level nestedness analysis was carried out by NODF metric (with the help of ‘nestednodf’ function in R) that uses an algorithm based on the overlap and decreasing fill and corrects for the limitations such as the dependencies on size and shape of species interaction matrix [38]. NODF value varies between 0 (indicating perfectly non-nested network) to 100 (indicating complete nestedness). Network level specialisation (H2’) (by ‘H2fun’ function) and robustness to secondary species extinction (R) (by ‘second.extinct’ function) metrics were also calculated. H2’ is an index describing the level of ‘complementarity specialisation’ of an entire bipartite network [39]. The value of H2’ ranges from 0 (no specialisation) to 1 (perfectly specialised) [36]. Robustness to secondary extinction [40] describes the tolerance of a system to the species loss events. It ranges from 0 (most fragile system) to 1 (a stable system that would withstand species extinction events for a longer time) [41].
Further, a species level metric—the betweenness centrality (BC) index—was also calculated for the non-crop plant community in the ‘combined’ network. Betweenness centrality indicates the number of the shortest paths going through a particular species within a network. Species with BC > 0 indicates ‘connector species’ being linked to several less connected (or otherwise isolated) parts or hubs of the total network [29]. Connector species are important for maintaining the cohesiveness of the network [29]. As all the constructed matrices were weighted by interaction frequencies of arthropods, we recorded the value of weighted BC of each non-crop plant from the ‘combined’ network.
To understand the contribution of each connector non-crop species (of the ‘combined’ network) to the nestedness of each of the three individual networks (i.e., bees, natural enemies, and pests), we performed simulations of consecutive species’ extinction events. At first, each connector non-crop plant species was individually removed from each of the three networks, then the new nestedness (NODF) value was recorded and that particular plant species was reinserted within the network before the removal of the next connector plant species. We then calculated the change in the NODF value for the removal of each connector non-crop species from each of the three networks by subtracting the intact NODF value from the new NODF value. Therefore, if the result was negative, it would indicate the reduction in NODF after the removal of a particular connector non-crop and positive results would indicate the increase.

3. Results

During our study period, across all study sites, a total of 70 arthropod species (20 bee species, 33 natural enemies, and 17 potential crop pests) were observed interacting with 38 non-crop plant species (Table S1) from 32 genera under 19 families. Fabaceae was the most speciose family (7 species) followed by Lamiaceae (5 species), Acanthaceae (4 species), and Euphorbiaceae (3 species). Asteraceae, Malvaceae, Plantaginaceae, and Rubiaceae had two species each. The remaining families were represented by a single species each. Of the 38 non-crops, only 25 species were visited by bees, and 27 species were found in association with natural enemies; whereas pests were found only on 18 non-crop species. We encountered 20 bee species belonging to 3 families (Table S2), 33 species of arthropod natural enemies belonging to 20 families from 7 orders (Table S3), and 17 species of potential pests belonging to 12 families (excluding 4 unknown families) from 5 orders (Table S4).

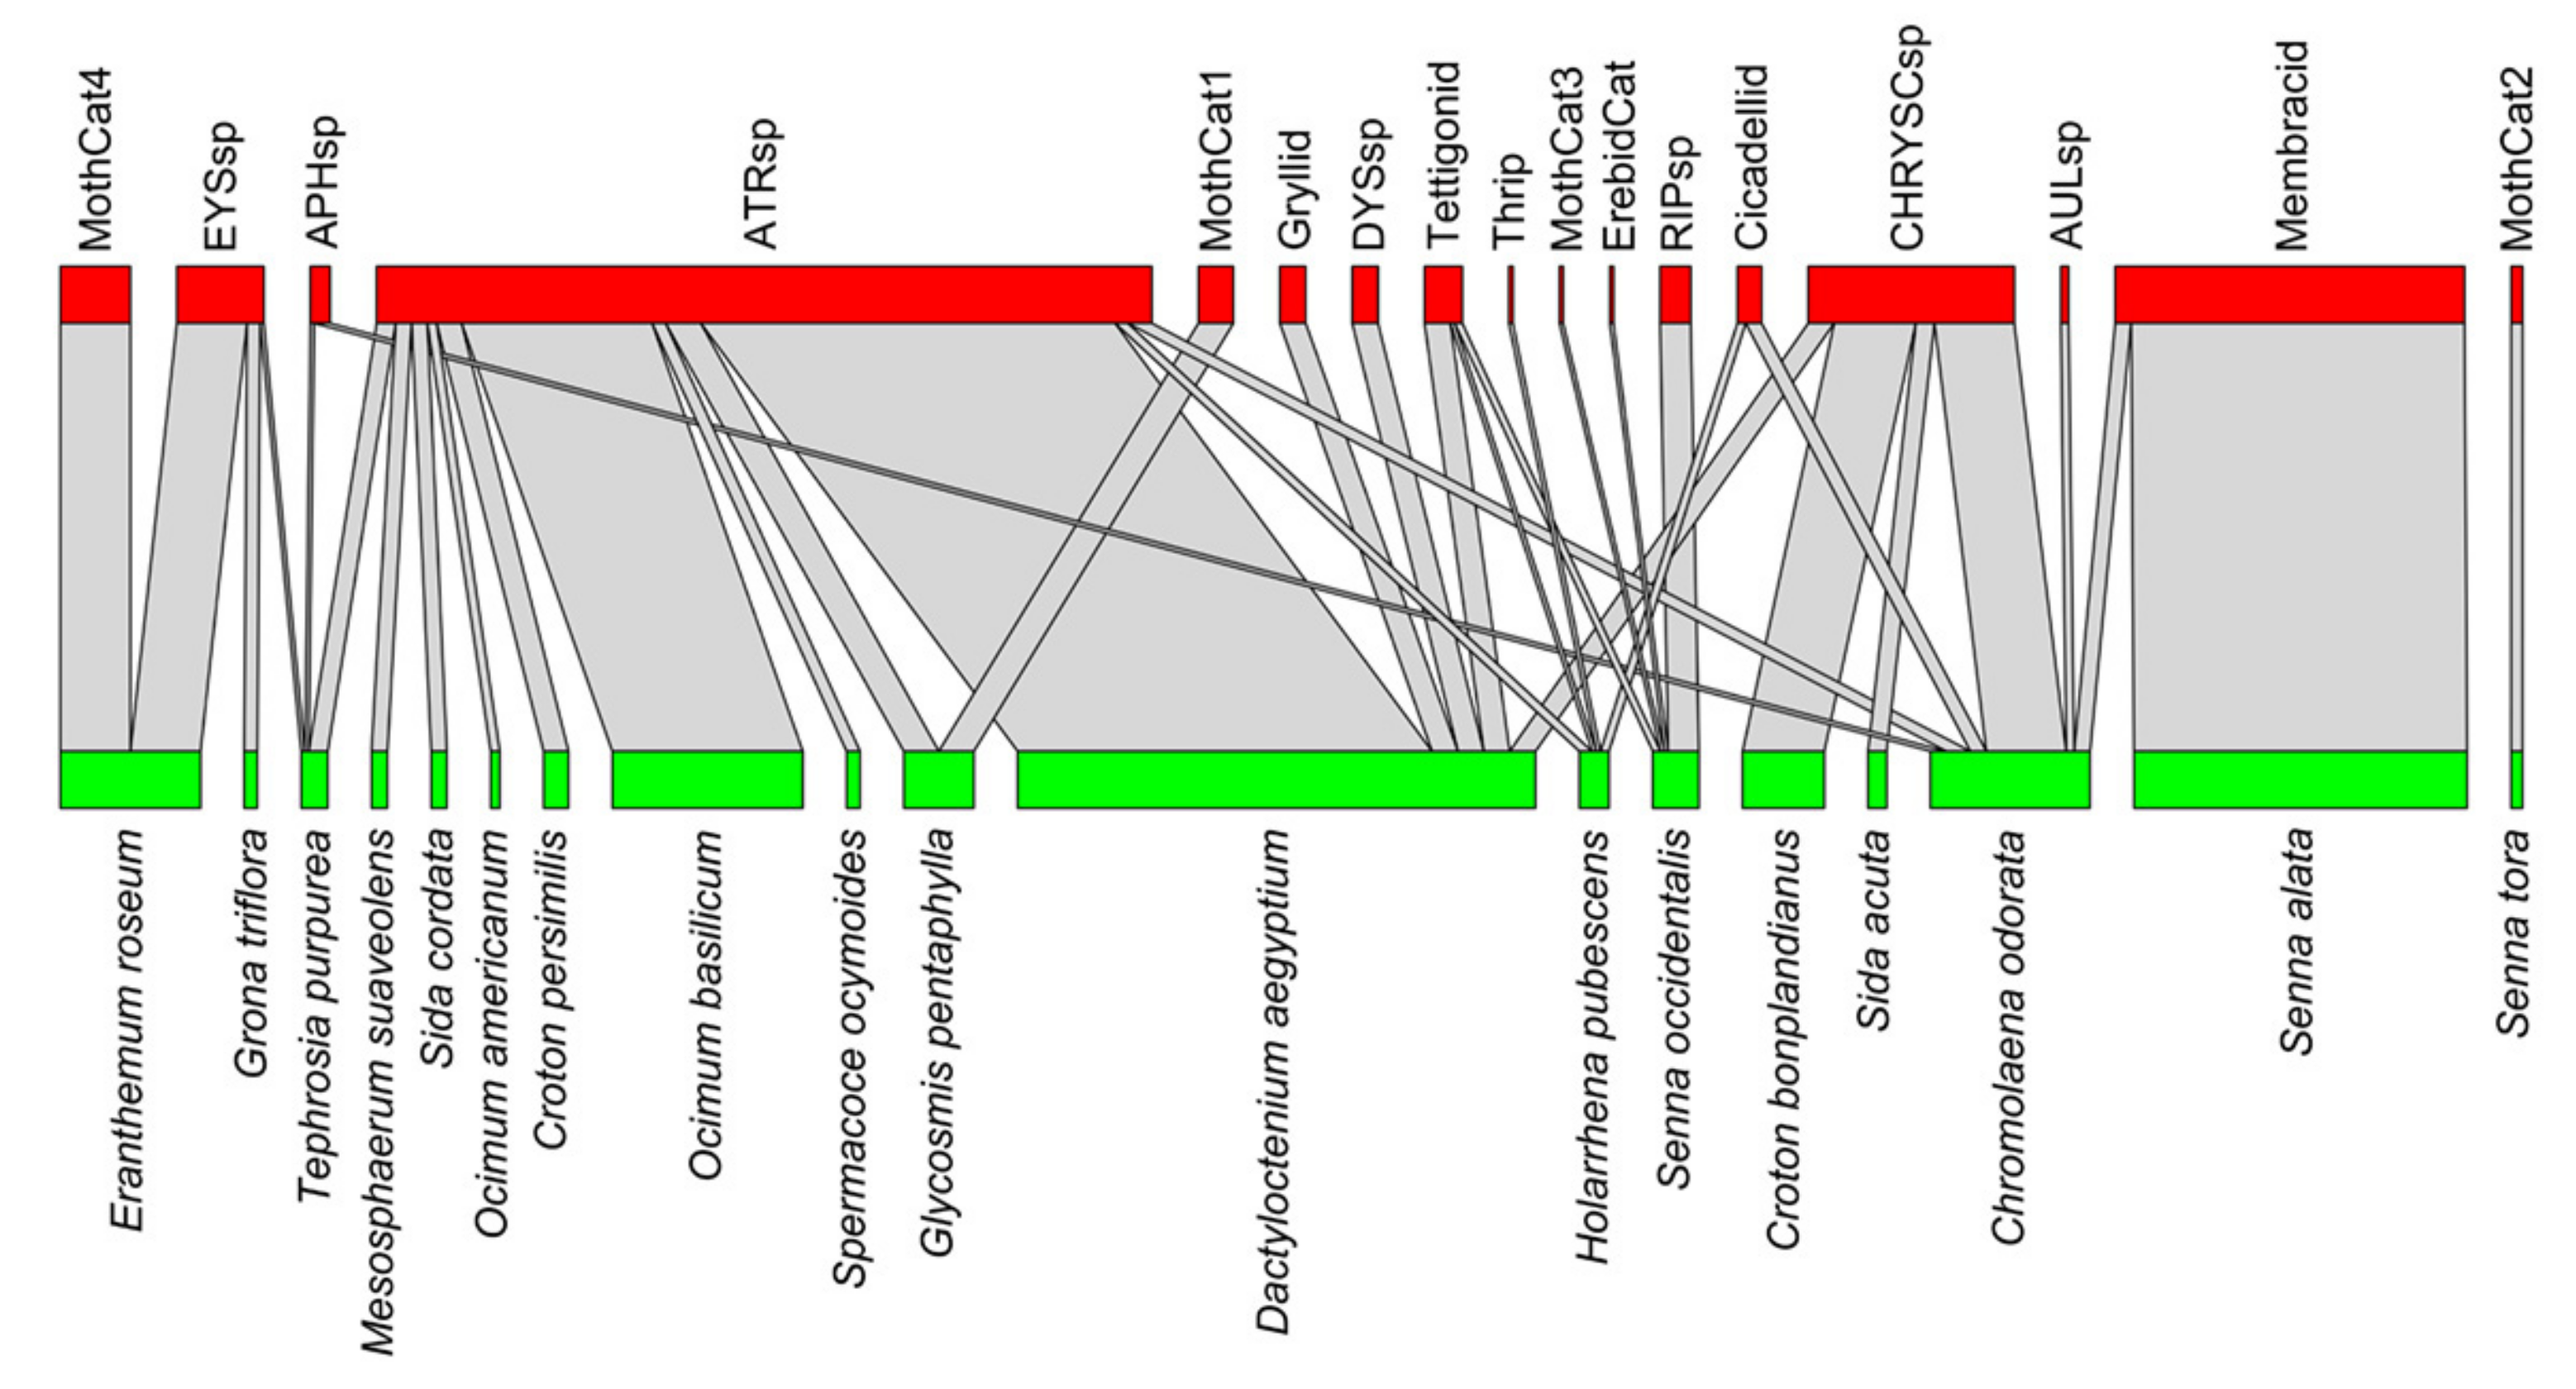
3.1. Comparison among Three Arthropod Communities Interacting with Non-Crop Plant Community

The natural enemy network was most nested (NODF = 10.572) followed by the bee (NODF = 6.838). The pest network was least nested (NODF = 5.029) (Figure 1, Figure 2, Figure 3 and Figure 4). The pest community exhibited a higher degree of specialisation (H2’ = 0.766) than the bee community (H2’ = 0.657) followed by natural enemies (H2’ = 0.587). The pest network also showed a lower level of robustness to secondary species extinction (R = 0.301) after random exclusion of plant species. On the other hand, bees (R = 0.462) and natural enemies (R = 0.507) exhibited higher robustness to secondary species loss.

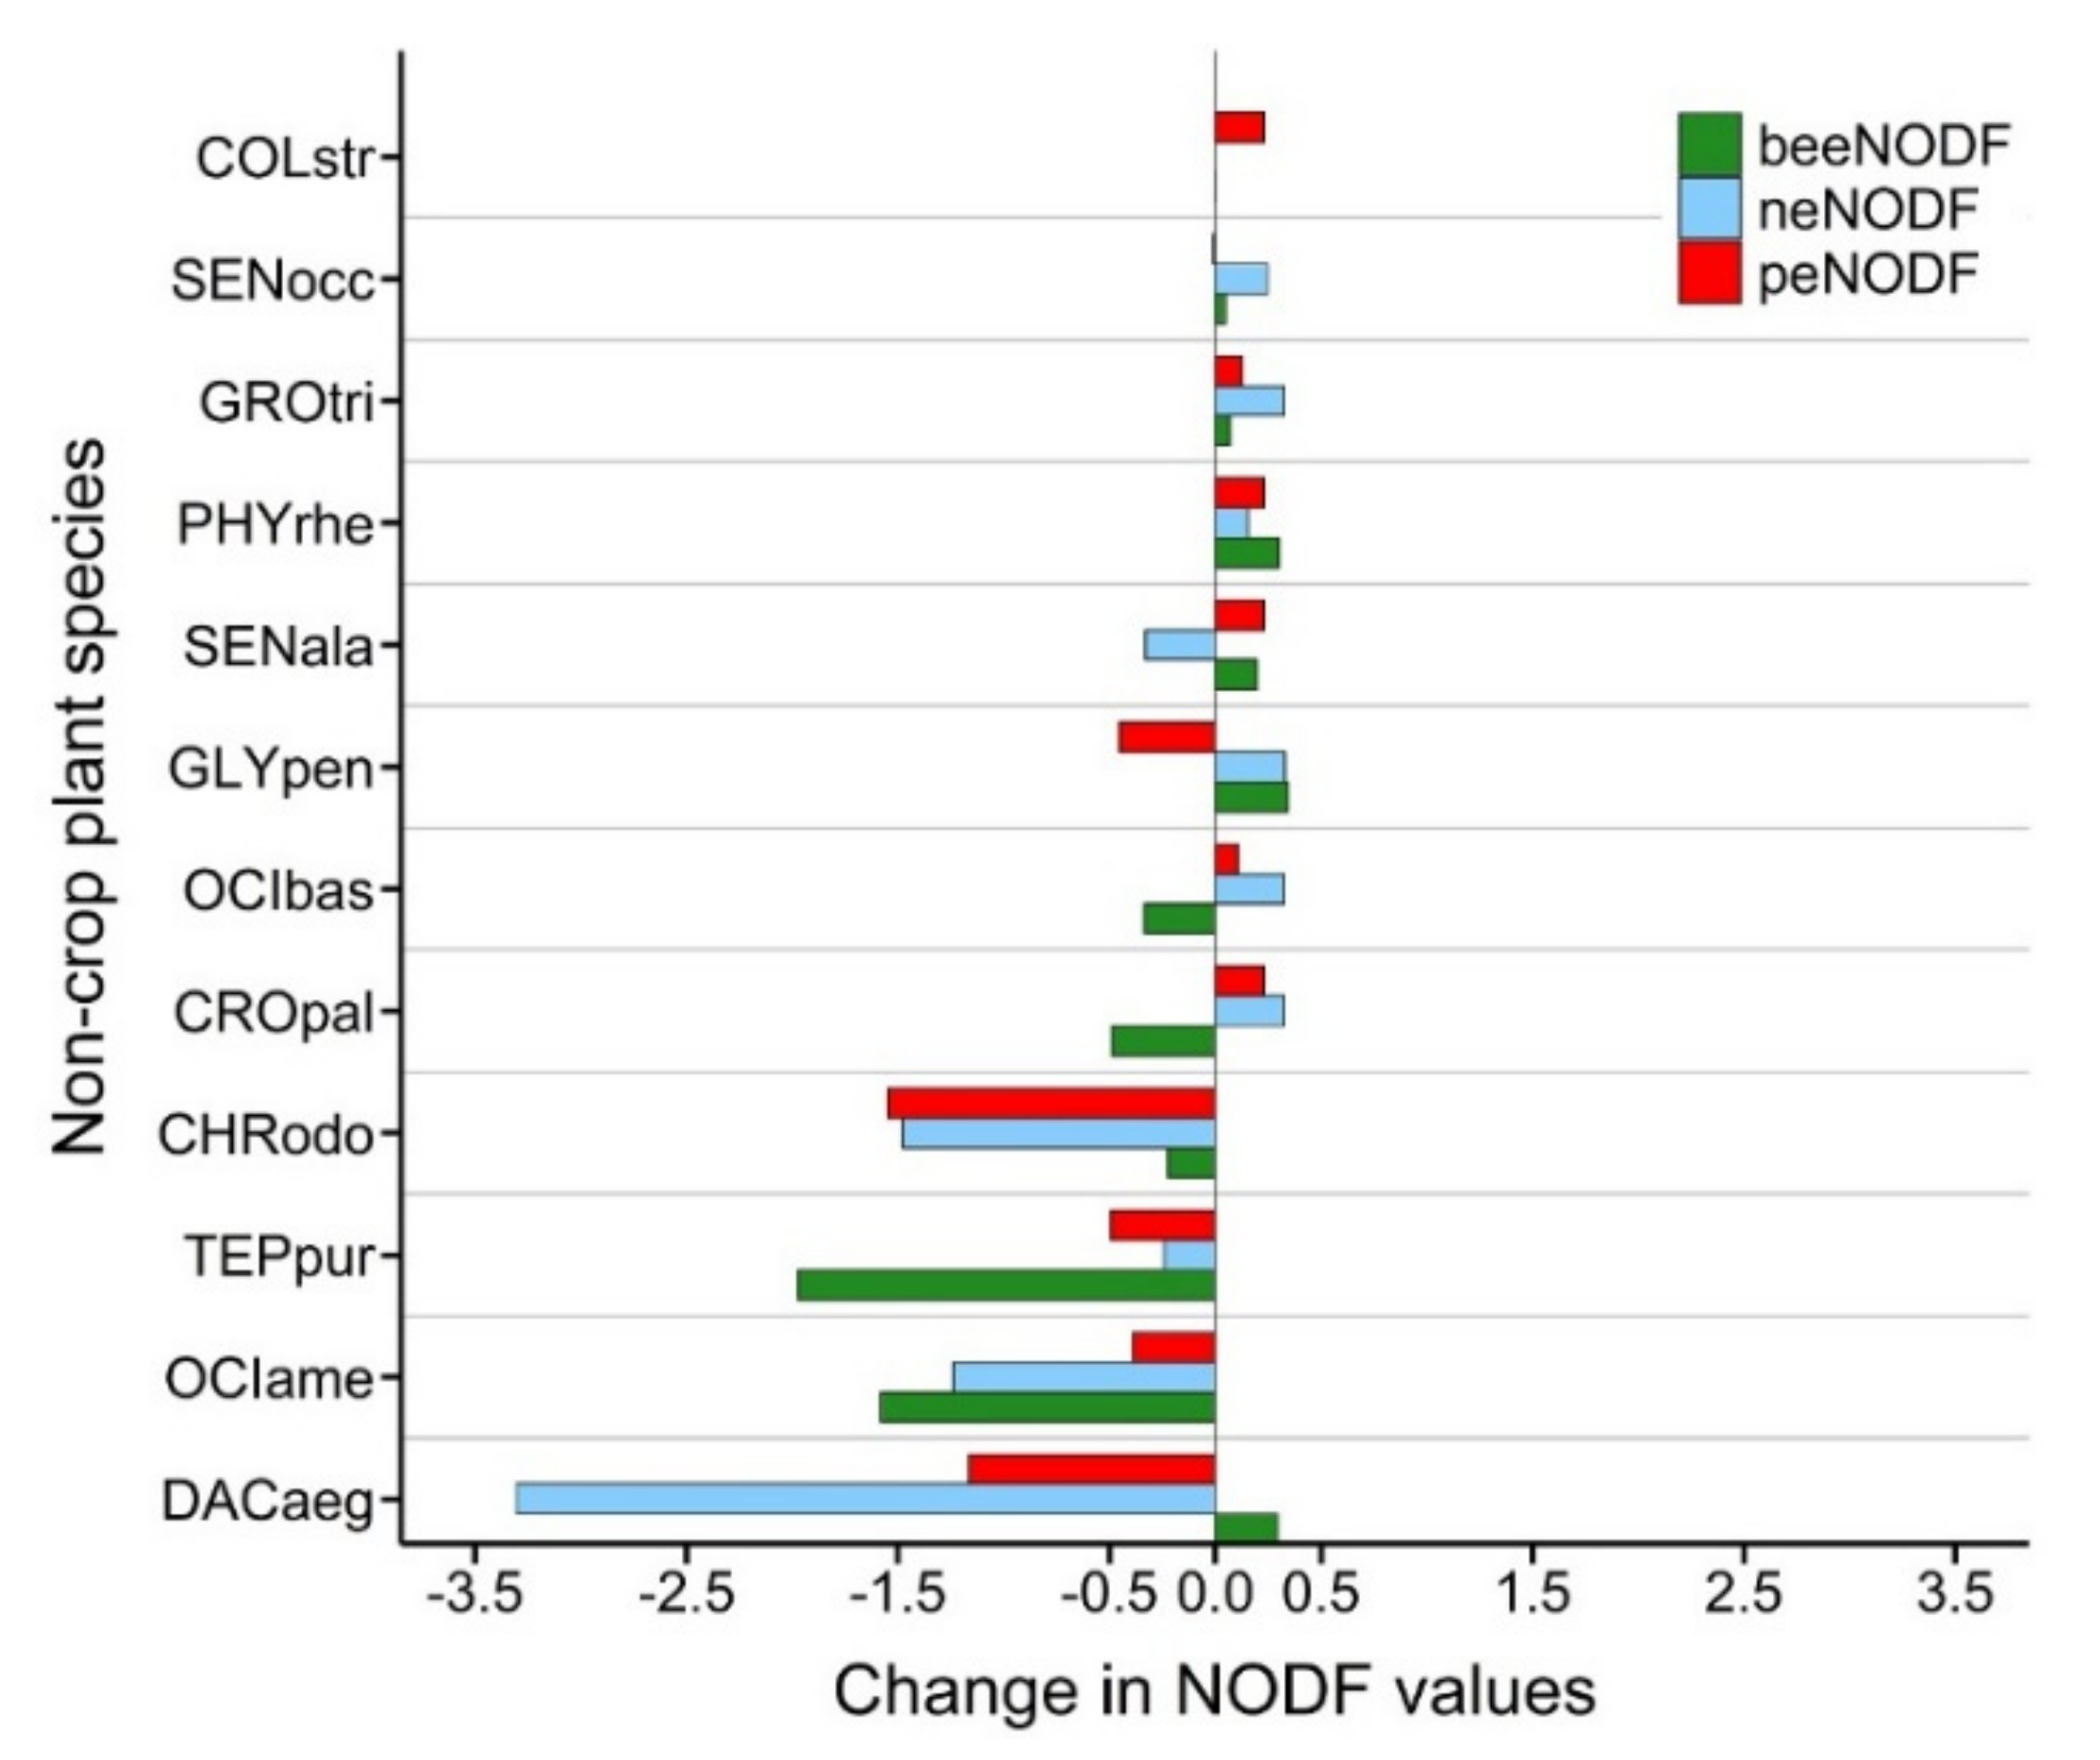
3.2. Contribution of Connector Non-Crop Species to the Nestedness of Networks

In the combined arthropod–non-crop network, a total of 12 non-crop species had positive weighted betweenness centrality (i.e., BC > 0) and hence, were considered as connector species. All the 38 non-crops and their respective BC values are listed in Table S5. Figure 5 shows the changes in the NODF values following the removal of each of the connector species sequentially from the network.
Consecutive removal of Ocimum americanum, Tephrosia purpurea, and Chromolaena odorata reduced the NODF of all the three (bee, natural enemy, and pest) networks. The exclusion of Dactyloctenium aegyptium from the system greatly decreased the NODF of the natural enemy network. This maximum drop in natural enemy’s NODF was observed after removal of C. odorata, O. americanum, Senna alata, and T. purpurea. The maximum drop in bee’s NODF was observed after the exclusion of T. purpurea which was followed by O. americanum, Crotalaria pallida, Ocimum basilicum, and C. odorata. Among the elimination of these five non-crops that caused bee’s NODF to decline, two of them, C. pallida and O. basilicum, had opposite effects on the NODF of the natural enemy and pest, causing these to increase to a lesser extent. Similarly, while the removal of D. aegyptium and S. alata caused a decrease in NODF of the natural enemy network, it increased the same for the bee network. For the pest network, the maximum drop in NODF was observed after the removal of C. odorata which was followed by D. aegyptium, T. purpurea, Glycosmis pentaphylla, and O. americanum. There were only two non-crops, Grona triflora, and Phyllanthus rheedei, whose virtual omission caused the NODF of the three arthropod groups to increase. On the other hand, the omission of Coleus strobilifer increased the pest NODF but had negligible influence on the other two groups, and the omission of Senna occidentalis increased both bee and natural enemy NODFs but had negligible influence on pests. Overall, the extent of positive increments in NODF following exclusion of a species was much lower.

4. Discussion

Selection of candidate species for natural or semi-natural habitat restoration for ecological intensification should be informed by how best the candidate species positively contribute to the provision of multiple ecosystem services and contribute to the stability of the overall arthropod (pollinator, natural enemies, and pest)–non-crop network. As our analyses show, a suite of three non-crop species e.g., Chromolaena odorata, Ocimum americanum, and Tephrosia purpurea are the best multi-functional candidate species for habitat restoration in our study area since they provide a stable association with pollinators, natural enemies as well as pests (and thereby act as pest trap plants) (Figure 6). These three multi-functional non-crop species provide a stable association with pollinators, natural enemies as well as pests and thereby can act as a sink for all of them. This choice turns out optimal since only one-third of the available non-crop species act as connector species and therefore, the entire non-crop and arthropod network is vulnerable to species extinction [29,42].
There is a wealth of literature on the impact of pollinator-friendly non-crop plants in sustaining a healthy pollinator population [13]. Although relatively lesser in number, there are emerging studies on the impact of field margin vegetation in sustaining natural enemies [43,44,45,46] in an agricultural landscape. On the other hand, although the potential of using ‘trap crop’ or companion plant in pest management has been suggested earlier [24,47,48], much still remains to be understood regarding optimal choice of candidate species for managing diverse pest management situations [49]. As our study shows, a habitat restored with the carefully selected candidate species using a network approach can act as a stable sink for crop pests. Such a stable crop pest sink will also draw natural enemy populations in such patches and therefore will lead to their overall increase in the crop landscape. We argue that creating a sink for pest populations in the non-crop habitats can be an effective strategy for strengthening natural enemy populations in the larger crop landscape. Natural enemies move between different food sources when their target prey (pest) population is low [50]. Therefore, during the crop fallow period, when their prey pest population is expected to be absent or lower, such habitats will provide resources for sustaining natural enemies in the landscape.
Apart from the above three non-crop species, Dactyloctenium aegyptium turned out as an important connector species for the natural enemy and pest networks in our study region. Its exclusion led to the maximum reduction in nestedness of the natural enemy network followed by the pest network, although it caused a slight improvement in the bee network; as it appears the species acts as a generalist in natural enemy and pest networks. Similarly, both Ocimum americanum and Tephrosia purpurea are important connectors for all three arthropod communities. However, these two species had a higher influence on bee communities than that on natural enemies and pests. Moreover, the omission of Chromolaena odorata also destabilised three networks with higher influences on natural enemy and pest communities. Comparing the effects, it could be said that C. odorata acts more as a generalist species for the pest network than D. aegyptium. On the other hand, the removal of Glycosmis pentaphylla improves the stability of both the beneficial groups, however, weakens pest communities. Omission of Senna alata declined the stability of natural enemy communities while improving the other two. Moreover, Crotalaria pallida and Ocimum basilicum destabilised the bee community but stabilised the other two groups. Therefore, these two plants also act as generalist species for the bees but with lesser influence on the network than that of O. americanum and T. purpurea.
Our results indicate that the pest association with our studied semi-natural habitats is most specialised and fragile and may disrupt easily due to any disturbance to their host plant community. Most antagonistic networks show partner-specific interactions and hence, are generally more specialised compared to the mutualistic networks [51,52,53]. This is also reflected in our results where the bee network in our study area appears to be more stable than the pests, but at the same time, more specialised compared to the natural enemy network. Bee—non-crop network stands somewhere in the middle in all the aspects of network ecology (e.g., stability, specialisation, and robustness); while the natural enemy network holds the position of the comparatively more stable and robust system in our studied landscape. Other studies also corroborate this dynamicity of network structural integrity across different communities of arthropods [52,54]. Herbivorous insect pests generally show highly specialised systems as mostly they rely on specific plant species for their food consumption [55]. On the other hand, parasitoids, such as wasps (e.g., members of family Ichneumonidae, Pompilidae, etc.), and flies (e.g., members of family Tachinidae, Syrphidae, etc.) need specific hosts for ovipositing, but they also need to forage on floral rewards to fulfil their nutritional requirements [56,57,58,59]. Some predatory arthropods may also switch between dual resource types, such as insect prey or floral rewards [58,60]. Hence, in general, arthropod natural enemies due to their versatility and generalised resource utilisation (i.e., highly nested network architecture) mostly display a highly stable and robust interaction matrix. To enhance biocontrol, habitat management strategies generally focus on specific requirements of natural enemies with respect to the availability of alternative food, alternative host, or prey, provisioning suitable shelter or refugia, and the spatial characteristics of the landscape that provide these requirements [15]. However, these strategies are more species-specific and are not informed by community-level species’ interaction networks. Studies comparing insect pollinator vs. non-crop plant networks within semi-natural habitats are rare; however, plant-pollinator networks in agricultural landscapes are commonly seen to be more specialised than nested [61,62].
As our results show only a smaller proportion, nearly one-third (31.58%), of the observed non-crop species acted as connectors in the entire network. It signifies that there were several nearly isolated hubs comprising a particular group of species that interacted with the whole network system through these connector species, and which is, perhaps, obvious as it was observed in other studies that the plant–pest antagonistic matrix exhibits highly modular structure [63]. Apart from the pests, beneficials, too, may form modules depending on their foraging habits [64,65].
To improve the stability of pollinator populations, Crotalaria pallida, and Ocimum basilicum would be the recommended species and for natural enemy populations, Senna alata would be the recommendation for our study area. Such species mixes can be taken up for planting on- or off-farm for maximising pollination or pest regulation.
Identification of key species in large interaction networks using different centrality indices can be an effective approach and has gained attention [28,29,66]. In a recent study, increased pollinator assemblages have been documented after the inclusion of central plant species in designed floral habitats [67]. Our results also corroborated the fact that centrally important plant species can potentially regulate the system stability [67,68,69] and therefore, are optimum candidates for habitat restoration. Network indices, such as nestedness and robustness, are important properties that signify the resilience of the system against environmental odds. Species’ roles in a network that helps encourage these properties are crucial for the system and hence, may be conserved. In the case of our study, low nestedness indicates the system vulnerability and probable higher number of specialised interactions. Therefore, conservation of the key connector plants may help maintain the dynamicity of interactions, thereby positively influencing the system stability [28,70].

5. Conclusions

Future studies need to assess various species-specific requirements of the partner species that are influential and can potentially affect the structural integrity of the interacting systems. Further, as our study shows, identification of suitable candidate non-crop plant mixes that can offer multiple ecosystem services must be informed by predictive analyses of the overall arthropod–wild non-crop network in a given agricultural landscape [71]. More such studies in diverse agroecological settings will further the understanding of the right kind of heterogeneity and complexity of habitats in a degraded and conventionally intensified agricultural landscape.

Supplementary Materials

The following supporting information can be downloaded at: https://www.mdpi.com/article/10.3390/su14031903/s1, Table S1: List of non-crop plant species that were observed interacting with arthropods during our study period in our study sites. Tick marks (√) designate the presence of respective arthropod groups (bees, natural enemies and pests) on corresponding non-crop species; Table S2: List of observed bee species and their respective families; Table S3: List of observed natural enemy species with their respective orders and families; Table S4: List of observed pest species with their respective orders and families; Table S5: Weighted betweenness centrality (BC) values of all the non-crop plant species which were observed interacting with pollinators, natural enemies and pests during our study period. The species with BC > 0 are termed as ‘connector species’ and are marked with asterisk (*).

Author Contributions

All authors conceived and designed the study. S.L. carried out fieldwork; S.L., S.C. and P.B. carried out and contributed to data analyses; S.L. and P.B. wrote the manuscript. All authors have read and agreed to the published version of the manuscript.

Funding

This project was funded by the Darwin Initiative (project 19-024) and Council of Scientific & Industrial Research (sanction no. 09/028(0882)/2012-EMR-I, date 21 August 2012).

Institutional Review Board Statement

Studies not involving humans or non-mammalian animals are exempted from Internal Animal Ethics Committee (IAEC) clearance.

Informed Consent Statement

Not applicable.

Data Availability Statement

Not applicable.

Acknowledgments

We convey our heartfelt thanks to the farmer community and the local residents for their generosity and for allowing us to conduct our study in their lands. We also thank Debabrata Maity, Department of Botany, University of Calcutta, and Aditi Dutta for helping in the identification of plant and bee specimens, respectively.

Conflicts of Interest

The authors declare no conflict of interest.

References

  1. World Bank. World Development Report 2008: Agriculture for Development; The World Bank: Washington, DC, USA, 2007. [Google Scholar]
  2. Crossman, N.D.; Connor, J.D.; Bryan, B.A.; Summers, D.M.; Ginnivan, J. Reconfiguring an irrigation landscape to improve provision of ecosystem services. Ecol. Econ. 2010, 69, 1031–1042. [Google Scholar] [CrossRef]
  3. Bolwig, S.; Tanner, A.N.; Riemann, P.; Redlingshöfer, B.; Zhang, Y. Reducing Consumer Food Waste Using Green and Digital Technologies. Copenhagen and Nairobi; UNEP, D. Partnership (United Nations Environment Programme): Copenhagen, Denmark, 2021. [Google Scholar]
  4. Dainese, M.; Martin, E.A.; Aizen, M.A.; Albrecht, M.; Bartomeus, I.; Bommarco, R.; Carvalheiro, L.G.; Chaplin-Kramer, R.; Gagic, V.; Garibaldi, L.A.; et al. A global synthesis reveals biodiversity-mediated benefits for crop production. Sci. Adv. 2019, 5, eaax0121. [Google Scholar] [CrossRef] [PubMed] [Green Version]
  5. Raven, P.H.; Wagner, D.L. Agricultural intensification and climate change are rapidly decreasing insect biodiversity. Proc. Natl. Acad. Sci. USA 2021, 118, e2002548117. [Google Scholar] [CrossRef] [PubMed]
  6. Kovács-Hostyánszki, A.; Espíndola, A.; Vanbergen, A.J.; Settele, J.; Kremen, C.; Dicks, L.V. Ecological intensification to mitigate impacts of conventional intensive land use on pollinators and pollination. Ecol. Lett. 2017, 20, 673–689. [Google Scholar] [CrossRef] [PubMed] [Green Version]
  7. Bommarco, R.; Kleijn, D.; Potts, S.G. Ecological intensification: Harnessing ecosystem services for food security. Trends Ecol. Evol. 2013, 28, 230–238. [Google Scholar] [CrossRef]
  8. Garibaldi, L.A.; Pérez-Méndez, N.; Garratt, M.P.; Gemmill-Herren, B.; Miguez, F.E.; Dicks, L.V. Policies for ecological intensification of crop production. Trends Ecol. Evol. 2019, 34, 282–286. [Google Scholar] [CrossRef] [Green Version]
  9. Tittonell, P. Ecological intensification of agriculture—Sustainable by nature. Curr. Opin. Environ. Sustain. 2014, 8, 53–61. [Google Scholar] [CrossRef]
  10. Williams, N.M.; Ward, K.L.; Pope, N.; Isaacs, R.; Wilson, J.; May, E.A.; Ellis, J.; Daniels, J.; Pence, A.; Ullmann, K.; et al. Native wildflower plantings support wild bee abundance and diversity in agricultural landscapes across the United States. Ecol. Appl. 2015, 25, 2119–2131. [Google Scholar] [CrossRef] [Green Version]
  11. Nilsson, L.; Klatt, B.K.; Smith, H.G. Effects of Flower-Enriched Ecological Focus Areas on Functional Diversity Across Scales. Front. Ecol. Evol. 2021, 9, 288. [Google Scholar] [CrossRef]
  12. Holland, J.M.; Douma, J.C.; Crowley, L.; James, L.; Kor, L.; Stevenson, D.R.; Smith, B.M. Semi-natural habitats support biological control, pollination and soil conservation in Europe. A review. Agron. Sustain. Dev. 2017, 37, 31. [Google Scholar] [CrossRef] [Green Version]
  13. Albrecht, M.; Kleijn, D.; Williams, N.M.; Tschumi, M.; Blaauw, B.R.; Bommarco, R.; Campbell, A.J.; Dainese, M.; Drummond, F.A.; Entling, M.H.; et al. The effectiveness of flower strips and hedgerows on pest control, pollination services and crop yield: A quantitative synthesis. Ecol. Lett. 2020, 23, 1488–1498. [Google Scholar] [CrossRef]
  14. Montgomery, I.; Caruso, T.; Reid, N. Hedgerows as ecosystems: Service delivery, management, and restoration. Annu. Rev. Ecol. Evol. Syst. 2020, 51, 81–102. [Google Scholar] [CrossRef]
  15. Landis, D.A.; Wratten, S.D.; Gurr, G.M. Habitat management to conserve natural enemies of arthropod pests in agriculture. Annu. Rev. Entomol. 2000, 45, 175–201. [Google Scholar] [CrossRef]
  16. Zhou, W.; Lee, M.-B.; Goodale, E. The relationship between crop cover, crop heterogeneity and the diversity of herbaceous plants in uncultivated areas of a tropical agricultural landscape of southern China. Glob. Ecol. Conserv. 2018, 14, e00399. [Google Scholar] [CrossRef]
  17. DeFries, R.; Rosenzweig, C. Toward a whole-landscape approach for sustainable land use in the tropics. Proc. Natl. Acad. Sci. USA 2010, 107, 19627–19632. [Google Scholar] [CrossRef] [Green Version]
  18. Basu, P.; Parui, A.K.; Chatterjee, S.; Dutta, A.; Chakraborty, P.; Roberts, S.; Smith, B. Scale dependent drivers of wild bee diversity in tropical heterogeneous agricultural landscapes. Ecol. Evol. 2016, 6, 6983–6992. [Google Scholar] [CrossRef]
  19. Tscharntke, T.; Klein, A.M.; Kruess, A.; Steffan-Dewenter, I.; Thies, C. Landscape perspectives on agricultural intensification and biodiversity–ecosystem service management. Ecol. Lett. 2005, 8, 857–874. [Google Scholar] [CrossRef]
  20. Laha, S.; Chatterjee, S.; Das, A.; Smith, B.; Basu, P. Exploring the importance of floral resources and functional trait compatibility for maintaining bee fauna in tropical agricultural landscapes. J. Insect Conserv. 2020, 24, 431–443. [Google Scholar] [CrossRef]
  21. Hobbs, P.R.; Sayre, K.; Gupta, R. The role of conservation agriculture in sustainable agriculture. Philos. Trans. R. Soc. B Biol. Sci. 2008, 363, 543–555. [Google Scholar] [CrossRef]
  22. Tscharntke, T.; Clough, Y.; Wanger, T.C.; Jackson, L.; Motzke, I.; Perfecto, I.; Vandermeer, J.; Whitbread, A. Global food security, biodiversity conservation and the future of agricultural intensification. Biol. Conserv. 2012, 151, 53–59. [Google Scholar] [CrossRef]
  23. Parker, J.E.; Crowder, D.W.; Eigenbrode, S.D.; Snyder, W.E. Trap crop diversity enhances crop yield. Agric. Ecosyst. Environ. 2016, 232, 254–262. [Google Scholar] [CrossRef] [Green Version]
  24. Hokkanen, H.M. Trap cropping in pest management. Annu. Rev. Entomol. 1991, 36, 119–138. [Google Scholar] [CrossRef]
  25. Holden, M.H.; Ellner, S.P.; Lee, D.H.; Nyrop, J.P.; Sanderson, J.P. Designing an effective trap cropping strategy: The effects of attraction, retention and plant spatial distribution. J. Appl. Ecol. 2012, 49, 715–722. [Google Scholar] [CrossRef]
  26. Keyes, A.A.; McLaughlin, J.P.; Barner, A.K.; Dee, L.E. An ecological network approach to predict ecosystem service vulnerability to species losses. Nat. Commun. 2021, 12, 1586. [Google Scholar] [CrossRef]
  27. Bascompte, J.; Jordano, P.; Melian, C.J.; Olesen, J.M. The nested assembly of plant–animal mutualistic networks. Proc. Natl. Acad. Sci. USA 2003, 100, 9383–9387. [Google Scholar] [CrossRef] [Green Version]
  28. Cagua, E.F.; Wootton, K.L.; Stouffer, D.B. Keystoneness, centrality, and the structural controllability of ecological networks. J. Ecol. 2019, 107, 1779–1790. [Google Scholar] [CrossRef]
  29. González, A.M.M.; Dalsgaard, B.; Olesen, J.M. Centrality measures and the importance of generalist species in pollination networks. Ecol. Complex. 2010, 7, 36–43. [Google Scholar] [CrossRef]
  30. Mahapatra, N.; Marai, N.; Dhal, K.; Nayak, R.N.; Panigrahi, B.K.; Mallick, G.; Ranjit, M.; Kar, S.K.; Kerketta, A.S. Malaria outbreak in a non endemic tribal block of Balasore district, Orissa, India during summer season. Trop. Biomed. 2012, 29, 277–285. [Google Scholar]
  31. Sutherland, W.J. Ecological Census Techniques: A Handbook; Cambridge University Press: Cambridge, UK, 2006. [Google Scholar]
  32. Gullan, P.J.; Cranston, P.S. The Insects: An Outline of Entomology; Wiley: Hoboken, NJ, USA, 2014. [Google Scholar]
  33. Michener, C.D. The Bees of the World, 2nd ed.; Johns Hopkins University Press: Baltimore, MD, USA, 2007. [Google Scholar]
  34. Triplehorn, C.A.; Johnson, N.F.; Borror, D.J. Borror and DeLong’s Introduction to the Study of Insects; Brooks/Cole Publishing Company: Pacific Grove, CA, USA, 2005. [Google Scholar]
  35. R Development Core Team. R: A Language and Environment for Statistical Computing. Available online: https://www.r-project.org/ (accessed on 19 September 2019).
  36. Dormann, C.F.; Fruend, J.; Gruber, B.; Dormann, M.C. Package ‘Bipartite’. Version 2.14. Available online: https://cran.r-project.org/web/packages/lmtest/index.pdf (accessed on 20 September 2019).
  37. Oksanen, J.; Blanchet, F.G.; Kindt, R.; Legendre, P.; Minchin, P.R.; O’hara, R.B.; Simpson, G.L.; Solymos, P.; Stevens, M.H.; Wagner, H.; et al. Package ‘Vegan’. Community Ecology Package; 2013; Volume 2; pp. 1–295. [Google Scholar]
  38. Almeida-Neto, M.; Guimaraes, P.; Guimaraes, P.R., Jr.; Loyola, R.D.; Ulrich, W. A consistent metric for nestedness analysis in ecological systems: Reconciling concept and measurement. Oikos 2008, 117, 1227–1239. [Google Scholar] [CrossRef]
  39. Blüthgen, N.; Menzel, F.; Blüthgen, N. Measuring specialization in species interaction networks. BMC Ecol. 2006, 6, 9. [Google Scholar] [CrossRef] [Green Version]
  40. Memmott, J.; Waser, N.M.; Price, M.V. Tolerance of pollination networks to species extinctions. Proc. R. Soc. Lond. B Biol. Sci. 2004, 271, 2605–2611. [Google Scholar] [CrossRef] [PubMed]
  41. Burgos, E.; Ceva, H.; Perazzo, R.P.; Devoto, M.; Medan, D.; Zimmermann, M.; Delbue, A.M. Why nestedness in mutualistic networks? J. Theor. Biol. 2007, 249, 307–313. [Google Scholar] [CrossRef] [Green Version]
  42. Newman, M.E. Detecting community structure in networks. Eur. Phys. J. B 2004, 38, 321–330. [Google Scholar] [CrossRef]
  43. Haenke, S.; Scheid, B.; Schaefer, M.; Tscharntke, T.; Thies, C. Increasing syrphid fly diversity and density in sown flower strips within simple vs. complex landscapes. J. Appl. Ecol. 2009, 46, 1106–1114. [Google Scholar] [CrossRef]
  44. Balzan, M.V.; Bocci, G.; Moonen, A.C. Augmenting flower trait diversity in wildflower strips to optimise the conservation of arthropod functional groups for multiple agroecosystem services. J. Insect Conserv. 2014, 18, 713–728. [Google Scholar] [CrossRef]
  45. Mkenda, P.A.; Ndakidemi, P.A.; Stevenson, P.C.; Arnold, S.E.; Belmain, S.R.; Chidege, M.; Gurr, G.M. Field margin vegetation in tropical African bean systems harbours diverse natural enemies for biological pest control in adjacent crops. Sustainability 2019, 11, 6399. [Google Scholar] [CrossRef] [Green Version]
  46. Zytynska, S.E.; Eicher, M.; Fahle, R.; Weisser, W.W. Effect of flower identity and diversity on reducing aphid populations via natural enemy communities. Ecol. Evol. 2021, 11, 18434–18445. [Google Scholar] [CrossRef]
  47. Shelton, A.M.; Badenes-Perez, F.R. Concepts and applications of trap cropping in pest management. Annu. Rev. Entomol. 2006, 51, 285–308. [Google Scholar] [CrossRef] [Green Version]
  48. Isaacs, R.; Tuell, J.; Fiedler, A.; Gardiner, M.; Landis, D. Maximizing arthropod-mediated ecosystem services in agricultural landscapes: The role of native plants. Front. Ecol. Environ. 2009, 7, 196–203. [Google Scholar] [CrossRef] [Green Version]
  49. Sarkar, S.C.; Wang, E.; Wu, S.; Lei, Z. Application of Trap Cropping as Companion Plants for the Management of Agricultural Pests: A Review. Insects 2018, 9, 128. [Google Scholar] [CrossRef] [Green Version]
  50. Eubanks, M.D.; Denno, R.F. Health food versus fast food: The effects of prey quality and mobility on prey selection by a generalist predator and indirect interactions among prey species. Ecol. Entomol. 2000, 25, 140–146. [Google Scholar] [CrossRef]
  51. Lewinsohn, T.M.; Inácio Prado, P.; Jordano, P.; Bascompte, J.; Olesen, J.M. Structure in plant-animal interaction assemblages. Oikos 2006, 113, 174–184. [Google Scholar] [CrossRef] [Green Version]
  52. Fontaine, C.; Thébault, E.; Dajoz, I. Are insect pollinators more generalist than insect herbivores? Proc. R. Soc. Lond. B Biol. Sci. 2009, 276, 3027–3033. [Google Scholar] [CrossRef] [Green Version]
  53. Morrison, B.M.; Dirzo, R. Distinct responses of antagonistic and mutualistic networks to agricultural intensification. Ecology 2020, 101, e03116. [Google Scholar] [CrossRef]
  54. Pocock, M.J.; Evans, D.M.; Memmott, J. The robustness and restoration of a network of ecological networks. Science 2012, 335, 973–977. [Google Scholar] [CrossRef] [Green Version]
  55. Araújo, W.S.D. Global patterns in the structure and robustness of plant-herbivore networks. Front. Biogeogr. 2016, 8, e31053. [Google Scholar] [CrossRef] [Green Version]
  56. Robertson, C. Flowers and Insects: Lists of Visitors of Four Hundred and Fifty-Three Flowers; Science Press Printing Company: Lancaster, UK, 1929. [Google Scholar]
  57. Tooker, J.F.; Hauser, M.; Hanks, L.M. Floral host plants of Syrphidae and Tachinidae (Diptera) of central Illinois. Ann. Entomol. Soc. Am. 2006, 99, 96–112. [Google Scholar] [CrossRef]
  58. Campbell, J.W.; Kimmel, C.B.; Grodsky, S.M.; Smithers, C.; Daniels, J.C.; Ellis, J.D. Wildflower plantings harbor increased arthropod richness and abundance within agricultural areas in Florida (USA). Ecosphere 2019, 10, e02890. [Google Scholar] [CrossRef]
  59. Zemenick, A.T.; Kula, R.R.; Russo, L.; Tooker, J. A network approach reveals parasitoid wasps to be generalized nectar foragers. Arthropod Plant Interact. 2019, 13, 239–251. [Google Scholar] [CrossRef]
  60. Lu, Z.X.; Zhu, P.Y.; Gurr, G.M.; Zheng, X.S.; Read, D.M.; Heong, K.L.; Yang, Y.J.; Xu, H.X. Mechanisms for flowering plants to benefit arthropod natural enemies of insect pests: Prospects for enhanced use in agriculture. Insect Sci. 2014, 21, 1–12. [Google Scholar] [CrossRef] [Green Version]
  61. Russo, L.; Debarros, N.; Yang, S.; Shea, K.; Mortensen, D. Supporting crop pollinators with floral resources: Network-based phenological matching. Ecol. Evol. 2013, 3, 3125–3140. [Google Scholar] [CrossRef] [PubMed]
  62. Moreira, E.F.; Boscolo, D.; Viana, B.F. Spatial heterogeneity regulates plant-pollinator networks across multiple landscape scales. PLoS ONE 2015, 10, e0123628. [Google Scholar] [CrossRef] [PubMed] [Green Version]
  63. Thébault, E.; Fontaine, C. Stability of ecological communities and the architecture of mutualistic and trophic networks. Science 2010, 329, 853–856. [Google Scholar] [CrossRef] [PubMed]
  64. Saunders, M.E.; Rader, R. Network modularity influences plant reproduction in a mosaic tropical agroecosystem. Proc. R. Soc. B 2019, 286, 20190296. [Google Scholar] [CrossRef]
  65. Borchardt, K.E.; Morales, C.L.; Aizen, M.A.; Toth, A.L. Plant–Pollinator conservation from the perspective of systems-ecology. Curr. Opin. Insect Sci. 2021, 47, 154–161. [Google Scholar] [CrossRef]
  66. Jordán, F.; Okey, T.A.; Bauer, B.; Libralato, S. Identifying important species: Linking structure and function in ecological networks. Ecol. Modell. 2008, 216, 75–80. [Google Scholar] [CrossRef]
  67. Maia, K.P.; Vaughan, I.P.; Memmott, J. Plant species roles in pollination networks: An experimental approach. Oikos 2019, 128, 1446–1457. [Google Scholar] [CrossRef]
  68. Chakraborty, P.; Chatterjee, S.; Smith, B.M.; Basu, P. Seasonal dynamics of plant pollinator networks in agricultural landscapes: How important is connector species identity in the network? Oecologia 2021, 196, 825–837. [Google Scholar] [CrossRef]
  69. Crespo, A.; Aguilar, J.M.; Pintado, K.; Tinoco, B.A. Key plant species to restore plant–hummingbird pollinator communities in the southern Andes of Ecuador. Restor. Ecol. 2021, 29, e13557. [Google Scholar] [CrossRef]
  70. Campbell, C.; Yang, S.; Shea, K.; Albert, R. Topology of plant–pollinator networks that are vulnerable to collapse from species extinction. Phys. Rev. E 2012, 86, 021924. [Google Scholar] [CrossRef] [Green Version]
  71. Windsor, F.M.; Tavella, J.; Rother, D.C.; Raimundo, R.L.; Devoto, M.; Guimarães, P.R., Jr.; Evans, D.M. Identifying plant mixes for multiple ecosystem service provision in agricultural systems using ecological networks. J. Appl. Ecol. 2021, 58, 2770–2782. [Google Scholar] [CrossRef]
Figure 1. Multi-trophic ‘combined’ non-crop plant–arthropod network found in the study area. Each circle/rectangular box represents each node, i.e., each interacting species (orange = bees, blue = arthropod natural enemies, red = potential herbivorous insect pests, and green = non-crop plants). The size of circular nodes represents the degree, i.e., the number of connected links to each node. Each link represents the presence of interaction. Each of the three networks was further displayed separately as bee vs. non-crop (top), natural enemy vs. non-crop (2nd from the top), and the potential pest vs. non-crop network (bottom). In these three separate networks, the width of links as well as the width of rectangular nodes represent the interaction frequencies between respective arthropod and plant species.
Sustainability 14 01903 g001
Figure 2. Visualisation of bipartite network graph between bee species (upper orange boxes or nodes) and non-crop plant species (lower green boxes or nodes). Connection links are representing the specific interactions between bees and corresponding non-crops. Thickness of the links represents the frequency of interaction between respective bee and plant species. AMEsp = Amegilla (Zonamegilla) sp., APIdor = Apis dorsata, BRAsp = Braunsapis sp., CERsp = Ceratina (Pithitis) sp., COEsp = Coelioxys sp., CURsp = Nomia (Curvinomia) sp., HALsp1 = Halictus sp.1, HALsp2 = Halictus sp. 2, HERsp = Heriades sp., HOMsp = Lasioglossum (Homalictus) sp., LASsp2 = Lasioglossum (Ctenonomia) sp. 2, LASsp5 = Lasioglossum (Ctenonomia) sp. 5, MEGbic = Megachile bicolor, MEGsp = Megachile sp., PSEsp = Pseudapis sp., STEsp = Steganomus sp., TETsp = Tetragonula sp., THYsp = Thyreus sp., XYLsp1 = Xylocopa sp. 1, XYLsp2 = Xylocopa sp.
Sustainability 14 01903 g002
Figure 3. Visualisation of bipartite network graph between natural enemy species (upper blue boxes or nodes) and non-crop plant species (lower green boxes or nodes). Connection links are representing the specific interactions between natural enemies and corresponding non-crops. Thickness of the links represents the frequency of interaction between respective natural enemy and plant species. Unidentified natural enemy species were designated by their respective families. ACIpal = Aciagrion pallidum, AGRlac = Agriocnemis lacteola, AGRpyg = Agriocnemis pygmaea, Asilid = Asilidae sp., BEMsp = Bembix sp., BRACsp = Brachymeria sp., CERcor = Ceriagrion coromandelianum, CHEsex = Cheilomenes sexmaculata, CHRsp = Chrysosoma sp., Chrysidid = Chrysididae sp., CoGrub = Coccinellidae grub, DELpyr = Delta pyriforme, DIPtri = Diplacodes trivialis, Evaniid = Evaniidae sp., Ichneu = Ichneumonidae sp., ISCrub = Ischnura rubilio, LESvir = Lestes viridulus, Lycosid = Lycosidae sp., MYRsp = Myrmarachne sp., NEUint = Neurothemis intermedia, ODOsp = Odontomantis sp., ORTpru = Orthetrum pruinosum, ORTsab = Orthetrum sabina, PEUvir = Peucetia viridans, PHIMsp = Phimenes sp., PHIvit = Phintella vittata, POLsp1 = Polistes sp. 1, POLsp2 = Polistes sp. 2, Pompilid = Pompilidae sp., SCEsp = Sceliphron sp., Sphecid = Sphecidae sp., SYCcol = Sycanus collaris, Tachinid = Tachinidae sp.
Sustainability 14 01903 g003
Figure 4. Visualisation of bipartite network graph between pest species (upper red boxes or nodes) and non-crop plant species (lower green boxes or nodes). Connection links are representing the specific interactions between pests and corresponding non-crops. The thickness of the links represents the frequency of interaction between respective pest and plant species. APHsp = Aphis sp., ATRsp = Atractomorpha sp., AULsp = Aulacophora sp., CHRYSCsp = Chrysocoris sp., Cicadellid = Cicadellidae sp., DYSsp = Dysdercus sp., ErebidCat = Erebidae caterpillar, EYSsp = Eysarcoris sp., Gryllid = Gryllidae sp., Membracid = Membracidae sp., MothCat1 = Moth caterpillar sp. 1, MothCat2 = Moth caterpillar sp. 2, MothCat3 = Moth caterpillar sp. 3, MothCat4 = Moth caterpillar sp. 4, RIPsp = Riptortus sp., Tettigonid = Tettigonidae sp. (Unidentified pests were designated by their respective families. Families for moth caterpillars (sp. 1 to sp. 4) and thrips could not be identified.).
Sustainability 14 01903 g004
Figure 5. Effects of removal of 12 connector species on NODF values of each of the three networks. The 12 non-crop plant species that acted as connectors in the ‘combined’ network were virtually removed from each of the three networks, consecutively. After removal of each of the 12 non-crops, changes in NODF values are shown in the diagram. Only the positive or negative changes in NODF are shown for each of the three networks (denoted by three different colours) along the horizontal axis following the removal of each of the 12 non-crops species.
Sustainability 14 01903 g005
Figure 6. Candidate non-crop plant mixes depending on their contributions to the stability of pollinator, natural enemy, and pest arthropod populations in our study area.
Sustainability 14 01903 g006
Publisher’s Note: MDPI stays neutral with regard to jurisdictional claims in published maps and institutional affiliations.

