Article

Green Roof Design with Engineered Extensive Substrates and Native Species to Evaluate Stormwater Runoff and Plant Establishment in a Neotropical Mountain Climate

Environmental Engineering Research Centre (CIIA), Department of Civil and Environmental Engineering, Universidad de los Andes, Bogotá 111711, Colombia
*
Author to whom correspondence should be addressed.
Sustainability 2020, 12(16), 6534; https://doi.org/10.3390/su12166534
Submission received: 24 June 2020 / Revised: 1 August 2020 / Accepted: 4 August 2020 / Published: 13 August 2020
(This article belongs to the Special Issue Urban Stormwater Management by Green Infrastructure)

Abstract

:
Green roofs are increasingly being implemented in cities for their multiple environmental benefits. Their optimal design requires an appropriate selection of components, including substrates and plant species, to ensure local sustainability in the long term. The present study seeks to assess the runoff quality and quantity of extensive green roofs located in Bogotá (Colombia). The assessment consists of testing different substrates, designed using locally available constituents and a selection of native species. The best performing substrate mixtures, in terms of runoff volume reduction and plant establishment, were jointly evaluated with three native species (i.e., Paepalanthus alpinus, Achryrocline bogotensis and Echeveria ballsii). On average, engineered substrates presented significantly lower concentrations in several water quality parameters (electric conductivity, total phosphorus, phosphates, Total Kjeldahl Nitrogen, nitrates, nitrites, color, biological oxygen demand and chemical oxygen demand) than the commercial extensive substrate used as control. The species Paepalanthus alpinus and Echeveria ballsii showed significant establishment and were considered potentially suitable species for green roofs in Bogotá. The obtained results, therefore, provide recommendations for green roof design in neotropical mountain climate conditions.

1. Introduction

Modern cities keep growing and developing in terms of population and sustainability. In 2030, 61% of the world’s population is expected to live in urban areas, while in Latin American countries, city dwellers should account for 89% of the population [1]. Rapid changes in population density are associated with increasing pollution, loss, fragmentation and reconversion of green spaces. Such impact on green spaces affects the connectivity of urban landscapes and also increases the frequency of flooding, due to the low infiltration rates [2,3]. Due to the growing need to manage the side effects of urbanization, green infrastructure like green roofs (GRs) are a suitable solution for urban stormwater management and native plant species conservation, as well as promoting valuable ecological interactions with pollinators [4,5,6].
Recent studies suggest that GR implementation should be considered a multi-objective solution [5,7,8,9], prioritizing the consideration of several criteria including stormwater retention, plant establishment, thermal benefits and runoff quality improvement. In order to achieve these objectives, further efforts should focus primarily on GR design (substrate composition, depth and plant species selection), considering the weather conditions and local availability of the materials that will serve as substrate components [5,10,11]. It is expected that substrate composition influences GRs environmental benefits, meaning that the accomplishment of one objective could mean the deterioration of another [12,13]. For instance, maximizing a GR’s plant diversity can cause a reduction in the stormwater retention potential [13]. Otherwise increasing a GR’s stormwater retention through the selection of certain components may compromise thermal benefits [7] or may cause deterioration in runoff quality [10]. Another criterion is substrate depth that has been associated with native species survival; for example, deeper and specifically designed substrates (>10 cm) can improve the establishment of native herbaceous plants without irrigation [14], however, increasing substrate depth can also diminish runoff quality [15]. Therefore, adequate substrate design and plant species selection is required to guarantee the fulfillment of different objectives.
It is necessary to include substrate materials that allow sufficient water holding capacity (WHC) (>20%) and adequate porosity (>10%) to ensure plant establishment, according to the minimum GR requirements established by the German Society of Research on Landscape Development and Landscape Construction (Forschungsgesellshcaft Landschaftsentwicklung und Landschaftsbau—FLL) [16]. When designing substrate composition, inorganic materials such as aggregates are normally used in higher volumetric proportions (80–90%) than organic amendments (10–20%) due to their light weight and physical properties that improve stormwater retention [5,7,8,10]. Regarding WHC and stormwater retention, several studies attributed better performance to deeper substrates [10]. Jim and Peng [7] recommended deeper substrates as well as lightweight materials (i.e., compost, perlite, vermiculite and calcined clay). However, others had previously concluded that particle size distribution could be a more significant factor [17]. An adequate selection of both inorganic and organic components must assure the appropriate physical and chemical properties of the substrate to maintain WHC and allow the establishment of vegetation cover, while mitigating runoff pollution.
Vegetation cover of extensive GRs is commonly composed of succulents, small herbs, grasses and mosses due to their overall suitability for shallow substrates and low water retention requirements. It is an important criterion that the selected species have different structural and functional characteristics to avoid allelopathy [18]. Species selection may differ between temperate and tropical climates [10,11,12]. Succulents such as Sedum species are widely used in temperate climates due to their hardiness, relatively shallow roots, water storage capacity and Crassulacean acid metabolism (CAM) photosynthesis, which minimizes water loss [4,19,20]. In tropical climates, native plants with different growth forms including ferns, grasses and vines, are used on GRs along with often non-native succulents [21,22]. Fai et al. [22] evaluated different species in Malaysia and found that native fern Nephrolepis biserrata outperformed other non-native succulent species, namely Sedum mexicanum, in terms of plant coverage and visual appearance when irrigation was provided.
However, in subtropical climates, research on GRs remains limited. Particularly for Bogotá it is important to review successful temperate and tropical case studies, since its climatic conditions are at a crossroads between these two climates due to its latitudinal and altitudinal situation.
As a result of emerging markets, many GR companies have been appearing in most South American countries, but despite recent research efforts, the understanding of GR performance and design under local conditions is still limited. Research on GRs has been carried out in Brazil, Colombia and Ecuador. In Brazil, the studies of Castiglia and Wilkinson [23,24] and Parizotto and Lamberts [25] assessed GRs’ thermal and hydrological performance using different substrates depths, whereas Noya et al. [26] focused on the relative capacity of different substrate compositions to maintain native herbaceous perennial and succulent species. In Ecuador, Jaramillo et al. [27] obtained a broad list of potential native plant species for GRs in Quito using a combined approach of habitat templates and climatic envelopes, recommending the grass (Eragrostis lucida), herbs (Plantago sericea) and shrubs (Lantana canescens). In Colombia, there have been some studies on quantity and quality performances and productive potentials of GRs [28,29,30], but few on native plant selection [31]. Specifically, in Colombia’s capital, Bogotá, which presents a neotropical mountain climate, GRs are becoming more and more common, and their use as part of sustainable construction initiatives is being encouraged by the local environmental authority [32]. Through the local guide of GRs and green walls (GWs) [32], constructors can find recommendations of native and non-native species that can thrive in rooftop conditions (i.e., orchids, succulents and ferns), and also recommended volumetric ratios of inorganic components (70–80%) and organic amendments (20–30%). However, the guide does not specify certain substrate mixtures for specific plant traits, which can be a source of relevant information of typical characteristics that are present in plants used in GRs [33,34].
Taking into account the importance of the design process of extensive GRs and the limited research on tropical climates, specifically in neotropical mountain environments, this study focused on three main goals: (i) Evaluate the stormwater retention efficiency of several aided GR designs using local components and native species; (ii) Analyze the GRs’ substrate composition capacity to mitigate runoff pollution; (iii) Identify native species with different growth forms that show complementarity and can successfully establish under the extensive GRs’ conditions without irrigation.

2. Materials and Methods

2.1. Study Site

Several experimental GR modular systems were set up on the rooftop of the Physics Department (5 stories high) of the Universidad de los Andes in Bogotá, Colombia (4°35′56″ N 74°04′51″ W; 2640 m.a.s.l.), where they evenly received permanent natural light. The local climate is characterized as a neotropical mountain, it has a mean annual temperature of 14.5 °C, and an annual rainfall that ranges between 600 and 1200 mm with a bimodal rainfall regime of two dry periods (December, January, February and July, August, September) and two rainy periods (March, April and October, November) during the year [35].

2.2. Experimental Setup

The experimental setup was divided into two phases. The first one consisted of fourteen different GR modular extensive substrates, and the second phase had four substrates selected from the first setup, each one with three replicates, for a total of twelve modular extensive GRs. The first setup was evaluated from November 2016 until February 2017. At this phase, twelve different extensive substrate mixtures (further described in Section 2.3.1) were developed and evaluated together with two commercial substrates (i.e., M1, M2, …, M14). One extensive commercial substrate, designed for shallow depths (<15 cm) and the other for deeper substrates (>15 cm), hence referred to here as intensive (Figure 1). The fourteen substrates were planted with three common species: Armeria maritima (Mill.), Festuca glauca Vill., and Gnaphalium antennarioides DC. The purpose of the setup was to preselect four substrates to make further evaluations on the following setup. The second setup was rearranged, using the three best performing substrates from the first setup and the best commercial substrate. Three replicates were made for each substrate. Each modular system was then planted with three native species (further described in Section 3.2) and was evaluated from March to August 2017 (Figure 1).
Each modular system was composed of two plastic recipients of 35 cm × 23 cm and 15 cm tall. One recipient held a filter fabric of 2 mm and a substrate layer of 10 cm that supported the selected species, and the other was used to collect the stormwater runoff (Appendix A). In the second experimental phase the same modular systems were used to hold the preselected substrates and the native species.
Weather data (i.e., rainfall depth, air temperature, relative humidity) were collected throughout the experimental period using a Davis weather station model Vantage Pro 2, in order to evaluate the effect of these variables on the GRs performance. Precipitation depth was measured using a tipping bucket rain gauge with a sampling rate of one second and a 0.2 mm resolution. Rainfall retention was measured as the percentage of the volume of water retained by the substrate layer and intercepted by the vegetated coverage, hence not converting into runoff. Therefore, each module was left to dry for 6 hr which was determined to be the time needed for the substrate to drain completely under our specific environmental conditions, as calculated recently by Ferrans et al. [28].

2.3. Substrate and Plant Selection

2.3.1. Substrate Composition

Twelve substrate mixtures were prepared by combining the recommended organic amendments and inorganic aggregates that were locally available, in volumetric ratios of 20% and 80%, respectively [5,7,8,10]. The organic compounds used were, namely, humic soil (So), compost (C), coco peat (CP) and rice husk (R). Organic compounds were used in different proportions within the mixtures (Table 1). Inorganic aggregates were differentiated according to their particle size as coarse, in this instance, coarse pumice (Pu) and expanded clay (EC), and fine, namely zeolite (Z), perlite (P) and sand (S). Aggregates were added in different ratios to the various mixtures (Table 1). Two additional, commercially available substrates were used as a reference to compare the performance of the twelve mixtures. The commercial extensive and intensive substrates had 27.4% and 15.9% of organic matter, respectively.

2.3.2. Substrate Physical Properties

Particle size of the inorganic aggregates presented the following ranges: Pu (4.8–9.5 mm), Z (1.2–2.4 mm), S (0.6–0.9 mm), EC (4.8–12.5 mm) and P (0.08–2.4 mm). Additionally the mixtures were evaluated to identify their feasibility in terms of weight, WHC and bulk density in both dry and water saturated conditions. Bulk density and WHC were calculated based on a sample of 100 cm3 following the guidelines of the FLL [16].

2.3.3. Substrate Preselection

Preselection was evaluated with common species because it was necessary to have some certainty of the development and performance of these growth forms, before asking for the collection permit that was demanded by the national environmental authority, in order to extract the native species. Two criteria were used to evaluate the mixtures: (i) stormwater runoff retention (evaluating 9 rainfall events, see Table A1), and (ii) plant establishment, measured in terms of appearance and growth rate. From November 2016 to February 2017, during the preselection phase, total precipitation was 690.4 mm, with November being the rainiest month (245.6 mm) and February the driest (121.2 mm). Mean temperature was 15.16 °C throughout this period (Appendix BFigure A2).
Appearance was determined based on the scale proposed by Monterusso et al. [36], in which 0 represents a dead plant and 5 accounts for a healthy plant. Relative growth rate was measured by calculating the ratio of the difference between the potential approximate volume (assuming a cylindrical shape of the plants by measuring the radius and height of each individual) at the end of the month and at the beginning, to the approximate volume at the beginning of that same month.

2.3.4. Common Plant Species

Three common species available at a local nursery were selected to evaluate plant establishment, after checking that none had an invasive tendency, in the sense of high seed production and effective dispersal [18] whilst not posing a threat to local environments. There was no allelopathy between the commercial species, thus, there was no competition among them. These species were partly chosen because they presented different growth forms, namely herb, turf and cushion, which are important in evaluating the differences in the establishment of each form and are normally used in gardens and GRs for their ornamental value. The selected species were: Armeria maritima, a Plumbaginaceae native to most of the northern hemisphere; Festuca glauca, a Poaceae native to Europe, which is often used on GRs in temperate areas; Gnaphalium antennarioides, a common Asteraceae native to the northern Andes (Figure 2).

2.3.5. Multicriteria Plant Trait Approach

Native plant species were selected using the multicriteria plant trait approach [34], following the methodology used by Van Mechelen et al. [33] that used information of 53 functional traits and 14 utilitarian aspects that were related to plant adaptation to GR conditions, to find the most frequent characteristics present on these species. This methodology was adapted to the local environmental conditions. A list of 176 different species was obtained by summing up the recommendations of five recent GR guidebooks and manuals that were considered suitable sources for this study case: (i) Green Roofs and Green Walls, Practical Guide, Secretaría de Ambiente de Bogotá [32]; (ii) Ecological gardening and green roofs [37]; (iii) Green Roofs in the Caribbean Region [38]; (iv) Plant catalogue for green roofs [39]; (v) Green Roofs and Green Walls Guide [40]. To filter the list, information on six exclusion criteria was filled out for each species, based on the methodology proposed by Van Mechelen et al. [33] and the recommendations of the local guide for GRs [32]. Exclusion criteria included the following: (i) root length >15 cm, (ii) life-form: trees, (iii) plant height >80 cm, (iv) little drought tolerance, (v) requirement of nutrient-rich and deep soils, (vi) plant elevation range not centered around 2640 m (Bogotá’s elevation). After filtering with the exclusion criteria, the list was reduced to 98 species. For those resulting species, information was completed using the Colombian plant catalogue [41] and Tropicos [42] search system, for nine functional and three utilitarian traits that were relevant for plant adaptation and for which information was possible to collect (Table 2). Five additional aspects relating plant adaptability to the specific zone of use were found to be relevant as these aspects define physical conditions that are important for plant establishment and were also included after revising the Bolaños and Moscoso [31] tool for native species selection for Green Infrastructure (GR and GW) in Colombia.

2.3.6. Selection Tool

Using the previous data on the functional and utilitarian traits of 98 species obtained from the consulted literature, a selection tool was developed in order to evaluate native species that might thrive under extensive GR conditions. The resulting evaluation system (Appendix C) was based on the tool developed by Bolaños and Moscoso [31]. Several categories were established for each trait and a score was attributed to each category according to their frequency, so that the most frequent category of each trait had the highest score [33].

2.3.7. Native Plant Species

To select potentially adequate native species to be tested, a list of 45 species was elaborated by gathering information from studies carried out by the José Celestino Mutis Botanical Garden in Bogotá [43,44], the Colombian plant catalogue [41], and further suggestions made by Peyre (pers. com.). To filter the list, some species were discarded by elevation range (not including 2600 m.a.s.l.), plant height (>60 cm) and risk of invasiveness, resulting in 11 species to be evaluated with the selection tool. The final selection identified the three species with the highest scores, and which were most representative of the growth forms of the commercial species used for the substrate preselection. The selected native species did not engage in allelopathy to eliminate neighboring plants and are species that favor their own establishment and survival by interacting with facilitators present in the soil (fungus, bacteria, etc.).
All plants were collected either in Bogotá or at the adjacent Páramo of Las Moyas (4°39′11″ N, 74°01′52″ W; 3141 m.a.s.l.), which is a little higher than Bogotá and presents common high-Andean grassland vegetation. Twelve mature individuals of each species were collected. One individual of each species was planted in each module and evaluated together with three replicates of the preselected substrates. According to local availability, collected individuals differed in their vegetative and reproductive conditions, which means that none of them had the same size and development state, presenting an initial variability for growth and appearance analysis.

2.4. Metrics for Substrate—Plant Evaluation

Performance of the native species and the preselected substrates was assessed based on the analysis of rainfall retention, plant establishment (appearance and growth) and water quality. Additional information of some of the physical properties (i.e., bulk density, WHC, weight) was already measured for these substrates in the previous phase.

2.4.1. Rainfall Retention

Retained volume was calculated as the difference between the effective rainfall volume and the runoff volume held by a plastic recipient located below each of the mixtures. Rainfall retention was measured for 17 independent events (Table A1) that generated runoff (in order to avoid considering very small events that would not surpass any substrate WHC). The rainfall events occurred between March and August 2017. In this period, the total precipitation depth was 646 mm, with March being the rainiest month (232.8 mm) and July the driest (37.6 mm). Mean temperature of these months was 15.18 °C (Appendix BFigure A2).

2.4.2. Water Quality Analysis

Water quality analyses carried out in a laboratory were performed for five rain events. Runoff samples were collected from the storage recipients located beneath the modular systems. Two additional rainfall samples, one from a rainfall collection recipient and the other the runoff from a plastic panel installed 5 m from the experimental setup and simulating a conventional roof, were collected and used as reference values to contrast the quality parameter results with those of the GR modular systems. Water quality parameters that were characterized in the laboratory, using a method proposed by Eaton [45], were: total phosphorus (TP), phosphates, Total Kjeldahl Nitrogen (TKN), nitrates, nitrites, ammonia, total suspended solids (TSS), turbidity, color, total coliform, biological oxygen demand (BOD) and chemical oxygen demand (COD). For rainfall events that generated at least 30 mL of runoff (least required module to use the probe), water quality parameters such as pH (10 events) and conductivity (12 events) were measured using portable probes.

2.4.3. Plant Species Test Procedures

Modular systems were evaluated weekly to determine the plant’s appearance and growth. Relative growth rate was determined as the percentage difference between plant volume or height at the end of each month and the initial conditions at the beginning of the same month. Approximate volume was measured assuming a cylindrical shape of the plants by measuring the radius and height of each individual. Appearance was again measured using the scale of Monterusso et al. [36].

2.5. Statistical Analysis

An analytic hierarchy process (AHP) was conducted for the preselection phase to evaluate and compare the performance of the engineered substrates. This evaluation was realized by formulating three scenarios regarding rainfall retention and plant establishment, (see monitored variables 1 and 3 in Figure 1): The first scenario gave the same weight to rainfall retention (0.5) and plant establishment (appearance: 0.4; relative growth: 0.1). The second scenario granted most of the relevance to the retention (0.6) followed by plant appearance (0.35) and relative growth (0.05). The third scenario granted a higher relevance to plant establishment (appearance: 0.4; relative growth: 0.15) than to rainfall retention (0.45).
In the second phase, Kruskal–Wallis (K–W) tests were used to determine the effect of the substrate type (i.e., M4, M5, M10 and M13) and rainfall event size on retention efficiency (monitored variable 1), as well as Ordinary Least Squares (OLS) linear regressions to identify the effect of the appearance and size of the plants on the retention efficiency of the GRs. To comply with homogeneity and normality, either Welch tests, ANOVA or K–W tests were used to find differences for each water quality parameter (monitored variable 4) between all substrates and size of rainfall events. In addition, relationships between plant appearance and plant size with water quality were evaluated through spearman correlations. Then plant appearance and relative growth rate (monitored variables 3) were both evaluated through ANOVA and K–W tests to find differences among substrates and species (this last particularly for appearance). Relationships between appearance and relative growth rate with temperature, precipitation and relative humidity were performed through spearman correlations. For some water quality parameters, data were transformed using the natural logarithm to ensure variance homogeneity. When significant differences were found, post-hoc pairwise tests were implemented. All statistical analyses were performed using STATA 15 software.

3. Results

3.1. Substrate Preselection

3.1.1. Physical Properties

Bulk density of the engineered substrates ranged between 0.28 and 0.62 g/cm3 under dry conditions and between 0.48 and 0.86 g/cm3 under saturated conditions (Table 3). Mixture 2 had the lowest WHC capacity with 25.8% and Mixture 5 presented the highest WHC of the engineered substrates with 66.8%, just below the commercial substrates, which presented WHCs of 68.4% and 86.4% for the intensive and extensive substrates, respectively.

3.1.2. Substrate Evaluation

The AHP analysis included information of rainfall retention, plant appearance and plant growth. In order to evaluate how sensitive the results were to changes in the weights given to the evaluating criteria, three scenarios were studied (see Section 2.5).
Mixtures 4 (So20:Pu40:EC10:S10:Z10:P10), 5 (CP20:Pu60:EC5:S5:Z5:P5) and 10 (C10:CP10:Pu40:EC10:S10:Z10:P10) were those within the engineered substrates that appeared repeatedly as the three best performing mixtures. M5 and M10 ranked first and second in every scenario, while M4 ranked third in scenarios no. 1 and 3 and tied second in scenario no. 2. The best engineered substrates (BES), were evaluated together with M13 (commercial extensive substrate) that was the fourth best substrate in scenarios no. 1 and 2 and the third best substrate in scenario no. 3 tied with M4. M13 was the best performing commercial substrate (CS) and was used as a control for the BES. All substrates were planted with native species and were evaluated during a 6 months period.

3.2. Species Selection

Using the 17 evaluating traits of the selection tool (Table 2), which scored the potential species from 0 to 72, 11 native species were selected (Table 4). According to the evaluation, Pernettya postrata (59), Echeveria ballsii (56) and Achyrocline bogotensis (54) obtained the three best scores, and each represented different growth forms as well as a diverse array of functional traits, as part of the experimental scope. However, it was decided that it would be better to change Pernettya postrata for Paepalanthus alpinus (52), because its turf growth form was more similar to Festuca glauca, the species used in the substrate preselection. The selected species were: Paepalanthus alpinus Körn. of the Eriocauleaceae family; Achyrocline bogotensis (Kunth.), an Asteraceae; Echeveria ballsii E. Walther. a Crassulaceae (Figure 3).

3.3. Substrate–Plant Evaluation

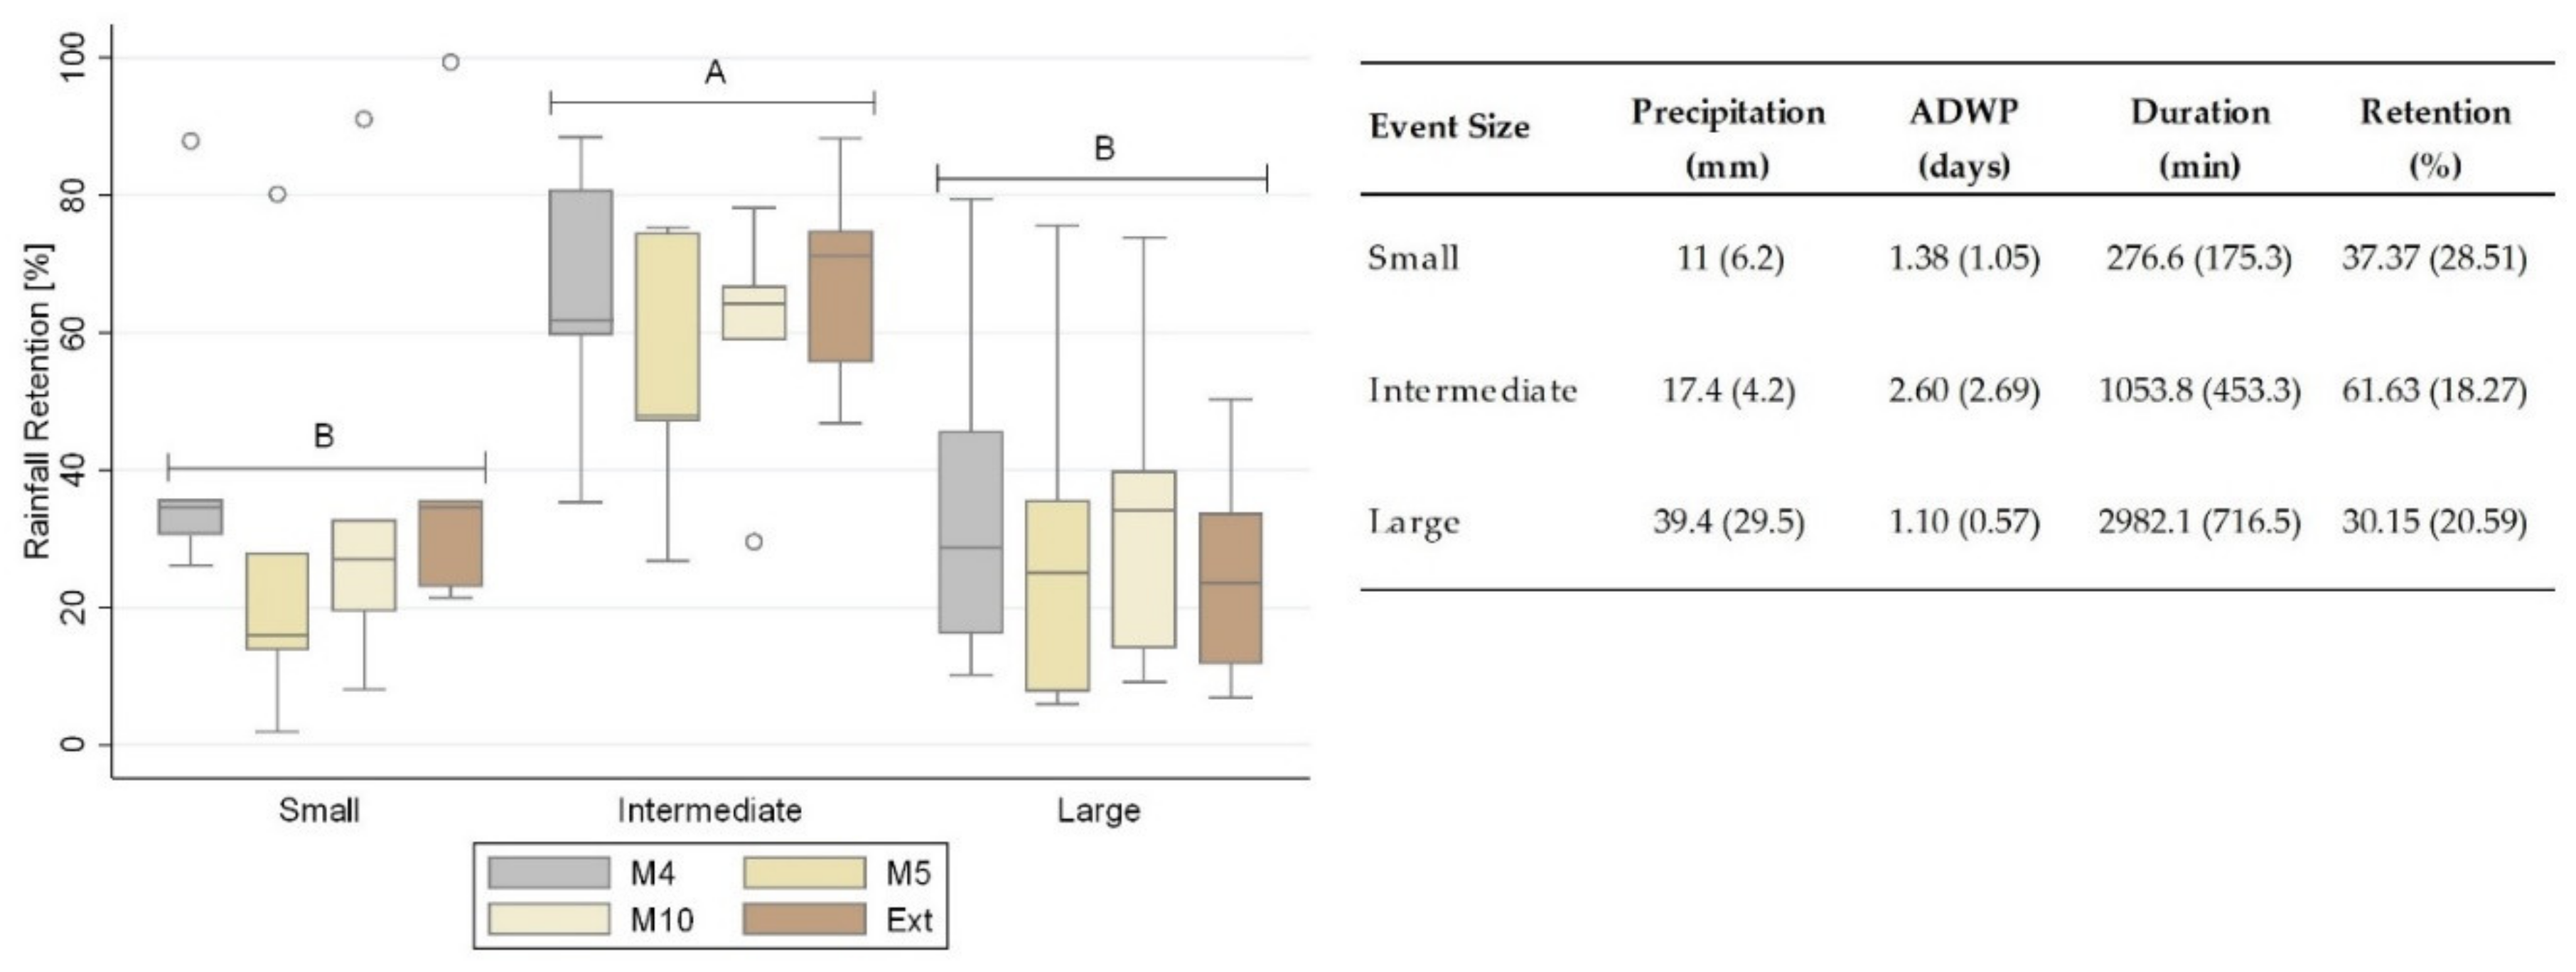
3.3.1. Rainfall Retention

Substrate and Event Size Effect

Results of rainfall retention efficiency were obtained based on the information of 17 rainfall events. Rainfall depth of the monitored events ranged from 3.2 to 84.6 mm. In 82% of those events, rainfall depth was above 10 mm. Rainfall events were categorized according to their size in small, intermediate and large, according to their characteristics of duration and depth (Figure 4). The mean retention (SD) for small, intermediate and large events, including all the substrates, was 37.37% (28.51%), 61.63% (18.27%) and 30.15% (20.59%), respectively. Regarding the substrate, mean retention values (SD), including all event sizes, were 46.38% (25.20%), 35.67% (26.88%), 41.38% (25.93%) and 42.71% (27.15%) for Mixtures 4, 5, 10 and the commercial extensive substrate, respectively. Figure 4 summarizes the behavior of rainfall retention, grouping data by substrate and event size. K–W test results showed that no statistically significant differences exist between substrates (p-value = 0.554) while event size does have a significant effect on retention (p-value = 0.000). Modular roofs presented a higher retention for intermediate events than for small and large events (p-value <0.01), since intermediate events are associated with longer antecedent dry weather period (ADWP), and for these events the substrate has more capacity to retain stormwater. Overall results of the multiple tests performed are presented in Table A3.

Species Effect

For each of the native species, linear regressions were performed in order to identify any effect of the plants’ appearance and size, and the substrate type, on the ability of the GRs to retain rainfall (Table A4). Regardless of the substrates where the plants were growing in, P. alpinus and E. ballsii showed a significant effect in terms of appearance on the retention efficiency (p-value < 0.01). This behavior shows that as the appearance of both plants improved, retention efficiency decreased. Otherwise, A. bogotensis did not show any effect on the retention efficiency (p-value = 0.096). The size of the three species was not found to be relevant for the retention efficiency of the modular GRs (p-value > 0.05).

3.3.2. Water Quality

Water quality parameters were measured for each substrate along with reference measurements to rainfall samples and to the runoff from a plastic tile representing a traditional roof. The mean values of the studied quality parameters for each substrate and the average of the two reference points (reference value) are summarized in Table A6.

Substrate and Event Size Effect

For assessing the substrate effect on water quality parameters, comparisons were established between either substrate types (i.e., M4, M5, M10 and M13) or substrate groups (i.e., BES and CS) and a reference value, in order to determine if GRs are a source of these parameters. Event size was also considered as a possible factor to explain differences in quality parameters (Table 5).
Conductivity and pH were significantly affected by the size of the event. Intermediate events showed a significantly higher pH than large events, while conductivity was significantly higher on large events compared to intermediate and small events. Conductivity was not statistically different between M4, M5 and M10 but showed significant differences among substrate groups. CS had higher mean conductivity than BES, and the latter had higher mean conductivity than reference points. In addition, there were significant differences in pH between BS (7.09), CS (8.05) and the reference value (7.36).
Physical parameters did not present differences amongst event size (TSS was not evaluated for event size effect since all the measured events were large), but they were significantly different between substrate groups. Mean sampled color was significantly higher in CS than in BES and reference values. For turbidity and TSS, mean values of CS and BES were significantly higher than in reference values.
For nitrogen parameters (i.e., TKN, NO2 and NO3), events size was not relevant and did not show significant differences, while substrate seems to appear as a source of nitrogen for most measured parameters (TKN, NO2 and NO3) for which CS had significant higher concentrations. For TKN, BES had also higher concentrations than reference value, however, for NO2 there were no differences among BES and reference points. For NO3, only runoff from M10 was not statistically different from the reference.
When evaluating phosphorus parameters, event size was not a significant factor. In contrast, substrate showed differences in concentrations. For TP, CS mean concentrations were significantly higher than those of M5 and M10 and these two were higher than concentrations of M4 and the reference value. When analyzing PO4, the same differences were found although for this parameter M4 concentration was also statistically higher than the reference value.
When evaluating organic matter parameters, event size was not found to be significant for COD. Otherwise, substrate group was significant for both DOB and COB, showing that CS’s have higher concentrations than BES, and the latter higher concentrations than the reference points. Event size effect was not analyzed for BOD, since all the measured events were large.
Total coliforms were also analyzed for both event size and substrate group factors. It was found that BES and CS presented significantly higher values than reference values. In terms of event size, differences were found between large events that presented higher values than intermediate events.

Species Effect

To test the species effect on the water quality parameters, spearman correlations between each species’ appearance and size, and each runoff quality parameter were tested at a 5% significance level. Effects were different across substrates and species. A. bogotensis’ appearance and size were positively correlated with NO2 concentrations when growing in substrates M4 and M10, with NO3 concentrations in M4, with conductivity in substrates M5, M10 and CS, and with turbidity, TKN and COD in CS. Otherwise A. bogotensis’ characteristics were negatively correlated with pH in M4 and color in M5.
E. ballsii characteristics were negatively correlated with conductivity when growing in CS. Plant appearance had a positive correlation with TSS in M4 and a negative correlation with turbidity, NO2 and TP in M10 and pH in M4. Meanwhile E. ballsii’s size, in terms of volume, was negatively correlated with EC, turbidity, TSS, TKN, PO4 and COD when planted in CS.
Both the appearance and volume of P. alpinus were negatively correlated with PO4 concentrations in M10 substrate, while only the appearance was negatively correlated with turbidity and TKN in M10 and M5, respectively. A positive correlation was also found between P. alpinus appearance, conductivity and pH in M10 and CS, respectively.

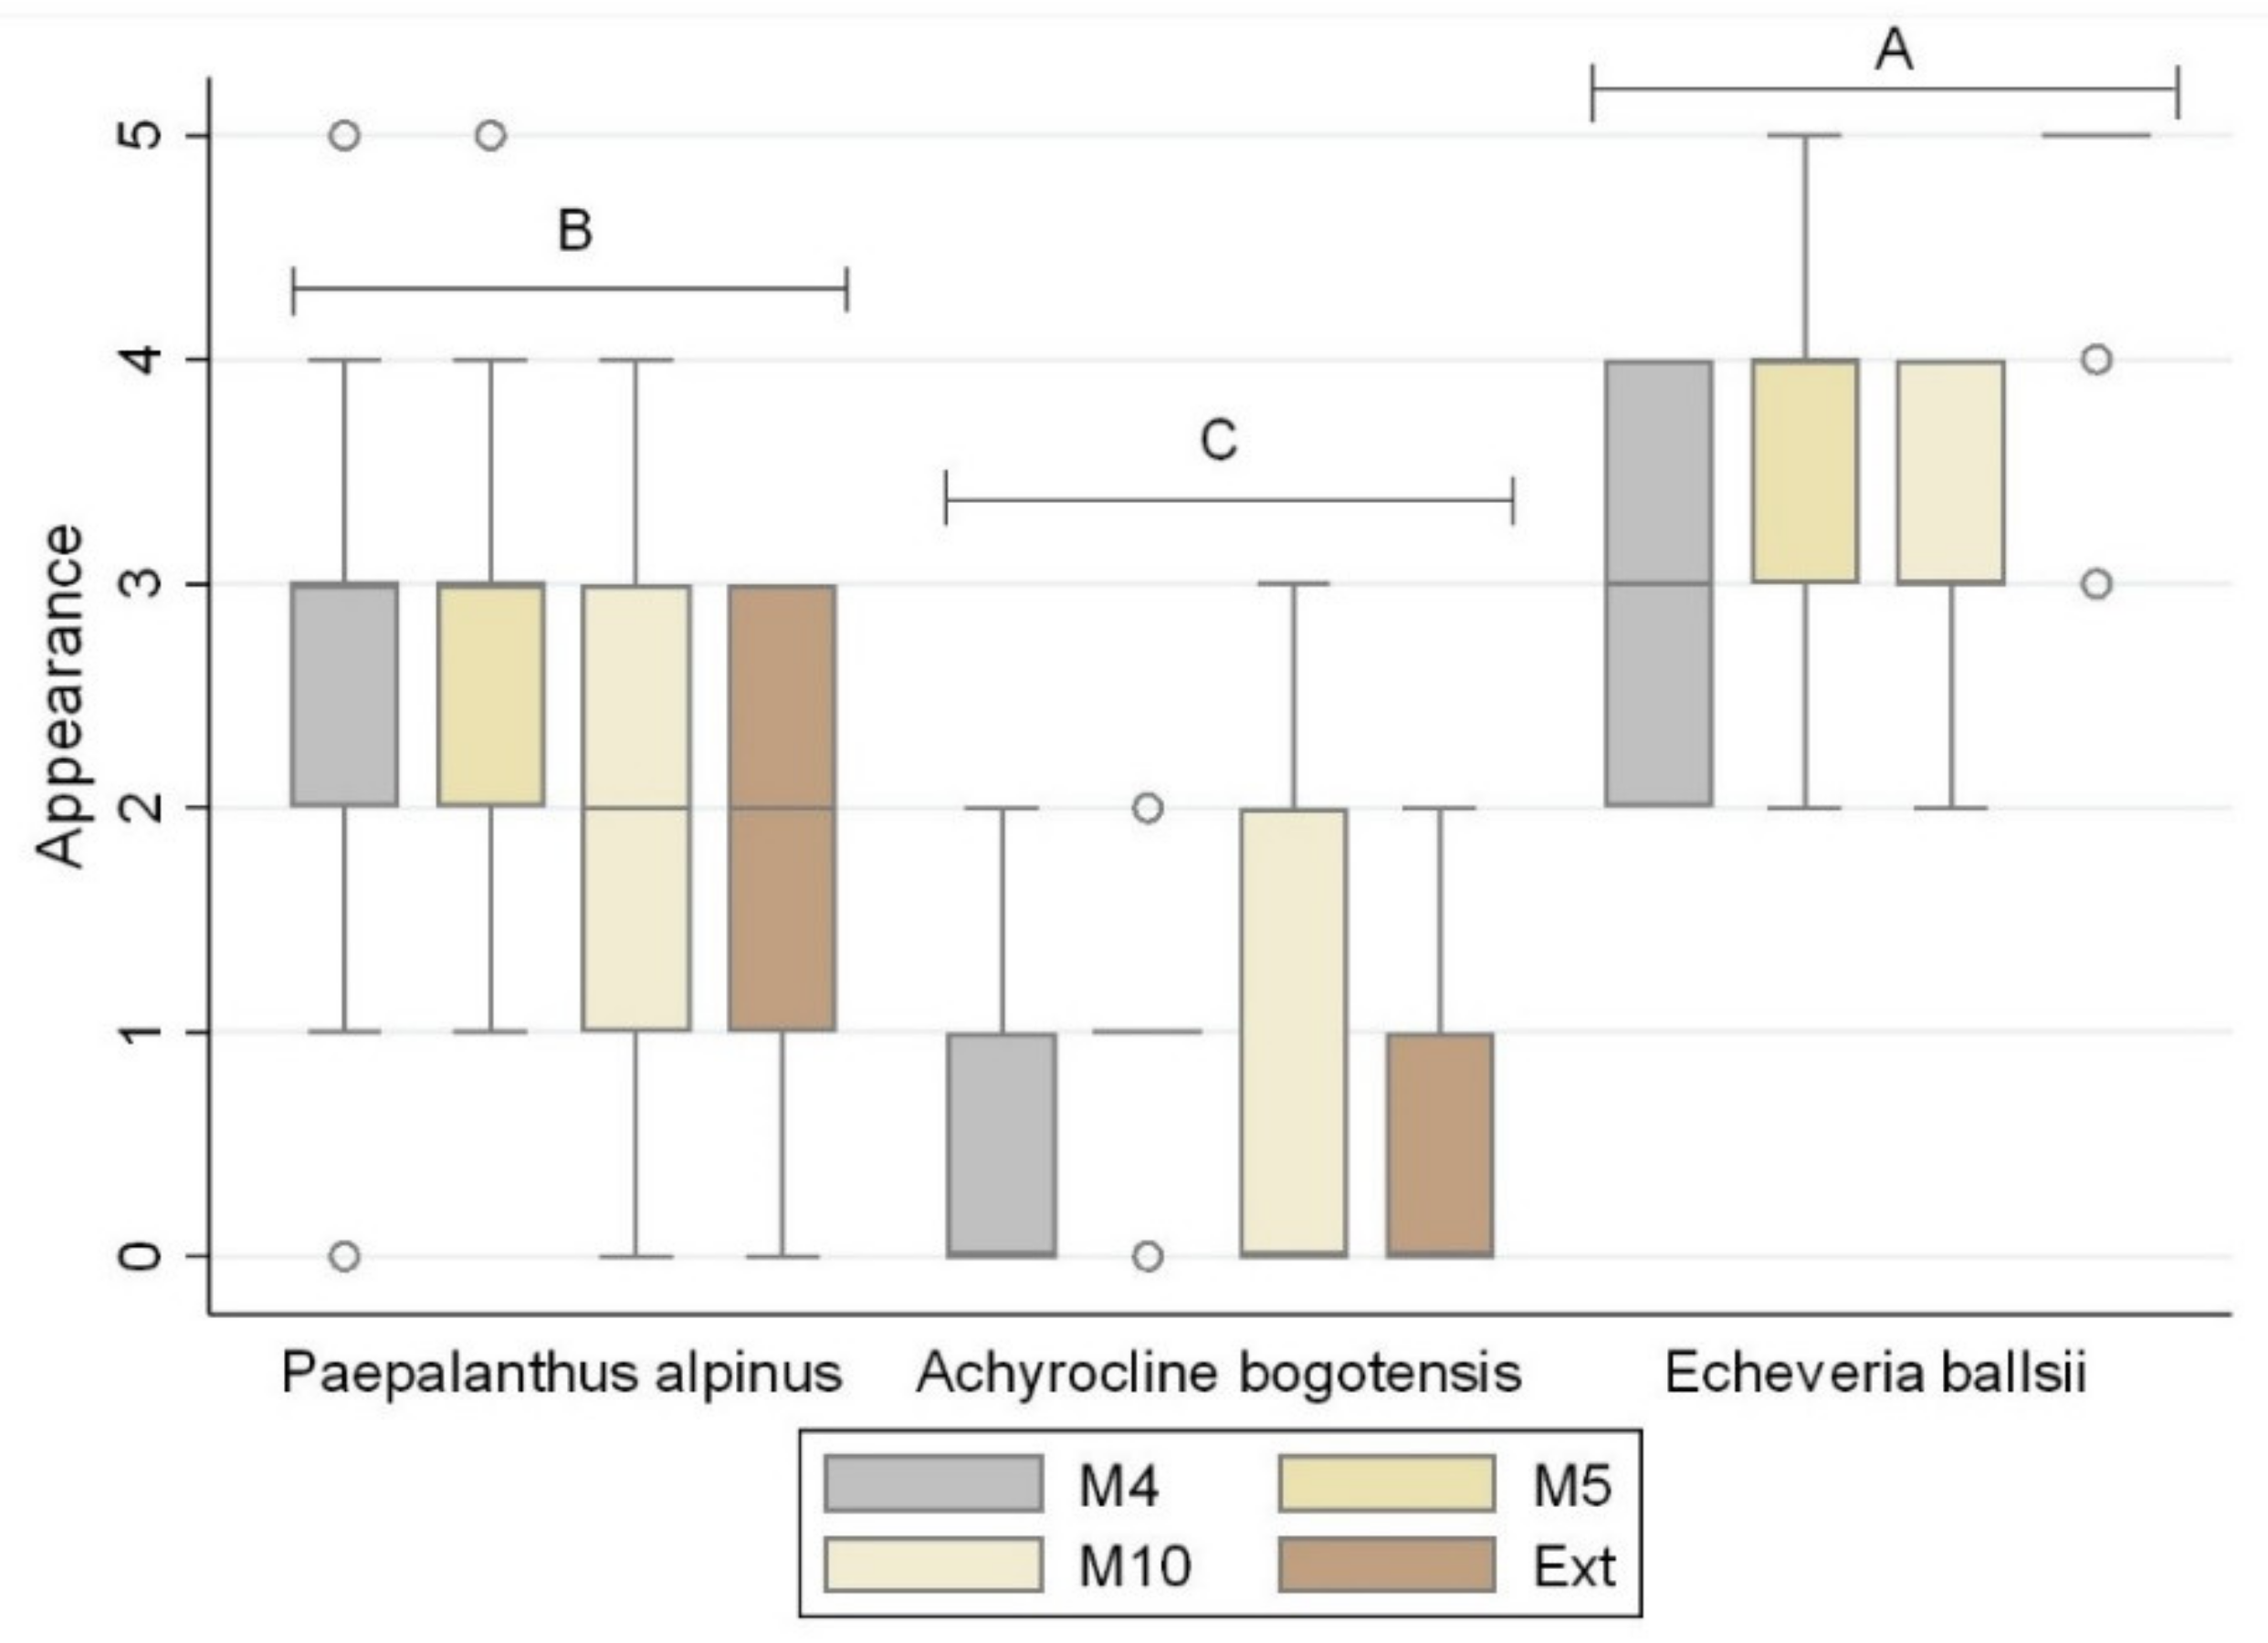
3.3.3. Plant Establishment

Substrate Type Effect

After 6 months of evaluation, P. alpinus showed a 100% survival rate in Mixtures 4 and 5, 66% on Mixture 10, and only 33.3% on the commercial extensive substrate. For A. bogotensis, initial adaptation to rooftop conditions was not favorable. From the third to the sixth month, the individual plants’ survival rate was, in the best case, only 66.6% in M5, whereas only 33.3% survived in M4 and M10, and no individuals remained alive on the commercial substrate. E. ballsii was the best performing species in terms of survival and 100% of its individuals survived on every substrate.
In all substrates, the appearance of P. alpinus dropped in the first two months, followed by a recovery and stable condition at the beginning of the third month. Individuals in M4 and M5 recovered and their mean appearance increased to 3.67. Otherwise, the individual’s appearance in M10 and the CS declined. A.bogotensis was not able to establish properly in the first month and showed a large drop in its appearance in all substrates. It was only until the third month that individuals stabilized on the engineered substrates with a very low appearance. E. ballsii was the species that suffered the least during its initial adaptation to the rooftop conditions, stabilizing after 2 months. Results showed an optimal appearance of 5 on the CS and a mean value of 2.67, 3.33 and 3.33 for Mixtures 4, 5 and 10.
In terms of plant growth, P. alpinus individuals had a marked volume decrease from the beginning, and only individuals in M4 managed to stabilize from the fourth month on. On its natural habitat, P. alpinus’s height has a relative increase between 0.011 and 0.064 cm/cm × month and its coverage area between 0.017 and 0.079 cm2/cm2 × month [46]. Under GR conditions, height relative growth rate was, on average, −0.089 cm/cm × month and coverage −0.116 cm2/cm2 × month, nevertheless, plants in M4 reached the natural growth rate on months 1, 4 and 5 and surpassed it on months 2 and 3. Plants in M5 surpassed the natural growth rate on months 2, 4 and 6, and plants in M10 and CS surpassed the normal growth rate in the second month.
Similarly, A. bogotensis suffered a significant height reduction over the first few months. Santos [43] found a mean growth rate of 0.18 cm/month in a close species (i.e., A. satureioides). In this study this species was able to grow at a same or even higher rate in M4 in the fifth month, in M5 in months 1, 2, 5 and 6 and in M10 in months 1 and 6. All individuals in the CS died by the end of the third month and did not grow in the period they remained alive.
E. ballsii had the best performance in terms of growth and in all the different substrates either stabilized or grew. Echeveria spp. can grow approximately at a rate of 2 cm/month [47]. The mean growth rate of this species was 0.167 cm/month; however, it grew only at its normal rate in CS in months 3 and 5 (2.833 cm/month). Figure 5 presents the evolution of each species appearance and growth rates in the four evaluated substrates over the six months of study.
When comparing the mean appearance between the native species through an ANOVA and post hoc Bonferroni tests, it was possible to identify differences between all of them (p-value = 0.000). According to these analyses, E. ballsii had the best appearance followed by P. alpinus and finally A. bogotensis (Figure 6).
Substrate had a significant effect on E. ballsii’s appearance (p-value = 0.000), for this species the appearance of the plants in the CS was significantly better than those planted on the engineered substrates (p-value <0.01). The effect of the substrate for P. alpinus’s appearance was only significant under a 10% significance level, between M5 and the commercial extensive substrate which had a lower mean appearance (p-value = 0.081). No effect of the substrate over the appearance was visible for A. bogotensis individuals (p-value = 0.179).
Substrate did not had an effect on P. alpinus nor on A. bogotensis growth rates, as it is possible to see in Figure 5, the growth rate of both species had a similar behavior for all the substrates, and although P. alpinus plants growing in M4 and A. bogotensis plants in M5 appear to have a more stable rate, no significant differences are present (p-value > 0.1). For E. ballsii, the effect of the substrate was found to be significant, mean growth rate of the plants in CS was higher than the others (p-value = 0.000).

Species and Climate Effect

Native species appearance and relative growth rate were analyzed together with some climatic variables (temperature, precipitation and relative humidity) in order to identify which variables are important for their establishment. For each species, P. alpinus and E. ballsii appearance was positively correlated with the relative growth rate. Additionally, P. alpinus appearance and relative growth rate were also positively correlated with temperature, and its growth rate has also a positive correlation with precipitation. Appearance of A. bogotensis was positively correlated with precipitation and relative humidity, while its relative growth rate depended more on temperature, which increased when the mean temperature dropped. Meanwhile, E. ballsii’s establishment was not significantly correlated with any of the evaluated climatic variables (p-value > 0.05).

4. Discussion

By formulating several engineered extensive substrates for GRs and proposing native species as vegetated coverage, this study has contributed some possible solutions to the challenges of water management in cities using GRs. This research provided a better understanding of the properties that affect extensive substrate efficiency in terms of stormwater retention, water quality and plant establishment and the possible trade-offs between these criteria. It also provided a general outline of the characteristics needed for a plant to thrive in GR conditions, taking into account that there is an adjustment process that varies with each species, which can be more deeply evaluated by implementing further long-term monitoring.

4.1. Rainfall Retention

All engineered substrates in this study showed that an appropriate ratio between organic amendments and inorganic materials favors moderate weight (80–120 Kg/m2) and WHC values of 20–65%, which made mixtures suitable for GR use according to the recommendations of FLL [16]. The presence of components such as coarse pumice and zeolite contributes to the improvement of the physical properties of the substrate, increasing the porosity which is important for rainfall retention, while aggregates such as sand can increase the bulk density and decrease the ks [5]. This allows us to establish that, as in temperate regions, under a neotropical mountain context, a greater use of coarse amendments (e.g., pumice and expanded clay) increases WHC, which explains the higher WHC value of M5, that was composed of 65% coarse amendments, compared with M4 and M10 that were composed of 50% coarse amendments. (Table 3).
As some studies suggest, it is difficult to compare rainfall retention values between studies, since substrate composition and depth, study length and climate conditions are not homogeneous [28,48]. Therefore, taking into account that only events that generated runoff were measured, the retention values that range between 35.76% and 46.38% are lower than the ones reported in other studies. Brandao et al. [6] measured a median retention that ranged between 55 to 100%, however, over one third of the measured events did not produce runoff. Under the same neotropical mountain climate, in a study on the Universidad de los Andes campus, Ferrans et al. [28] measured a mean retention of 85% for an experimental modular GRs with different vegetation coverages and a 6 cm substrate layer.
In this study, substrates did not present differences in retention, though the size of the event and the antecedent dry weather period (ADPW) were important variables. In contrast to other studies’ findings, larger events, in terms of rainfall depth and duration, are associated with smaller retention efficiencies [28,48]. In this study, the retention of intermediate events was significantly higher than for small and large events. Nevertheless, it was found that more than the size effect, a complementary effect of the soil moisture explained this behavior, as intermediate events were associated with the longest ADWP (Figure 4). In accordance with Stovin et al. [49], these results reflect that the substrate hydrologic performance is strongly influenced by its initial moisture.

4.2. Water Quality

Some studies suggest that GRs can be a source of nutrients that may diminish runoff quality. These reductions in water quality can be attributed to the composition and depth of the substrate and also to the magnitude of the rainfall events [3,15,50]. According to Beecham and Razzaghmanesh [15], low organic matter content in the substrate and the presence of vegetated coverage are crucial factors for a better water quality outcome, however, there is a larger effect associated with substrate than that of plants [28,51]. Regarding event magnitude, lower concentrations of many quality parameters can be associated with larger events [50]. Hence, substrates were design in order to mitigate runoff pollution.
Although pH values differed among substrates, ranging between 6.70 and 8.05, these values do not affect the quality of receiving water bodies and are within the permitted limits of the local normativity (5–9) [52]. As Beecham and Razzaghmanesh [15] explain, the presence of vegetation on GRs is very important since the root activity helps to increase the pH; nonetheless, at pH above 5.5 some nutrients are insoluble and cannot be absorbed by plants, ending up in the runoff. Otherwise, it was found that pH was significantly higher in intermediate events that are associated with long ADWP, in agreement with Buffam et al. [50] findings that associated higher pH with events following dry antecedent conditions.
Results of other quality parameters, showed that GRs’ runoff had significantly higher concentrations than the reference values (i.e., conductivity, TSS, turbidity, TKN, PO4, COB, BOD and coliforms) confirming other study results that reported higher concentrations of TN, TSS, EC and turbidity on GRs [15,53].
Nevertheless, in some cases BES runoff quality (i.e., color, NO2, NO3 and TP) was not statistically different from that of the reference values, which can be attributed to low organic ratio and the presence of vegetation. For all BES, mean concentrations of NO2 and NO3 reported in this study are below the local limit for domestic use, which are, respectively, 1mg/L-N and 10mg/L-N [52]. As for CS, it was found that it can be promising for some species establishment, but it can also be a greater source of pollutants in the runoff [51]. Therefore, though it is challenging to avoid increasing nutrient concentrations on GRs’ runoff, results show that it is possible in some cases to find a balance where there are enough nutrients available for plant uptake and no significant excess is leached.

4.3. Plant Establishment

A variety of inorganic materials were used, as it is understood that the use of multiple inorganic aggregates in substrate composition can increase plant abundance and diversity in GRs [54,55]. Additionally, a proper selection of inorganic constitutes that increase the hydraulic conductivity (ks) and help proper plant establishment were included [5].
The selected native species showed different establishment successes depending on the initial adaptation they achieved under the new conditions, taking into account that no irrigation or fertilization was applied throughout the monitoring period. Although transplanting had obviously a negative impact on the immediate development and adjustment, which differed between the species, the surviving individuals of A. bogotensis and P. alpinus showed their adaptive potential in the engineered substrates. Sarmiento and León [56] found that P. alpinus and Achyrocline spp. grow in shallow and porous soils with a low content of nutrients and are exposed to intense solar radiation for long periods during dry seasons. These conditions resemble at some level the physical properties of the engineered substrates that presented a limited depth and a low proportion of organic matter, unlike growing in nutrient rich soils like the commercial extensive substrate that had 27.4% of organic matter and presented higher concentrations of TKN and TP in the leachate than the engineered substrates. Hence, establishment on commercial substrates was not successful, indicating that these species thrive better under specific conditions. These two species also showed correlation with climatic factors, particularly A. bogotensis that performed better with high precipitation rates and high relative humidity. A more generalist species like E. ballsii showed that it could establish on both engineered and commercial substrates. Although it did not present significant growth in engineered substrates, it managed to adapt under restrictive conditions and were not dependent on specific climatic conditions. These results strengthen the recommendation to use Crassulaceans, due to their ability to adapt to harsh conditions like GRs with poor substrates [4,19,20].
It was possible to notice that using three native species belonging to different growth forms (i.e., herb, cushion and rosette), worked as a strategy to limit competition and enable them to grow together and establish [19,36]. However, only one individual of each species was planted per module, therefore variability could be partly explained by intrinsic variation instead of specific responses to the climatic and edaphic conditions. It is important to mention that plants grow differently depending on the species surrounding them, whether animal, vegetal or fungal. Some studies have found that diverse plant communities where no invasive nor competitive species are used, can ensure the survival of some species by increasing the availability and diversity of pollinators and creating convenient and diverse interactions [19,54,57]. The three species present complemental dispersal mechanisms, for instance, E. ballsii is pollinated by hummingbirds, P. alpinus and A. bogotensis by flying insects and all species use the wind as a dispersal mechanism, amplifying the possibilities of survival of the plant simplistic community.
Through this study it is possible to recommend E. ballsii and P. alpinus as appropriate native plants for GRs in Bogotá. In the particular case of A. bogotensis, though being native, it is sensitive to GR conditions and did not adjust well. Recommendations are to use similar taxa that are more common and plastic, such as A. satureioides, used in other studies for GW and GRs [44] or G. antennarioides, which was used in the preselection phase; or other species from the list that are compatible with the two species recommended previously. Besides this GR design, larger combinations of plant species should be tested in order to maximize biodiversity and help adapt GRs to local climatic conditions as well as to wind, sun exposure, pollution, and so on. Further analysis should be carried out over a longer period of time to observe a more complete development of the species. Additionally, in the case of engineered mixtures, composition of the substrates could be modified in order to increase the organic amendments to promote plant growth.
Other approximations using climate and habitat variables for finding suitable species for GRs constitute an important reference for enlarging the GR’s native plant list proposed in this study. From the list of potential native species for GRs proposed by Jaramillo [27] for Quito, some herbs were also native to Colombia and are present in the rural region of Bogotá (e.g., Castilleja fissifolia, Plantago sericea, Oreomyrrhis andicola). Therefore, similar studies developed in the Andes biogeographic region are primordial to expand the plant list.

5. Conclusions

Several extensive substrate mixtures that presented the appropriate physical properties were developed, namely, Mixtures 4 (So20:Pu40:EC10:S10:Z10:P10), 5 (CP20:Pu60:EC5:S5:Z5:P5) and 10 (C10:CP10:Pu40:EC10:S10:Z10:P10). These had favorable bulk densities and WHCs and were capable of retaining considerable amounts of rainfall. Components such as coarse pumice, and zeolite were found to be suitable for GRs in that they fulfill the GR’s weight requirements and have adequate physical properties for the substrates.
Comparing the runoff quality of the three mixtures with that of a commercial extensive substrate, it was possible to determine that engineered substrates had significantly lower concentrations for most of the parameters, however, they are still a source of TSS, turbidity, TKN, PO4, COD, BOD and coliforms. For some parameters, such as NO2, NO3, TP and color, at least one engineered substrate did not present significantly different concentrations than those of reference samples, which state that for these parameters, engineered substrates do not diminish rainfall quality.
When analyzing the establishment of the selected native species, it was possible to determine that initial adaptation was very difficult for Paepalanthus alpinus and Achyrocline bogotensis. P. alpinus started to stabilize after the fifth month in Mixtures 4 and 5. A. bogotensis showed a deficient performance in all substrates and is not recommended to be used in rooftop conditions. Echeveria ballsii had the best performance, it maintained a good appearance and grew significantly under the commercial extensive substrate conditions, and also had an outstanding establishment on the engineered substrates.
It is recommended to extend the joint evaluation of substrates and native species in order to reach a better understanding of plant establishment and assure that water quality improvement and stormwater retention remains over time. Mixtures must be further analyzed, rearranging volumetric ratios, including a drainage layer and trying other recycled materials such as crushed brick, in order to develop better conditions for P. alpinus and other species with different life-forms that can coexist with the successful species and help to increase biodiversity. Sporadic maintenance and a deeper substrate can improve the appearance and growth of P. alpinus and E. ballsii under the conditions of Mixtures 4, 5 and 10.

Author Contributions

Conceptualization, C.V.R., N.F., G.P., and J.P.R.; Monitoring, C.V.R., and N.F.; Data Analysis, C.V.R., and N.F.; Supervision, G.P., and J.P.R.; Writing—Original Draft Preparation, C.V.R.; Writing—Review and Editing, C.V.R., G.P., and J.P.R. All authors have read and agreed to the published version of the manuscript.

Funding

This research was funded by Departamento de Ingeniería Civil y Ambiental, Universidad de los Andes; Fondo de Apoyo para Profesores Asistentes, Universidad de los Andes and Departamento Administrativo de Ciencia, Tecnología e Innovación (COLCIENCIAS).

Acknowledgments

We thank David Rodríguez for his collaboration and instructions with some of the laboratory analyses, Groncol for providing the commercial substrates and Maria Elsa Correal for her orientation with some statistical analyses.

Conflicts of Interest

The authors declare no conflict of interest. The funders had no role in the design of the study; in the collection, analyses, or interpretation of data; in the writing of the manuscript, or in the decision to publish the results.

Appendix A

Figure A1. Extensive Green Roof modular system. (a) Modular system used in substrate preselection phase, planted with common species. (b) Modular system used in the Substrate–Plant Evaluation phase, planted with native species.
Sustainability 12 06534 g0a1

Appendix B

Figure A2. Rainfall and temperature conditions for experimental evaluation, comprehending the period between November 2016 and August 2017.
Sustainability 12 06534 g0a2
Table A1. Rainfall events used for the analyses in the two experimental phases *.
(Dd/Mm/Yyyy)Experimental PhasePrecipitation (Mm)Duration (Min)ADWP ** (Days)
26 November 2016I6016852.62
1 December 201615.81583.71
3 December 20168.68931.32
9 December 2016312590.13
11 January 201778.45040.82
18 January 201726.44460.43
19 January 2017272880.68
21 February 201732.62160.98
24 February 201761.231101.91
19 March 2017II2325202
21 March 201712.222580.43
25 March 201779.636841
8 April 201711.815847.79
12 April 201715.830091.75
20 April 201713.415991.63
22 April 201717.2581.19
26 April 20173.2873.38
3 May 2017227491.09
11 May 201784.643351.19
15 May 20178.23600.58
6 June 201721.27321.69
8 June 201718.84030.97
9 June 20177.64750.79
11 June 201745.824910.89
18 August201718.86050.79
19 August 201714.625780.42
* Events in bold were measured for water quality analyses. ** Antecedent dry weather period (ADWP).

Appendix C

Table A2. Native species selection tool showing traits categories and scores.
TypeVariableCategoriesScore
AdaptabilityOriginNative6
Naturalized and/or Adventitious3
Cultivated0
Exotic0
Altitude Range (m.a.s.l.)2500–27006
2000–45003
The range does not include the altitude of the zone0
ClimateTemperate6
Dry4
Tropical2
Cold0
Polar0
SoilRequires shallow and poor soils6
Requires shallow and rich soils3
Requires deep soils0
Hydrologic Stress ToleranceDrought tolerant6
Requires low water supply0
Requires high water supply0
Functional CharacteristicsLeaf Area (mm2)0–714
72–1423
>3522
143–2131
214–3520
Leaf ShapeOvate4
Linear3
Lanceolate2
Scale-like1
Other0
Life FormChamaephytes4
Hemicryptophytes3
Geophytes2
Therophytes1
Other0
Reserve OrganWater reservoir (Leaves and Stems)4
Nutrients reservoir (Rizhomes or Bulbs)2
No organ0
Photosynthetic MetabolismCAM4
C33
C3-C42
C41
Oher0
Type of StrategyStress Tolerant4
Competitor and Stress Tolerant2
Ruderal and Stress Tolerant1
Competitor, Ruderal and Stress Tolerant0
ReproductionVegetative/Sexual4
Sexual2
Asexual0
Typical Height (cm)<604
>600
WoodinessSemi-Fibrous4
Not Fibrous2
Fibrous/Woody0
Utilitarian AspectsSeed DispersalBirds, Insects and Wind2
Insects1
Birds1
Wind1
Other0
Flowering Period9–12 months2
6–9 months2
3–6 months1
0–3 months0
Shoot Growth FormErect2
Semi-erect1
Prostrate0

Appendix D

Table A3. Statistical ANOVA and Kruskal–Wallis test results for the effect of substrate type (i.e., M4, M5, M10 and M13), event size (i.e., small, intermediate and large) and species (i.e., P. alpinus, A. bogotensis and E. ballsii) on rainfall retention and plant establishment.
Response VariableEffectTestValuep-Value
Rainfall retentionSubstrate TypeKruskal–Wallischi2 = 2.090.554
Rainfall retentionEvent SizeKruskal–Wallischi2 = 18.210.001
AppearanceSpeciesANOVAF = 151.660.000
P. alpinus AppearanceSubstrate TypeANOVAF = 2.520.065
A. bogotensis AppearanceSubstrate TypeKruskal–Wallischi2 = 4.910.179
E. ballsii AppearanceSubstrate TypeANOVAF = 26.260.000
P. alpinus Growth rateSubstrate TypeKruskal–Wallischi2 = 3.570.311
A. bogotensis Growth rateSubstrate TypeANOVAF = 0.070.555
E. ballsii Growth rateSubstrate TypeANOVAF = 24.290.000
Table A4. Linear regressions (Ordinary Least Squares) to evaluate the effect of plant appearance and growth rate, and substrate, on rainfall retention.
SpeciesVariabletp-Value
P. alpinusAppearance−2.760.008Num obs = 68
Size−1.520.133F(3,64) = 3.31
Substrate1.480.144p-value = 0.025
constant5.070.000
A. bogotensisAppearance−1.690.096Num obs = 68
Size1.790.078F(3,64) = 3.31
Substrate0.390.695p-value = 0.025
constant3.330.001
E. ballsiiAppearance−3.670.001Num obs = 68
Size0.300.766F(3,64) = 3.31
Substrate1.040.303p-value = 0.025
constant5.760.000
Table A5. Spearman correlations between plan establishment characteristics and water quality parameters.
SubstrateM4
VariableAppearanceSize
SpeciesP. alpinusA. bogotensisE. ballsiiP. alpinusA. bogotensisE. ballsii
pH−0.051−0.648 *−0.575 *0.265−0.626 *0.241
Conductivity−0.0050.1580.2590.2960.2340.118
Turbidity−0.058−0.309−0.231−0.273−0.307−0.152
TSS−0.1360.1610.770 *−0.6910.229−0.527
Color0.0650.3550.2910.4270.3040.153
TKN0.1140.318−0.129−0.0850.2560.260
NO2−0.1880.614 *0.174−0.0700.672 *−0.087
NO3−0.1620.708 *0.457−0.3750.656 *−0.171
TP−0.1550.353−0.0650.0100.4150.068
PO40.023−0.362−0.378−0.168−0.391−0.045
SubstrateM5
pH0.118−0.2430.2090.013−0.1610.013
Conductivity0.1070.637 *0.316 *−0.0770.480 *−0.181
Turbidity−0.1430.177−0.275−0.0360.2550.183
TSS−0.2600.659−0.4120.3680.3530.385
Color−0.039−0.574 *−0.2020.137−0.659 *0.178
TKN−0.598 *0.112−0.223−0.287−0.0110.065
NO2−0.0800.167−0.2220.0220.1960.081
NO3−0.359−0.189−0.233−0.021−0.628 *0.098
TP−0.231−0.452−0.2640.0730.2870.158
PO4−0.0640.148−0.2750.2770.2350.364
SubstrateM10
pH0.268−0.1230.286−0.278−0.053−0.212
Conductivity0.535 *0.417 *0.0860.0680.616 *0.022
Turbidity−0.576 *0.248−0.796 *−0.0820.280−0.214
TSS−0.1620.590−0.5200.0340.717 *0.042
Color−0.4430.2800.174−0.526 *0.504−0.441
TKN−0.0200.065−0.3840.3960.162−0.018
NO2−0.0910.562 *−0.540 *0.4310.610 *0.062
NO3−0.5800.075−0.403−0.0170.1920.176
TP−0.0050.110−0.567 *0.197−0.272−0.107
PO4−0.535 *−0.168−0.102−0.670*−0.367−0.365
SubstrateM13
pH0.345 *−0.406 *0.1520.185−0.1860.061
Conductivity0.0850.758 *−0.653 *0.1410.680 *−0.840 *
Turbidity0.0620.812 *0.0000.4200.619 *−0.754 *
TSS−0.1120.738 *0.4000.350−0.683 *
Color−0.121−0.012−0.5030.1370.144−0.489
TKN−0.3130.643 *−0.4540.0040.591 *−0.568 *
NO2−0.4710.316−0.527 *−0.2130.354−0.256
NO3−0.0460.2480.1300.231−0.047−0.175
TP−0.2930.423−0.136−0.0570.312−0.307
PO40.1530.363−0.4090.1790.493−0.646*
* p-value < 0.05.
Table A6. Water quality results. Values represent the average value of the measured events.
MixturepH *Conductivity *Apparent ColorTurbidityTotal Suspended Solids **Nitrates **NitritesAmmoniaTotal Kjedhal NitrogenPhosphatesTotal PhosphorusBOD **CODColiforms
(μs/cm)(UPC)(NTU)(mg/L)(mg/L-N)(mg/L-N)(mg/L-N)(mg/L-N)(mg/L-P)(mg/L-P)(mg/L)(mg/L)(MPN)
M46.70196.12617.66.952.391.1020.0200.1430.9270.2370.2362.2627.530,513
(0.56)(268.518)(6.6)(4.22)(0.73)(0.454)(0.022)(0.251)(0.501)(0.154)(0.386)(1.09)(6.9)(48,304)
33381515812151515151591512
M57.20303.208148.328.059.680.9460.0160.1021.0921.9240.9862.8739.62733
(1.23)(637.577)(63.7)(11.77)(5.67)(0.382)(0.007)(0.114)(0.352)(1.015)(1.124)(1.32)(13.5)(35,37)
33391515912151515151591512
M107.37249.354113.323.678.700.7890.0240.0572.1230.9640.4332.9449.211,207
(0.36)(509.529)(24.8)(7.60)(3.96)(0.235)(0.025)(0.059)(1.515)(0.435)(0.420)(1.02)(15.0)(31,307)
3339151599151515141591512
M138.051062.9971073.332.9616.237.8790.0730.2089.44512.2566.6215.82279.826,449
(0.33)(2186.882)(628.5)(25.42)(12.44)(4.479)(0.032)(0.101)(4.184)(4.454)(3.112)(2.69)(91.7)(41,341)
33391515912151515151591512
Reference7.3625.1559.42.431.030.5630.0190.3810.5120.0580.1101.118.9143
(0.82)(21.284)(3.0)(1.71)(0.60)(0.249)(0.014)(0.301)(0.395)(0.042)(0.110)(0.42)(5.9)(320)
222410106810101010106108
* Conductivity and pH were analyzed for 10 and 12 rainfall events, respectively; ** For total suspended solids, nitrates and biological oxygen demand (BOD), only 3, 4 and 3 rainfall events were analyzed in the laboratory, respectively. The other parameters were analyzed for 5 rainfall events.
Table A7. Spearman correlations between plant establishment characteristics and climatic variables.
VariableAppearanceGrowth Rate
SpeciesP. alpinusA. bogotensisE. ballsiiP. alpinusA. bogotensisE. ballsii
Precipitation0.0460.297 *0.0310.240 *−0.0040.188
Temperature0.285 *0.0880.1430.424 *−0.228 *0.066
Relative Humidity−0.0580.319 *−0.0070.0230.0230.014
App. P. alpinus1.0000.065−0.1660.485 *−0.114−0.066
App. A. bogotensis0.0651.000−0.1770.0780.195−0.151
App. E. ballsii−0.166−0.1771.000−0.069−0.1580.349 *
GR P. alpinus0.458 *0.078−0.0691.000−0.170−0.070
GR A. bogotensis−0.1140.195−0.158−0.1701.0000.035
GR E. ballsii−0.066−0.1510.349 *−0.0700.0351.000
* p-value < 0.05.

References

  1. United Nations. World Urbanization Prospects. The 2014 Revision; United Nations: New York City, NY, USA, 2015. [Google Scholar]
  2. Bates, A.; Sadler, J.; Greswell, R.; Mackay, R. Effects of recycled aggregate growth substrate on green roof vegetation development: A six year experiment. Landsc. Urban. Plan. 2015, 135, 22–31. [Google Scholar] [CrossRef] [Green Version]
  3. Kuoppamäki, K.; Lehvavirta, S. Mitigating nutrient leaching from green roofs with biochar. Landsc. Urban. Plan. 2016, 152, 39–48. [Google Scholar] [CrossRef]
  4. Butler, C.; Butler, E.; Orians, C.M. Native plant enthusiasm reaches new heights: Perceptions, evidence, and the future of green roofs. Urban. For. Urban. Green. 2012, 11, 1–10. [Google Scholar] [CrossRef]
  5. Liu, R.F.; Fassman-Beck, E. Effect of composition on basic properties of engineered media for living roofs and bioretention. J. Hydrol. Eng. 2016, 21, 06016002. [Google Scholar] [CrossRef]
  6. Brandão, C.; Cameira, M.D.R.; Valente, F.; De Carvalho, R.C.; Paço, T. Wet season hydrological performance of green roofs using native species under Mediterranean climate. Ecol. Eng. 2017, 102, 596–611. [Google Scholar] [CrossRef]
  7. Jim, C.; Peng, L.L. Substrate moisture effect on water balance and thermal regime of a tropical extensive green roof. Ecol. Eng. 2012, 47, 9–23. [Google Scholar] [CrossRef]
  8. Ondoño, S.; Martínez-Sánchez, J.; Moreno, J. The composition and depth of green roof substrates affect the growth of Silene vulgaris and Lagurus ovatus species and the C and N sequestration under two irrigation conditions. J. Environ. Manag. 2016, 166, 330–340. [Google Scholar] [CrossRef]
  9. Vijayaraghavan, K. Green roofs: A critical review on the role of components, benefits, limitations and trends. Renew. Sustain. Energy Rev. 2016, 57, 740–752. [Google Scholar] [CrossRef]
  10. Vijayaraghavan, K.; Raja, F.D. Design and development of green roof substrate to improve runoff water quality: Plant growth experiments and adsorption. Water Res. 2014, 63, 94–101. [Google Scholar] [CrossRef]
  11. Chow, M.F.; Abu Bakar, M.F.; Wong, J.K. An overview of plant species and substrate materials or green roof system in tropical climate urban environment. In Proceedings of the AIP Conference, Ho Chi Min, Vietnam, 29–30 April 2018; AIP Publishing: Melville, NY, USA; 020004. [Google Scholar]
  12. Rowe, D. Green roofs as a means of pollution abatement. Environ. Pollut. 2011, 159, 2100–2110. [Google Scholar] [CrossRef] [Green Version]
  13. Bates, A.; Mackay, R.; Greswell, R.; Sadler, J. SWITCH in Birmingham, UK: Experimental investigation of the ecological and hydrological performance of extensive green roofs. Rev. Environ. Sci. Bio/Technol. 2009, 8, 295–300. [Google Scholar] [CrossRef] [Green Version]
  14. Licht, J.; Lundholm, J. Native Coastal Plants for Northeastern Extensive Ans Semi-Extensive Green Roof Trays: Substrates, Fabrics, and Plant Selection. In Proceedings of the 4th Annual Greening Rooftops for Sustainable Communities Conferences, Boston, MA, USA, 11–12 May 2006. [Google Scholar]
  15. Beecham, S.; Razzaghmanesh, M. Water quality and quantity investigation of green roofs in a dry climate. Water Res. 2015, 70, 370–384. [Google Scholar] [CrossRef] [PubMed]
  16. Forschungsgesellschaft Landschftsentwicklung und Landschftsbau e.V. (FLL). Richtlinien für Die Planung, Ausführung und Pflege von Dachbegrünungen. Richtlinien für Dachbegrünungen (Guideline for the Planning Execution and Upkeep of Green-Roof Sites); Selbstverlag: Troisdorf, Germany, 2008. [Google Scholar]
  17. Graceson, A.; Hare, M.; Monaghan, J.M.; Hall, N. The water retention capabilities of growing media for green roofs. Ecol. Eng. 2013, 61, 328–334. [Google Scholar] [CrossRef]
  18. Dunnett, N. Green roofs for biodiversity: reconciling aesthetics with ecology. In Proceedings of the 4th Annual Greening Rooftops for Sustainable Communities, Boston, MA, USA, 11–12 May 2006. [Google Scholar]
  19. MacIvor, J.; Lundholm, J. Performance evaluation of native plants suited to extensive green roof conditions in a maritime climate. Ecol. Eng. 2011, 37, 407–417. [Google Scholar] [CrossRef]
  20. Durhman, A.K.; Rowe, D.B.; Rugh, C.L. Effect of substrate depth on initial growth, coverage, and survival of 25 succulent green roof plant taxa. Hort. Sci. 2007, 42, 588–595. [Google Scholar] [CrossRef] [Green Version]
  21. Johari, J.; Rasidi, M.H.; Said, I. Planting Technology of Green Roof for Building in Tropical Cities: A Review on Plant Selection. In Proceedings of the 5th South East Asian Technical University Consortium Symposium, Hanoi, Vietnam, 24 February 2011. [Google Scholar]
  22. Fai, C.M.; Bakar, M.A.; Roslan, M.A.A.; Fadzailah, F.A.; Idrus, M.F.Z.; Ismail, N.F.; Sidek, L.M.; Basri, H. Hydrological performance of native plant species within extensive green roof system in Malaysia, ARPN. J. Eng. Appl. Sci. 2015, 15, 6419–6423. [Google Scholar]
  23. Feitosa, R.C.; Wilkinson, S.J. Modelling green roof stormwater response for different soil depths. Landsc. Urban. Plan. 2016, 153, 170–179. [Google Scholar] [CrossRef]
  24. Feitosa, R.C.; Wilkinson, S.J. Attenuating heat stress through green roof and green wall retrofit. Build. Environ. 2018, 140, 11–22. [Google Scholar] [CrossRef]
  25. Parizotto, S.; Lamberts, R. Investigation of green roof thermal performance in temperate climate: A case study of an experimental building in Florianópolis city, Southern Brazil. Energy Build. 2011, 43, 1712–1722. [Google Scholar] [CrossRef]
  26. Noya, M.G.; Cuquel, F.L.; Schäfer, G.; Armindo, R.A. Substrates for cultivating herbaceous perennial plants in extensive green roofs. Ecol. Eng. 2017, 102, 662–669. [Google Scholar] [CrossRef]
  27. Jaramillo, M.L. Plant Selection for Green Roofs in Quito, Ecuador. Master’s Thesis, Faculty of Science, University of Melbourn, Melbourne, Australia, 2016. [Google Scholar]
  28. Ferrans, P.; Rey, C.; Pérez, G.; Rodríguez, J.; Díaz-Granados, M. Effect of Green Roof Configuration and Hydrological Variables on Runoff Water Quantity and Quality. Water 2018, 10, 960. [Google Scholar] [CrossRef] [Green Version]
  29. Escobar, N.O.; Torres, A. Hydric Attenuation and Hydrological Benefits for Implementing Productive Green Roof in Soacha, Colombia. Ingenieria y Universidad 2014, 18, 291. [Google Scholar] [CrossRef] [Green Version]
  30. Molina, S.G.; Torres, A.; Rengifo, P.; Puentes, A.; Cárcamo-Hernández, E.; Méndez-Fajardo, S.; Devia, C. The benefits of an eco-productive green roof in Bogota, Colombia. Indoor Built Environ. 2016, 26, 1135–1143. [Google Scholar] [CrossRef]
  31. Bolaños, T.; Moscoso, A. Guía de Selección de Especies Para Ecoenvolventes; Universidad Piloto de Colombia: Bogotá, Colombia, 2011. [Google Scholar]
  32. Secretaría Distrital de Ambiente. Guía de techos verdes y jardines verticales. Secretaría Distrital de Ambiente de Bogotá: Bogotá, Colombia. Available online: http://www.ambientebogota.gov.co/c/document_library/get_file?uuid=f807042d-064e-4a7a-adf1-75e1e4b7aaaa&groupId=1015 (accessed on 30 September 2016).
  33. Van Mechelen, C.; Dutoit, T.; Kattge, J.; Hermy, M. Plant trait analysis delivers an extensive list of potential green roof species for Mediterranean France. Ecol. Eng. 2014, 67, 48–59. [Google Scholar] [CrossRef]
  34. Rayner, J.P.; Farrell, C.; Raynor, K.J.; Murphy, S.M.; Williams, N.S. Plant establishment on a green roof under extreme hot and dry conditions: The importance of leaf succulence in plant selection. Urban. For. Urban. Green. 2016, 15, 6–14. [Google Scholar] [CrossRef]
  35. Instituto de Hidrología. Estudio de la Caracterización Climática de Bogotá y Cuenca Alta del Río Tunjuelo; Instituto de Hidrología: Bogotá, Colombia, 2013. [Google Scholar]
  36. Monterusso, M.A.; Rowe, D.B.; Rugh, C.L. Establishment and persistence of sedum spp. and native taxa for green roof applications. HortScience 2005, 40, 391–396. [Google Scholar] [CrossRef]
  37. Uesseler, H. Diplomado: Sistema LEED Certificación en Construcción sostenible. Available online: https://docplayer.es/17519726-Diplomado-sistema-leed-certificacion-en-construccion-sostenible-modulo-uso-eficiente-del-agua-jardineria-ecologica-y-cubiertas-verdes-por.html (accessed on 15 October 2016).
  38. Rivera, C. Cubiertas Vegetales en la Región del Caribe. Available online: https://upcommons.upc.edu/bitstream/handle/2099.1/25659/memoria.pdf?sequence=1&isAllowed=y (accessed on 15 October 2016).
  39. Soto, M.S.; Lorena, B.; Coviella, M.A.; Stancanelli, S. Catálogo de plantas para techos verdes. Instituto Nacional de Tecnología Agropecuaria. Available online: https://inta.gob.ar/sites/default/files/script-tmp-inta_-_catlogo_de_plantas_para_techos_verdes.pdf (accessed on 15 October 2016).
  40. Impulsemillas. Catálogo Techos Vivos. Available online: https://issuu.com/pamil243/docs/catalogo_techos_vivos__mayo_2013 (accessed on 15 October 2016).
  41. Bernal, R.; Gradstein, S.R.; Celis, M. Catálogo de plantas y líquenes de Colombia. Instituto de Ciencias Naturales, Universidad Nacional de Colombia, Bogotá. Available online: http://catalogoplantasdecolombia.unal.edu.co. (accessed on 15 October 2016).
  42. Tropicos. Sepecimen Search Engine. Available online: https://www.tropicos.org/SpecimenSearch.aspx (accessed on 20 November 2016).
  43. Santos, D.; (Jardín Botánico José Celestino Mútis: Bogotá, Colombia). Evaluación de seis especies nativas (Salvia scutellarioides Kunth, Bidens andicola Kunth, Scutellaria ventenatii Hook, Senecio formosus Kunth, Salvia cuatrecasana Epling y Slavia xeropapillosa Fern. Alonso) y un sustrato para ser utilizados en ecoenvolventes arquitectonicos. Personal communication, 2014. [Google Scholar]
  44. Santos, D.; (Jardín Botánico José Celestino Mútis: Bogotá, Colombia). Evaluación de cuatro especies nativas (Achyrocline satureioides, Brachyotum stringosum, Niphogeton sp, Lupinus sp) y un proceso de fertilización orgánica con potencial para ser utilizados en muros verdes. Personal communication, 2015. [Google Scholar]
  45. Eaton, A.D. Standard Methods for the Examination of Water and Wastewater, 21st ed.; American Public Health Association: Washington, DC, USA, 2005. [Google Scholar]
  46. Castiblanco-Álvarez, F. Control de pastos exóticos mediante sombreado artificial y reubicación de especies nativas como estrategias para la restauración ecológica del páramo andino (PNN Chingaza-Colombia). Departamento de Biología 2012, 55. [Google Scholar] [CrossRef]
  47. United States Plant Patent. Echeveria Plant name ‘Apus’. Available online: https://patentimages.storage.googleapis.com/20/18/81/0ce21ca9b980ed/USPP26229.pdf (accessed on 15 April 2020).
  48. Carpenter, C.M.G.; Todorov, D.; Driscoll, C.T.; Montesdeoca, M. Water quantity and quality response of a green roof to storm events: Experimental and monitoring observations. Environ. Pollut. 2016, 218, 664–672. [Google Scholar] [CrossRef]
  49. Stovin, V.; Vesuviano, G.; Kasmin, H. The hydrological performance of a green roof test bed under UK climatic conditions. J. Hydrol. 2012, 414, 148–161. [Google Scholar] [CrossRef]
  50. Buffam, I.; Mitchell, M.E.; Durtsche, R.D. Environmental drivers of seasonal variation in green roof runoff water quality. Ecol. Eng. 2016, 91, 506–514. [Google Scholar] [CrossRef]
  51. Chen, C.F.; Kang, S.F.; Lin, J.H. Effects of recycled glass and different substrate materials on the leachate quality and plant growth of green roofs. Ecol. Eng. 2018, 112, 10–20. [Google Scholar] [CrossRef]
  52. Ministerio de Agricultura. DECRETO No. 1594 DEL 26 DE JUNIO DE 1984; Ministerio de Agricultura: Bogotá, Colombia, 1984.
  53. Liu, W.; Wei, W.; Chen, W.; Deo, R.; Si, J.; Xi, H.; Feng, Q. The impacts of substrate and vegetation on stormwater runoff quality from extensive green roofs. J. Hydrol. 2019, 576, 575–582. [Google Scholar] [CrossRef]
  54. Molineux, C.; Gange, A.; Connop, S.; Newport, D. Using recycled aggregates in green roof substrates for plant diversity. Ecol. Eng. 2015, 82, 596–604. [Google Scholar] [CrossRef]
  55. Nektarios, P.A.; Amountzias, I.; Kokkinou, I.; Ntoulas, N. Green roof substrate type and depth affects the growth of the native species Dianthus fruticosus under reduced irrigation regimens. HortScience. 2011, 46, 12081216. [Google Scholar] [CrossRef] [Green Version]
  56. León, O.A. Transición bosque-páramo. Bases conceptuales y métodos para su identificación en los Andes colombianos; Instituto de Investigacion de Recursos Biologicos Alexander von Humboldt (IAVH): Bogotá, Colombia, 2015. [Google Scholar]
  57. MacIvor, J.S.; Margolis, L.; Puncher, C.L.; Matthews, B.J.C. Decoupling factors affecting plant diversity and cover on extensive green roofs. J. Environ. Manag. 2013, 130, 297–305. [Google Scholar] [CrossRef] [PubMed]
Figure 1. Experimental setup description. Detail of the modular substrate design (vegetation cover, substrate composition) in the two experimental phases with their corresponding monitored variables. Substrates represented with letters BS and CS are the three best performing mixtures and the best performing commercial substrate, selected for Substrate–Plant Evaluation. Three replicates of each substrate were used for the Substrate–Plant Evaluation.
Sustainability 12 06534 g001
Figure 2. Common species used for substrate preselection.
Sustainability 12 06534 g002
Figure 3. Native species used for the plant–substrate joint evaluation.
Sustainability 12 06534 g003
Figure 4. Rainfall Retention Box Plot categorized by substrate and event size. Following K–W test, the same capital letters (A, B) show no statistically significant differences between event sizes. (e.g., GRs have significantly higher retention efficiency for intermediate events than for large and small events) (p-value <0.01). Mean values and (SD) of event size characteristics.
Sustainability 12 06534 g004
Figure 5. Monthly average and standard deviation of plant appearance for (a) Paepalanthus alpinus, (b) Achyrocline bogotensis and (c) Echeveria ballsii, presented by substrate. The appearance scale represents the following characteristics: 5: No stress, all leaves are healthy; 4: Minor stress, more than 50% of leaves are green; 3: 50% of the leaves are green; 2: Stress, less than 50% of the leaves are green; 1: Severe stress, few leaves remain green; 0: Plant is dead and completely dried. Monthly average and standard deviation of plant volume or height for (d) Paepalanthus alpinus, (e) Achyrocline bogotensis and (f) Echeveria ballsii, presented by type of substrate. Bars represent standard errors.
Sustainability 12 06534 g005
Figure 6. Effect of the substrate and standard deviation on the native species appearance. The same capital letters (AC) show no statistically significant differences between species (ANOVA) (e.g., Echeveria ballsii has a significantly higher appearance than Paepalanthus alpinus and Achyrocline bogotensis). Differences were tested under 5% significance level.
Sustainability 12 06534 g006
Table 1. Extensive substrate mixture volumetric ratios (%) of organic and inorganic components.
MixtureOrganic AmendmentsInorganic Aggregates
Compost (%)Humic Soil (%)Coco-Peat (%)Rice Husk (%)Coarse Pumice (%)Expanded Clay (%)Sand (%)Zeolite (%)Perlite (%)
M120000605555
M2200004010101010
M302000605555
M4020004010101010
M500200605555
M6002004010101010
M75555605555
M855554010101010
M9100100605555
M101001004010101010
M110101006057.507.5
M12010100401015015
M13Commercial Extensive Substrate
M14Commercial Intensive Substrate
Table 2. Plant traits and aspects used to evaluate characteristics present in plants used in green roofs (GRs).
Zone AdaptabilityFunctionalUtilitarian
OriginLeaf areaSeed dispersal
Altitude rangeLeaf shapeFlowering period
ClimateLife formShoot Growth form
SoilReserve organ
Drought tolerancePhotosynthesis
Strategy
Reproduction
Height
Woodiness
Table 3. Physical properties of the mixtures evaluated in the substrate selection.
MixtureWeight—Saturated (Kg/m3)Bulk Density—Dry Weight (g/cm3)Bulk Density—at WHC (g/cm3)WHC (%)Retention Efficiency a (%)
186.010.620.8130.140.9 (20.3)
2107.890.590.7425.856.5 (25.2)
388.650.540.7945.651.5 (19.8)
4106.570.500.6632.166.2 (16.7)
592.360.290.4866.868.4 (16.4)
695.620.580.7630.656.5 (18.5)
785.930.490.6940.453.1 (18.9)
8101.120.570.7430.459.2 (20.3)
980.290.40.6151.743.4 (20.9)
1096.920.540.7233.163.4 (17.8)
1188.680.480.746.154.9 (17.8)
1295.670.560.7635.739.5 (22.4)
1365.090.280.5286.450.4 (14.4)
1468.240.510.8668.445.6 (19.2)
a Retention efficiency is presented as the mean percentage of the nine measured rainfall events. Values in brackets show the standard deviation. Values in bold are from the substrates selected to be further evaluated with the native species. WHC, water holding capacity.
Table 4. Native species rank and score according to their evaluation obtained using the selection tool.
RankNameFamilyScore
1stPernettya prostrataEricaceae59
2ndEcheveria ballsiiCrassulaceae56
3rdAchyrocline bogotensisAsteraceae54
4thEcheveria bicolorCrassulaceae53
5thEcheveria quitensisCrassulaceae53
6thPaepalanthus alpinusEriocaulaceae52
7thSisyrinchium bogotenseIridaceae49
8thSalvia xeropapillosaLamiaceae48
9thCalamagrostis effusaPoaceae48
10thSalvia scutellarioidesLamiaceae47
11thOrthrosanthus chimboracensisIridaceae47
Species in bold were those selected for the plant–substrate joint evaluation.
Table 5. Effect of substrate and event size on runoff water quality parameters.
ParameterEffectTransformationTestValuep-Value
pHSubstrate Group *-ANOVAF = 19.580.000
Event Size-Kruskal–Wallischi2 = 8.280.016
Conductivity (μs/cm)Substrate Group LnKruskal–Wallischi2 = 92.830.000
Event SizeLnWelchW = 3.930.022
Physical Parameters
Color (PCS)Substrate GroupLnANOVAF = 86.230.000
Event SizeLnKruskal–Wallischi2 = 1.470.481
Turbidity (NTU)Substrate Group-WelchW = 48.510.000
Event Size-WelchW = 0.190.829
TSS (mg/L)Substrate Group-WelchW = 22.910.000
Nitrogen Parameters
TKN (mg/L-N)Substrate TypeLnKruskal–Wallischi2 = 47.420.000
Event SizeLnKruskal–Wallischi2 = 0.740.690
Nitrites (mg/L-N)Substrate TypeLnKruskal–Wallischi2 = 29.060.000
Event SizeLnKruskal–Wallischi2 = 1.490.475
Nitrates (mg/L-N)Substrate Type LnKruskal–Wallischi2 = 32.320.000
Event Size-ANOVAF = 0.090.913
Ammonia (mg/L-N)Substrate Type *-ANOVAF = 5.760.001
Event Size-Kruskal–Wallischi2 = 3.810.149
Phosphorus Parameters
Total phosphorus (mg/L-P)Substrate Type LnKruskal–Wallischi2 = 45.630.000
Event SizeLnKruskal–Wallischi2 = 3.550.169
Phosphates (mg/L-P)Substrate Type LnANOVAF = 84.270.000
Event SizeLnKruskal–Wallischi2 = 0.450.798
Organic Matter Parameters
BOD (mg/L)Substrate GroupLnANOVAF = 25.940.000
COD (mg/L)Substrate GroupLnWelchW = 245.160.000
Event SizeLnKruskal–Wallischi2 = 3.350.188
Coliform
Total coliforms (MPN)Substrate Group-WelchW = 5.540.011
Event Size-WelchW = 24.180.004
Substrate Type Effect (M4, M5, M10, M13, reference value). Substrate Group Effect (reference value, best engineered substrates, commercial substrate). Event Size Effect (small, intermediate, large). * Results of substrate group effect on pH and substrate type on Ammonia are presented but did not comply with test assumptions (i.e., normality or heteroscedasticity).

