
Repetitive Sequence Barcode Probe for Karyotype Analysis in Tripidium arundinaceum
by
 and
and
Jin Chai
1,2,†, 
Ling Luo
1,2,†,
Zehuai Yu
3,
Jiawei Lei
1,2,
Muqing Zhang
3 and
Zuhu Deng
1,2,3,* 1
National Engineering Research Center for Sugarcane, Fujian Agriculture and Forestry University, Fuzhou 350002, China
2
Key Lab of Sugarcane Biology and Genetic Breeding, Ministry of Agriculture, Fujian Agriculture and Forestry University, Fuzhou 350002, China
3
State Key Laboratory for Protection and Utilization of Subtropical Agro-Bioresources, Guangxi University, Nanning 530004, China
*
Author to whom correspondence should be addressed.
†
These authors contributed equally to this work.
Int. J. Mol. Sci. 2022, 23(12), 6726; https://doi.org/10.3390/ijms23126726
Submission received: 22 May 2022
/
Revised: 10 June 2022
/
Accepted: 14 June 2022
/
Published: 16 June 2022
(This article belongs to the Section Molecular Genetics and Genomics)
Abstract
:The barcode probe is a convenient and efficient tool for molecular cytogenetics. Tripidium arundinaceum, as a polyploid wild allied genus of Saccharum, is a useful genetic resource that confers biotic and abiotic stress resistance for sugarcane breeding. Unfortunately, the basic cytogenetic information is still unclear due to the complex genome. We constructed the Cot-20 library for screening moderately and highly repetitive sequences from T. arundinaceum, and the chromosomal distribution of these repetitive sequences was explored. We used the barcode of repetitive sequence probes to distinguish the ten chromosome types of T. arundinaceum by fluorescence in situ hybridization (FISH) with Ea-0907, Ea-0098, and 45S rDNA. Furthermore, the distinction among homology chromosomes based on repetitive sequences was constructed in T. arundinaceum by the repeated FISH using the barcode probes including Ea-0663, Ea-0267, EaCent, 5S rDNA, Ea-0265, Ea-0070, and 45S rDNA. We combined these probes to distinguish 37 different chromosome types, suggesting that the repetitive sequences may have different distributions on homologous chromosomes of T. arundinaceum. In summary, this method provide a basis for the development of similar applications for cytogenetic analysis in other species.
1. Introduction
Sugarcane (Saccharum spp.) is an annual or perennial C4 plant that is indigenous to tropical and subtropical regions and mainly used for sugar production and as a clean energy substrate [1]. The genus Saccharum and its related wild genus, including Miscanthus, Sclerostachya (Hack) A. Camus, Erianthus Michaux, and Narenga porphyrocoma (Hance) Bor, constitute the “Saccharum complex” [2]. These species are important wild germplasm resources to broaden the genetic base of sugarcane breeding [3]. Tripidium arundinaceum belongs to the genus Tripidium [4], which is one of the research hotspots for enhancing stress resistance in sugarcane breeding [5,6].
T. arundinaceum has the traits of drought tolerance, strong disease resistance, and wide adaptability. It is used as a parent material for basic hybridization by sugarcane breeders [7]. In the 1970s, the F1 generation of the cross between Badila and T. arundinaceum was produced in the Hainan sugarcane breeding station in China, but the second generation of the hybrid could not be bred due to the sterile F1 pollen. Until 2001, the bottleneck was broken by changing the methods of breeding [8]. Nowadays, a batch of excellent BC3, BC4, and BC5 materials has been bred [9]. Therefore, through the hybridization of sugarcane with the related genera, new varieties with high-yield and high-quality characteristics can be created, which are of great significance to sugarcane breeding [10]. Many researchers have successively used them as research materials to identify resistance, molecular identification, and chromosome genetics [11]. Meanwhile, the complex chromosomes, morphologically similar chromosomes, and poor chromosome markers make cytogenetic research difficult in T. arundinaceum [3,12].
Fluorescence in situ hybridization (FISH) is a cytogenetic technology in which the specific fluorescent-labeled probe is denatured and paired with the target sequence of chromosome through base complementarity pairing [13]. At present, FISH has been widely used in karyotype analysis, physical map construction, and genetic relationship analysis in plants [14]. With the development of cytogenetics technology, the application of large single-copy and low-copy probes has become more and more widespread [15]. Through GISH with the genomic DNA, D’Hont [5] and Georgy [6] found that the F1 is inherited in the way of n + n. However, the current research on chromosome inheritance focuses on quantitative changes, and there is no more precise chromosome identification technology for further precise research. Previous karyotyping studies based on the conventional technology and FISH with rDNA genes showed a high dependence on chromosome morphology and had a low degree of precision because of inadequate chromosome markers in T. arundinaceum [16]. These problems may impede our understanding of T. arundinaceum genome organization and evolution. Therefore, we look for repetitive sequences located on specific regions of chromosomes.
Contrary to the traditional in situ hybridization, Reverse Dot Blot (RDB) technology puts the probes dotting on a nylon membrane, makes these hybridized with the PCR products of the sample, and then observes the blot results of the hybridization through elution, antibody binding and color display [17]. This method can solve the disadvantage of conventional hybridization detection of a single sample and can detect the homology of multiple samples at the same time, which greatly improves the experimental efficiency [18]. Fritz [19] analyzed the variation in feeding host types of Ant. gambiae by quantifying responses by RDB. Huang Rongxian [20] used RDB to analyze the expression of MF6, which is a related gene that controls rapeseed fertility.
The content of medium and high-copy repetitive sequences is more than that of single copy sequences in plant genomes [21]. High-copy repeats renature is faster than low-copy sequences under the same condition. By interrupting the genome sequence, single-stranded DNA can be renatured into double-stranded DNA in plants. Therefore, the required repeats containing different copy numbers can be enriched, which are Cot-enriched repeats [22]. Cot enrichment of repetitive sequences is the fastest and most efficient for non-model plants without reference genomes [23]. Cot-enriched repetitive sequences are also used as probes in FISH, and most of the probes used in plant karyotyping research are mid to high-copy repetitive sequences [24]. In 2005, Wei used the Cot-1 DNA of Brassica napus as a probe to perform FISH and published chromosome karyotype with a marker for each chromosome for the first time [25]. Since then, Cot technology has been used to enrich repetitive sequences and mapped plant chromosomal karyotypes in different plants.
In this study, we construct a Cot-20 repetitive sequence library of T. arundinaceum. Screening the library by FISH, we can analyze the distribution of medium and high-repetitive sequences in T. arundinaceum. The study of repetitive sequences is of great significance for exploring the origin and evolution and revealing the infiltration of genetic material in the process of polyploidization.
2. Results
2.1. Cloning of Repetitive DNA Library from T. Arundinaceum
gDNA of T. arundinaceum was extracted using a CTAB technology, and a clear single band was detected for the digestion (Lane 1 and 2 in Figure 1). gDNA digested by DNaseI appeared 50~1500 bp dispersed painting, and it focused on 100~300 bp (Lanes 3 to 4 in Figure 1).
To obtain a suitable renaturation time, Cot-1, Cot-20, Cot-60, and Cot-100 were used for screening repetitive sequences. Reverse Dot Blot (RDB) was performed using T. arundinaceum gDNA as a probe and the 45S rDNA plasmid was a positive control. We can find different renaturation times for enriching different copy numbers of repeat sequences. The shorter the renaturation time, the more medium and high copy numbers are obtained. The results showed that Cot-1 enriched with the highest number of high copies, and Cot-20 enriched with the highest number of medium copies. The results of FISH showed that the high-copy sequence was located at both ends of all chromosomes and that intermediate-copy sequences showed a high degree of diversity, whereas the low-copy sequence showed no signal (Figure 2). Therefore, we selected the Cot-20 library for subsequent study based on the suitable renaturation and sequence of copies.
2.2. FISH and Blast for Barcode Selection
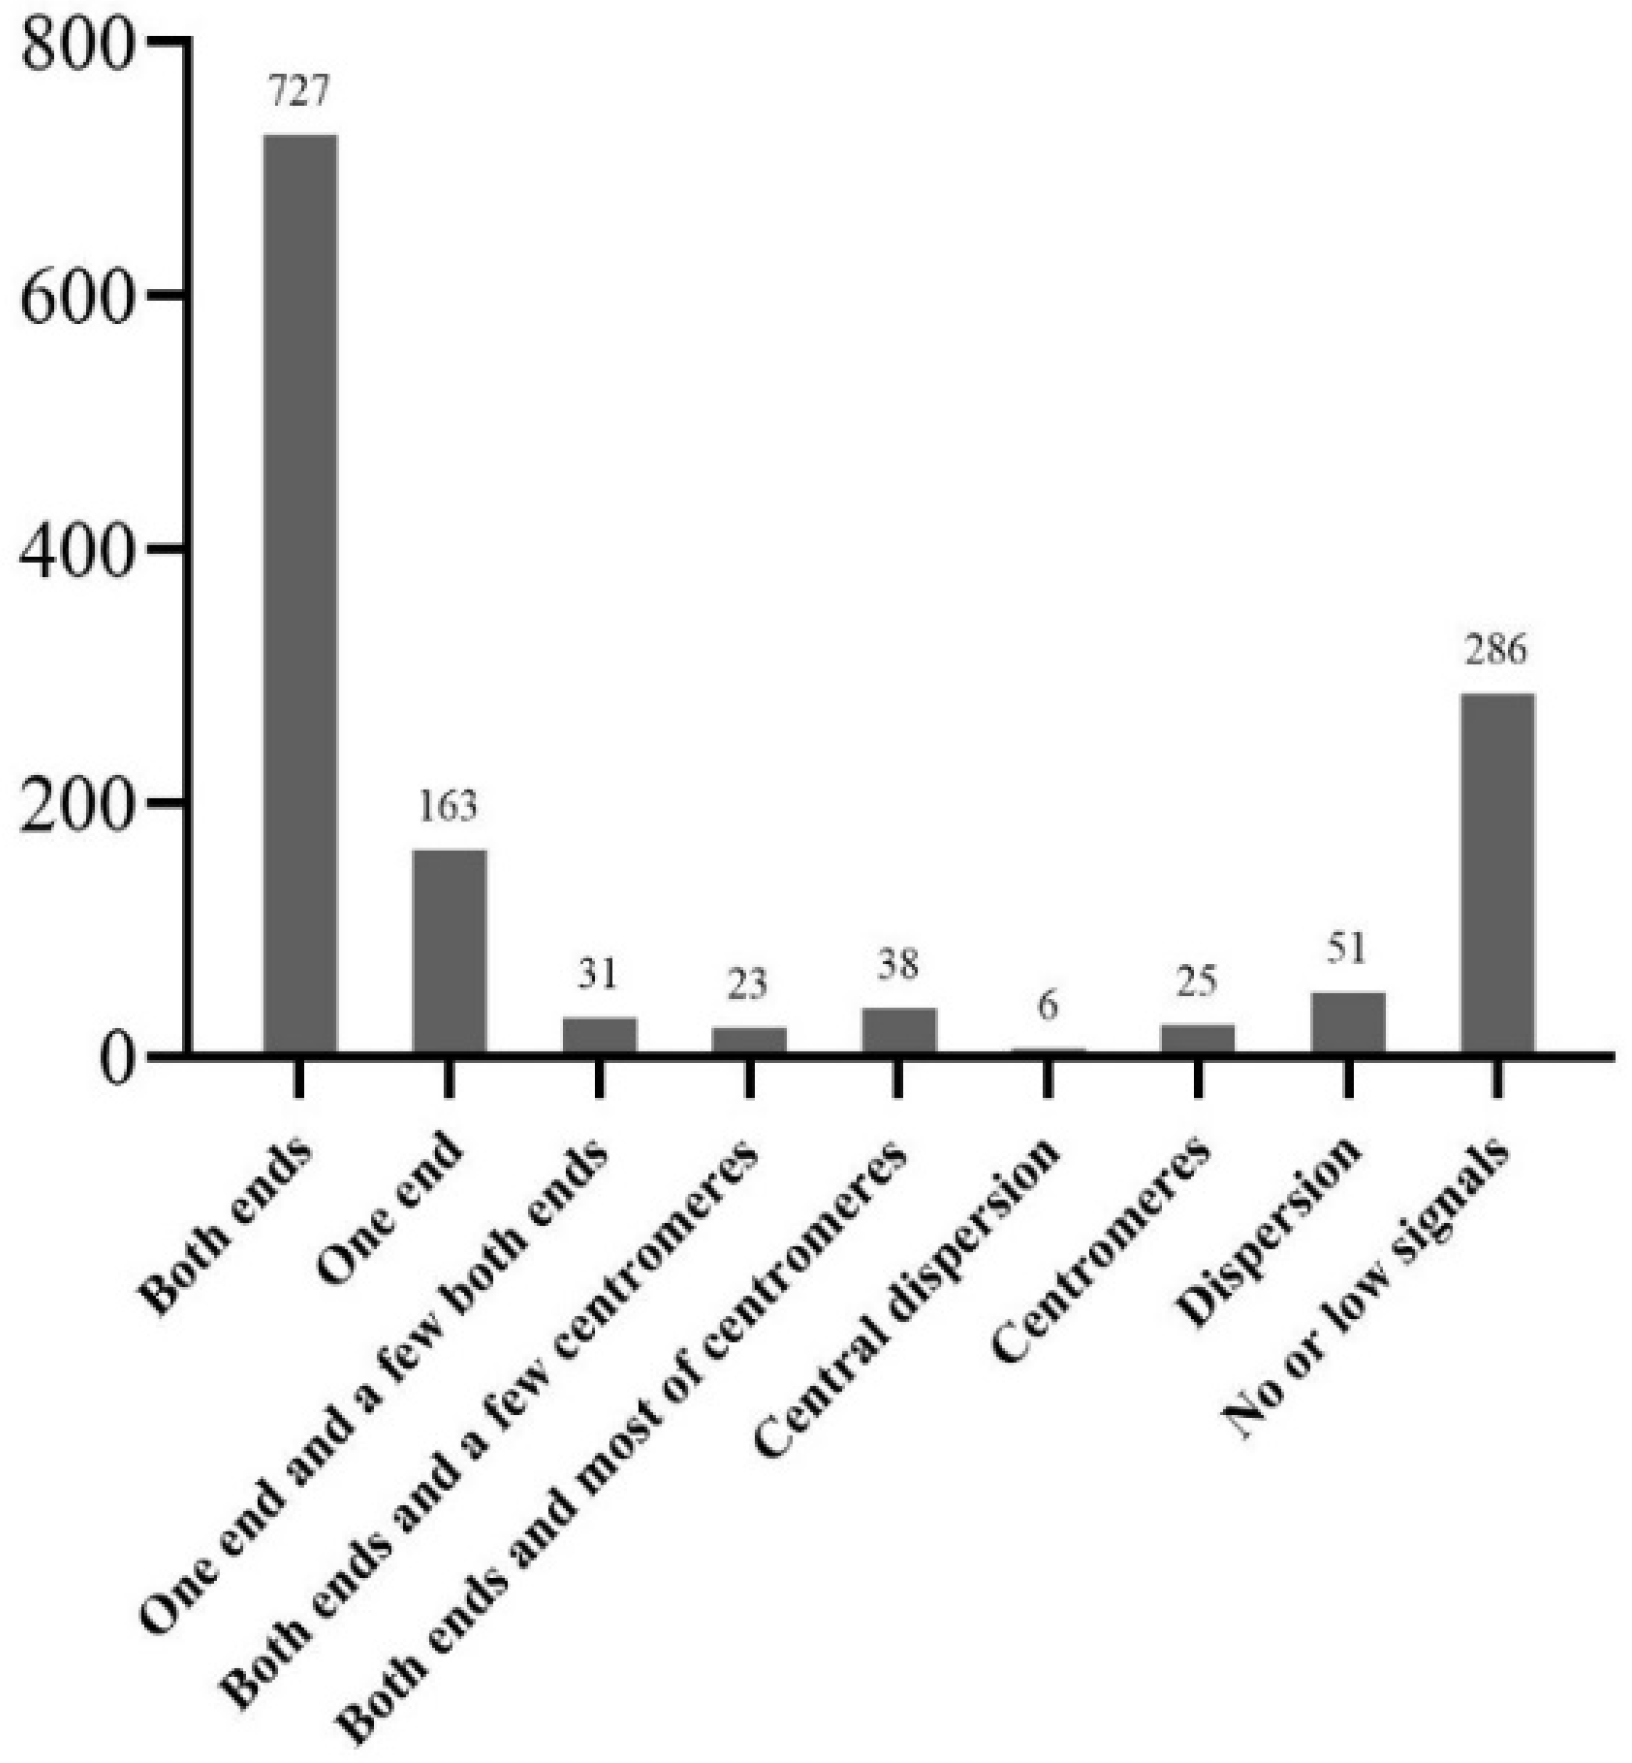
The Cot-20 library was enriched for a large number of the T. arundinaceum genome, and 1350 pre-probes were cloned for further FISH localization analysis. These probes were classified into nine types according to their location on the T. arundinaceum chromosome. Among them, 727 fragments showed signals at both ends of all chromosomes (Figure 3A); 163 fragments showed signals at one end of partly chromosomes (Figure 3B); 286 fragments showed no or low signals (Figure 3I). The other types were varied and located at telomeres, centromeres, or diffusely distributed (Figure 4). The results indicated that the Cot-20 library provided sufficient chromosomal markers for further chromosomal identification. Finally, the barcode probe consisted of six probes from FISH and blasted to sorghum, 45S rDNA, and 5S rDNA (Table S1).
2.3. Karyotyping Analysis Based on the Barcode
Each barcode of the repetitive sequence will be labeled with either biotin (green) or digoxigenin (red), respectively. A group of two probes was hybridized in the same metaphase cell at each repeated round of hybridization. According to the combination regions and intensity of signals (Figure 5), we can find that they have weak signals, obvious signals, and diverse signal sites. Each type of chromosome was labeled by the specific barcode; then, we sorted the difference.
The probe Ea-0907 (green) was signaled on various types of regions, in which some signals were located at one end or both ends, and centromere or ends. Simultaneously, Ea-0098 and 45S rDNA (red) were located at the centromere-proximal regions (Figure 6). Through the statistics of the results (Table 1), we found that chromosomes can be divided into 10 types based on the characteristic barcode (Ea-0907, Ea-0098, 45S rDNA). However, we probably only marked eight sets of homologous chromosome karyotype (2, 3, 4, 5, 6, 7, 8, and 9 types). Type 5 has only five chromosomes with a strong green signal at one end and a weak green signal at the other end. Similarly, type 8 has only five chromosomes with both ends and a weak green signal in the middle. Furthermore, there are 12 chromosomes with a strong green signal at one end in type 1 and two chromosomes with a green signal at the middle in type 10.
2.4. Chromosomal Fingerprint of T. Arundinaceum Revealed by Multiple FISH
Further on, through three rounds of fluorescence in situ hybridization, seven probes of different repetitive sequences were positioned on the same metaphase cell, and the chromosomes were numbered (Figure 7). Among them, the positions of the upper and lower ends of the same chromosome were all uniform (e.g., the upper part on the left, the lower part on the right in the slanted chromosomes). The probes used for the first hybridization were Ea-0663 (red), 5S rDNA (green), and 45S rDNA (green). The probes for the second hybridization were Ea-0267 (green) and Eacent (Probes located at the centromere of T. arundinaceum chromosome are called Eacent) (red). The probes for the third hybridization were Ea-0070 (green) and Ea-0265 (red).
According to the statistical results (Figure 8A), the 60 chromosomes of T. arundinaceum were classified into 37 different marker types by seven probes. Among them, there are 23 marker types that can distinguish as a single chromosome separately; two chromosomes in eight groups shared one marker type (9 and 38; 13 and 17; 14 and 59; 15 and 60; 18 and 54; 24 and 50; 34 and 36; 55 and 58), three chromosomes in three groups shared the same marker type (12,23,43; 16, 22, 45; 28, 30, 46), and four chromosomes in three groups shared the same marker type (7,42,44,57; 21,33,35,53; 25,29,39,49).
5S rDNA and 45S rDNA were used to analyze to assess the ploidy level. We found that each special FISH signal barcode was detected on the homology chromosomes with a 5S rDNA signal in T. arundinaceum (Figure 8B). This random distribution indicated that the homology chromosomes also have distinctions. Meanwhile, the six types were detected on homology chromosomes with 45S rDNA signals in T. arundinaceum (Figure 8C).
3. Discussion and Conclusions
FISH is an indispensable technique in molecular cytogenetics and genetics [26]. Compared to other methods, FISH will need less cost and provide direct evidence involving cytogenetic and genome research. Compared to diploid species, polyploidy has a different way of genome evolution and a higher level of extensive gene expression. Polyploid plants have a stronger ability to adapt to the environment. The additional effects of polyploidy and expression mechanism provide value for crop improvement, evolution and inheritance. The polyploid genome abounds mass high-copy repetitive sequences, such as transposons, retrotransposons, telomere repeats, satellite DNA, etc. [21]. Polyploid events, caused by whole genome duplications (WGDs), are often accompanied by the tandem duplication of repetitive sequences, the repeated segmental duplication, or retrotransposition in plants. [27]. This explosive transformation could be caused by the variation of regulation or modification of epigenetics [27,28]. The rapid advance of the genome and molecular cytogenetic developed mass methods in designing and screening probes. Unfortunately, the contribution of repetitive sequences is uncertain. Based on the polyploid or allopolyploid genomes, the expensive price of probe synthesis and genome sequencing impedes the development of FISH, and more important is the disordered distribution of repetitive sequence [28,29]. For studying the function of repetitive sequences, researchers have developed a variety of methods, such as cDNA libraries, methylation filter libraries, and cot enrichment. The barcode probe of the repetitive sequence is a strong and effective method, which can reveal the regions of repetitive sequences, the copies of species, and the chromosomal karyotypes [30]. Meanwhile, the repetitive sequences enriched by Cot DNA can be used as blocking DNA during hybridization and as the repetitive sequence libraries of barcode probes yet.
It is of great significance for tracking chromosome inheritance and identifying the chromosomes in T. arundinaceum [31]. The non-homologous chromosomes inherited in the generations can be effectively distinguished, and the origin and composition of the chromosomes can be displayed [32]. In this study, by a screening of the Cot-20 library, the repetitive sequence barcode probes were used to distinguish eight chromosomes of T. arundinaceum. Due to the lack of the other barcode probes that can be labeled on the chromosome arm or that can mark a small number of signals individually, the karyotype of the whole T. arundinaceum genome has not been established. This method still provides a reference for the genome on molecular cytogenetic of the polyploid or allopolyploid plants.
Sugarcane is not only an important sugar-yielding crop, but it is also the representative of the polyploid of high copies model. Crossing with the wild species, resistance can be availably introgressed to sugarcane. T. arundinaceum, a poaceae of neo-polyploid species, as a breeding wild species with good resistance to sugarcane, undergoes the polyploidization event that evolved from diploid ancestors [27,33,34]. However, during this process, it is uncertain whether rearrangements or other parental chromosomes merge between homologous. Even in previous studies, the repetitive sequences under homologous chromosomes differed in diploid groups or sub-genomic groups, such as sorghum [35], potato [36], miscanthus [37], strawberry [38], etc. However, for neo-polyploid, it is an enigma still. We analyzed the different copy numbers from the Cot-20 library and then revealed the differences in repetitive sequence among homology. Using repeated FISH of the same chromosome, 37 special barcodes were located from seven repetitive sequence probes and the difference of repetitive sequences on the T. arundinaceum homology chromosomes. These differences may imply that under the polyploidization events, among homology, duplication is often accompanied by variation of the difference ratio to the expansion of gene or the random insertion of the transposon, etc. [39,40]. That as a possible reason leads to diploidization or a pre-subgenome.
4. Materials and Methods
4.1. Plant Material and DNA Extraction
T. arundinaceum (HN 92–105, 2n = 60) was provided by Hainan Sugarcane Breeding Station and grown in the greenhouse at Fujian Agriculture and Forestry University. Leaf tissues from these materials were ground in liquid nitrogen and stored at −80 °C. Total genomic DNA (gDNA) was extracted following an improved CTAB methodology [41].
4.2. Repetitive Sequence Libraries Preparation
The gDNA was digested by adding 0.005 U/μL DNase I; then, it was put at 15 °C for 2 h. The fragment size was checked by an agarose gel. Finally, they were marked with Dig-11-dUTP or Bio-11-dUTP dUTP.
The gDNA was renatured at 65 °C according to the renaturing time of T(s) = 1/M (mol/L), 20/M (mol/L), 60/M (mol/L), and 100/M (mol/L) (M is the final gDNA concentration (g/L) divided by 339 (g/mol)). Then, it was digested with S1 nuclease at 37 °C for 8 min. The enriched DNA sequences were added to a poly-A tail and cloned. The corresponding primers were designed by Primer 5.0, and the probes labeled with Dig-11-dUTP were used by PCR for hybridization.
4.3. Reverse Dot Blot Hybridization for Library Selection
All purified plasmids containing clone sequences were quantified in NanoVue PlusTM (GE Healthcare, Princeton, NJ, USA) and then diluted to a final concentration of 50 ng/μL. These plasmids were denatured by heating to 100 °C for 7 min and then quickly chilled in an ice/water for 10 min. The denatured plasmids were transferred onto the Amersham Hybond-NC nylon membrane (GE Healthcare, Life Sciences, Indianapolis, IN, USA). Then, 1 μL of each plasmid was spotted onto the membranes, and DNA was fixed to the membrane by UV crosslink using a StratalinkerTM UV Crosslinker (Stratagene, La Jolla, CA, USA). After fixation, the membrane underwent pre-hybridization for 30 min. The T. arundinaceum gDNA probe was labeled with digoxigenin-11-dUTP (DIG) using a DIG Nick Translation Kit (Roche Diagnostics). Hybridization was performed as described in the Instruction Manual of the DIG High Prime DNA Labeling and Detection Starter Kit I (Roche Diagnostics). Hybridization signals were subsequently detected and quantified by using the AxioVision measurement module of the Carl Zeiss Scope.A1 Imager fluorescent microscope (Carl Zeiss, Gottingen, Germany). Adobe Photoshop 6.0 was used to adjust the pictures.
4.4. Selection of the Barcode Probe from Cot-20 Library
In order to obtain a valid barcode sequence, we selected the sequences located at the centromeres, one end, and the two ends of the chromosome. From the sequencing results, we compared with the nucleotide database on the NCBI website to find the highest homology. Then, these sequences were compared with DNAMAN to obtain the conservative sequences as a candidate, and the corresponding 3 pairs of primer sequences were designed (Table 2). A 200–300 bp target band was obtained by amplifying the probe sequence using the genomic DNA of T. arundinaceum as the template.
Each 20 μL PCR reaction included DNA template, 1× LA Buffer, 10 μM of the primer, 20 μM dNTP and 0.5 U LA Taq. Meanwhile, the PCR conditions were 95 °C for 3 min, followed by 35 cycles of 95 °C for 20 s, 54 °C for 20 s, 72 °C for 30 s and final incubation at 72 °C for 6 min.
4.5. Fluorescence In Situ Hybridization
We selected the thick root tips according to the enzymatic method with some adjustment [42]. The section of root tips containing dividing cells was dissected and digested in an enzyme mixture (1% pectolyase Y23, 2% pectinase, 2% RS and 4% cellulase Onozuka R-10) for 4 h at 37 °C. After digestion, the root sections were washed in water and then washed in Carnoy’s fixative (ethanol: acetic acid = 3: 1) two times briefly. The root sections were carefully broken by using a pipette tip. The cell suspension was dropped onto glass slides, and another 10 μL acetic acid was dropped when the slide almost dried. The prepared slides were placed at room temperature overnight to make the chromosome aging. We put the slides in 2× SSC three times in 3 min. The slides were dehydrated in 75% and 100% ethanol each for 3 min; then, we added 70% FD at 70 °C to denature. The slides were dried, and we added the probes for hybridization.
Supplementary Materials
The following supporting information can be downloaded at: https://www.mdpi.com/article/10.3390/ijms23126726/s1.
Author Contributions
J.C. and L.L. performed the experiments and wrote the manuscript. Z.Y. and J.L. performed the experiments and analyzed the data. M.Z. and Z.D. designed the experiments. All authors have read and agreed to the published version of the manuscript.
Funding
This research was funded by the Special Fund for Science and Technology Innovation of Fujian Agriculture and Forestry University (KFA17626A, KFA20082A, KHF210001A). The funders had no role in the study design, data collection, analysis, decision to publish, or preparation of the manuscript.
Institutional Review Board Statement
Not applicable.
Data Availability Statement
Not applicable.
Conflicts of Interest
The authors declare that the research was conducted in the absence of any commercial or financial relationships that could be construed as a potential conflict of interest.
References
- Lam, E.; Shine, J., Jr.; Da Silva, J.; Lawton, M.; Bonos, S.; Calvino, M.; Carrer, H.; Silva-Filho, M.C.; Glynn, N.; Helsel, Z. Improving sugarcane for biofuel: Engineering for an even better feedstock. Gcb Bioenergy 2009, 1, 251–255. [Google Scholar] [CrossRef]
- Amalraj, V.A.; Balakrishnan, R.; Jebadhas, A.W.; Balasundaram, N. Constituting a core collection of Saccharum spontaneum L. and comparison of three stratified random sampling procedures. Genet. Resour. Crop Evol. 2006, 53, 1563–1572. [Google Scholar] [CrossRef]
- Singh, R.; Singh, R.; Singh, S.; Sharma, M. Identification of sugarcane microsatellites associated to sugar content in sugarcane and transferability to other cereal genomes. Euphytica 2011, 182, 335–354. [Google Scholar] [CrossRef]
- Qing, C.; Jiancheng, W.; Yuanhong, F.; Liping, W.; Li, M. Chromosome analysis of Saccharum L. and related plants. Xi Nan Nong Ye Xue Bao Southwest China J. Agric. Sci. 2002, 15, 16–19. [Google Scholar]
- D’Hont, A.; Rao, P.; Feldmann, P.; Grivet, L.; Islam-Faridi, N.; Taylor, P.; Glaszmann, J.-C. Identification and characterisation of sugarcane intergeneric hybrids, Saccharum officinarum × Erianthus arundinaceus, with molecular markers and DNA in situ hybridisation. Theor. Appl. Genet. 1995, 91, 320–326. [Google Scholar] [CrossRef]
- Piperidis, G.; Christopher, M.J.; Carroll, B.J.; Berding, N.; D’Hont, A. Molecular contribution to selection of intergeneric hybrids between sugarcane and the wild species Erianthus arundinaceus. Genome 2000, 43, 1033–1037. [Google Scholar] [CrossRef]
- Cheavegatti-Gianotto, A.; de Abreu, H.M.C.; Arruda, P.; Bespalhok Filho, J.C.; Burnquist, W.L.; Creste, S.; di Ciero, L.; Ferro, J.A.; de Oliveira Figueira, A.V.; de Sousa Filgueiras, T. Sugarcane (Saccharum officinarum): A reference study for the regulation of genetically modified cultivars in Brazil. Trop. Plant Biol. 2011, 4, 62–89. [Google Scholar] [CrossRef] [Green Version]
- Zhang, H.; He, L.; Zhong, H.; Li, F.; He, S.; Yang, Q. Identification of intergeneric hybrids between Saccharum spp. and Erianthus fulvus with ITSs. Afr. J. Biotechnol. 2009, 8, 9. [Google Scholar]
- Qi, Y.; Deng, H.; Li, Q. Advance in utilization of sugarcane germplasm in China mainaland. Crop Res. 2012, 26, 443–446. [Google Scholar]
- Cai, Q.; Aitken, K.; Fan, Y.; Piperidis, G.; Jackson, P.; McIntyre, C.L. A preliminary assessment of the genetic relationship between Erianthus rockii and the “Saccharum complex” using microsatellite (SSR) and AFLP markers. Plant Sci. 2005, 169, 976–984. [Google Scholar] [CrossRef]
- Chen, X.; Deng, H.; Chen, Y. Utilization of Badila in the breeding of YC-series parents and new varieties of sugarcane. Sugarcane Canesugar 2010, 6. Available online: https://www.semanticscholar.org/paper/Utilization-of-Badila-in-the-Breeding-of-YC-Series-Yong-sheng/f1ad3322d47ec712f9dad1773ce3936fb457e8c1 (accessed on 22 May 2022).
- Lu, Y.; D’Hont, A.; Walker, D.; Rao, P.; Feldmann, P.; Glaszmann, J.-C. Relationships among ancestral species of sugarcane revealed with RFLP using single copy maize nuclear probes. Euphytica 1994, 78, 7–18. [Google Scholar] [CrossRef]
- Swiger, R.R.; Tucker, J.D. Fluorescence in situ hybridization: A brief review. Environ. Mol. Mutagen. 1996, 27, 245–254. [Google Scholar] [CrossRef]
- Chaudhary, H.; Sood, V.; Tayeng, T.; Kaila, V.; Sood, A. Molecular cytogenetics in physical mapping of genomes and alien introgressions. In Biology and Breeding of Food Legumes; CABI: Oxfordshire, UK, 2011; pp. 131–146. [Google Scholar]
- Yu, X.; Yang, D.; Guo, C.; Gao, L. Plant phylogenomics based on genome-partitioning strategies: Progress and prospects. Plant Divers. 2018, 40, 158–164. [Google Scholar] [CrossRef]
- Colina, J.G.; Kosky, R.G.; Ortega, I.H.; Tejeda, M.; Pérez, L.P.; Pérez, B.C.; Vega, M.R.; Seijo, M.F. Plants regeneration of a papaya hybrid (IBP 42-99) from callus obtained from apexes of in vitro plants. Biotecnol. Veg. 2004, 4, 347–354. [Google Scholar]
- Saiki, R.K.; Walsh, P.S.; Levenson, C.H.; Erlich, H.A. Genetic analysis of amplified DNA with immobilized sequence-specific oligonucleotide probes. Proc. Natl. Acad. Sci. USA 1989, 86, 6230–6234. [Google Scholar] [CrossRef] [Green Version]
- Ou, Z.-Y.; Liu, N.; Chen, C.-J.; Cheng, G.; He, Y.-S. Rapid and accurate genotyping of YMDD motif variants in the hepatitis B virus genome by an improved reverse dot blot method. J. Clin. Microbiol. 2005, 43, 5685–5689. [Google Scholar] [CrossRef] [Green Version]
- Fritz, M.L.; Miller, J.R.; Bayoh, M.N.; Vulule, J.M.; Landgraf, J.R.; Walker, E.D. Application of a reverse dot blot DNA-DNA hybridization method to quantify host-feeding tendencies of two sibling species in the Anopheles gambiae complex. Med. Vet. Entomol. 2013, 27, 398–407. [Google Scholar] [CrossRef] [Green Version]
- Huang, R.; Tang, A.; Guo, S.; Niu, Y. The acquisition and expression analysis of polygalacturonase gene MF6 related to the fertility of Brassica napus L. Mol. Plant Breed. 2012, 10, 298–304. [Google Scholar]
- Miklos, G. Localized highly repetitive DNA sequences in vertebrate and invertebrate genomes. Mol. Evol. Genet. 1985, 6, 241–321. [Google Scholar]
- Zhang, L.; Xu, C.; Yu, W. Cloning and characterization of chromosomal markers from a Cot-1 library of peanut (Arachis hypogaea L.). Cytogenet. Genome Res. 2012, 137, 31–41. [Google Scholar] [CrossRef]
- Tang, X.; Szinay, D.; Lang, C.; Ramanna, M.S.; van der Vossen, E.; Datema, E.; Lankhorst, R.K.; de Boer, J.; Peters, S.A.; Bachem, C. Cross species BAC-FISH painting of the tomato and potato chromosome 6 reveals undescribed chromosomal rearrangements. Genetics 2008, 180, 1319–1328. [Google Scholar] [CrossRef] [Green Version]
- Shi, F.; Endo, T.R. Genetic induction of chromosomal rearrangements in barley chromosome 7H added to common wheat. Chromosoma 2000, 109, 358–363. [Google Scholar] [CrossRef]
- Wei, W.H.; Zhao, W.P.; Wang, L.J.; Chen, B.; Li, Y.C.; Song, Y.C. Karyotyping of Brassica napus L. based on Cot-1 DNA banding by fluorescence in situ hybridization. J. Integr. Plant Biol. 2005, 47, 1479–1484. [Google Scholar] [CrossRef]
- Jiang, J. Fluorescence in situ hybridization in plants: Recent developments and future applications. Chromosome Res. 2019, 27, 153–165. [Google Scholar] [CrossRef]
- Zhang, K.; Wang, X.; Cheng, F. Plant polyploidy: Origin, evolution, and its influence on crop domestication. Hortic. Plant J. 2019, 5, 231–239. [Google Scholar] [CrossRef]
- Zhang, J.; Zhang, X.; Tang, H.; Zhang, Q.; Hua, X.; Ma, X.; Zhu, F.; Jones, T.; Zhu, X.; Bowers, J. Allele-defined genome of the autopolyploid sugarcane Saccharum spontaneum L. Nat. Genet. 2018, 50, 1565–1573. [Google Scholar] [CrossRef] [Green Version]
- Han, Y.; Zhang, T.; Thammapichai, P.; Weng, Y.; Jiang, J. Chromosome-specific painting in Cucumis species using bulked oligonucleotides. Genetics 2015, 200, 771–779. [Google Scholar] [CrossRef] [Green Version]
- Liu, S.; Zheng, J.; Migeon, P.; Ren, J.; Hu, Y.; He, C.; Liu, H.; Fu, J.; White, F.F.; Toomajian, C. Unbiased k-mer analysis reveals changes in copy number of highly repetitive sequences during maize domestication and improvement. Sci. Rep. 2017, 7, 42444. [Google Scholar] [CrossRef] [Green Version]
- Zhou, S.; Gao, Y.; Zhang, B.; Huang, Y.; Duan, W.; Yang, C.; Wang, Z.; Zhang, G. Genetic analysis of wild specific genetic loci in the hybridization process for intergeneric hybrid complex (Erianthus arundinaceus × Saccharum spontaneum). J. Plant Genet. Resour. 2019, 20, 718–727. [Google Scholar]
- Sosnikhina, S.; Mikhailova, E.; Tikholiz, O.; Priyatkina, S.; Smirnov, V.; Voilokov, A.; Fedotova, Y.S.; Kolomiets, O.; Bogdanov, Y.F. Genetic collection of meiotic mutants of rye Secale cereale L. Russ. J. Genet. 2005, 41, 1071–1080. [Google Scholar] [CrossRef]
- Haszprunar, G. The types of homology and their significance for evolutionary biology and phylogenetics. J. Evol. Biol. 1992, 5, 13–24. [Google Scholar] [CrossRef]
- Huang, Y.; Chen, H.; Han, J.; Zhang, Y.; Ma, S.; Yu, G.; Wang, Z.; Wang, K. Species-specific abundant retrotransposons elucidate the genomic composition of modern sugarcane cultivars. Chromosoma 2020, 129, 45–55. [Google Scholar] [CrossRef]
- Swaminathan, K.; Alabady, M.S.; Varala, K.; De Paoli, E.; Ho, I.; Rokhsar, D.S.; Arumuganathan, A.K.; Ming, R.; Green, P.J.; Meyers, B.C. Genomic and small RNA sequencing of Miscanthus × giganteus shows the utility of sorghum as a reference genome sequence for Andropogoneae grasses. Genome Biol. 2010, 11, R12. [Google Scholar] [CrossRef] [PubMed] [Green Version]
- Biruykova, V.; Khromova, L.; Beketova, M.; Shmiglya, I.; Kirsanova, S.; Khavkin, E.E. Use of moderately repetitive sequences in the plant genome in potato breeding and seed-growing. In Scientific Supply and Innovative Development of Potato Culture, Moscow (Russian Federation); ARDIPP, 2008; Available online: https://agris.fao.org/agris-search/search.do?recordID=RU2008000325 (accessed on 22 May 2022).
- Hodkinson, T.R.; Chase, M.W.; Takahashi, C.; Leitch, I.J.; Bennett, M.D.; Renvoize, S.A. The use of DNA sequencing (ITS and trnL-F), AFLP, and fluorescent in situ hybridization to study allopolyploid Miscanthus (Poaceae). Am. J. Bot. 2002, 89, 279–286. [Google Scholar] [CrossRef] [PubMed]
- Kang, C.; Liu, Z. Global identification and analysis of long non-coding RNAs in diploid strawberry Fragaria vesca during flower and fruit development. BMC Genom. 2015, 16, 815. [Google Scholar] [CrossRef] [Green Version]
- Innes, R.W.; Ameline-Torregrosa, C.; Ashfield, T.; Cannon, E.; Cannon, S.B.; Chacko, B.; Chen, N.W.; Couloux, A.; Dalwani, A.; Denny, R. Differential accumulation of retroelements and diversification of NB-LRR disease resistance genes in duplicated regions following polyploidy in the ancestor of soybean. Plant Physiol. 2008, 148, 1740–1759. [Google Scholar] [CrossRef] [Green Version]
- Murat, F.; Xu, J.-H.; Tannier, E.; Abrouk, M.; Guilhot, N.; Pont, C.; Messing, J.; Salse, J. Ancestral grass karyotype reconstruction unravels new mechanisms of genome shuffling as a source of plant evolution. Genome Res. 2010, 20, 1545–1557. [Google Scholar] [CrossRef] [Green Version]
- Doyle, J. DNA protocols for plants. In Molecular Techniques in Taxonomy; Springer: Berlin/Heidelberg, Germany, 1991; pp. 283–293. [Google Scholar]
- Ji, H.Y.; Yun, W.J.; Mou, L.S.; Hu, D.Z.; Cheng, F.; Shuan, L.Y.; Wei, L.Q.; Xing, H.Z.; Kai, C.R. Chromosome genetic and karyotype analysis of F1 hybrids between Saccharum officinarum and Erianthus arundinaceus based on GISH. J. Plant Genet. Resour. 2014, 15, 394–398. [Google Scholar]
Figure 1.
The electrophoresis result of T. arundinaceum genome DNA and interrupted genome DNA. M1: D15,000 + 2000 bp Marker; 1: Hainan 92–77 genome DNA; 2: Hainan 92–105 genome DNA; 3: The digested product of genome DNA from Hainan 92–77; 4: The digested product of genome DNA from Hainan 92–105; M2: 100 bp Marker.

Figure 2.
The signal expression to the different copied probes. (A): Two ends of chromosomes; (B): The end of a part of chromosomes; (C): No obvious signal. Scale bars = 5 μm.
Figure 2.
The signal expression to the different copied probes. (A): Two ends of chromosomes; (B): The end of a part of chromosomes; (C): No obvious signal. Scale bars = 5 μm.

Figure 3.
FISH result of the different probes. (A): Two ends of chromosomes; (B): The end of a part of chromosomes; (C): The end of most chromosomes and two ends of a part of chromosomes; (D): Two ends of chromosomes and the centromeric region of a part of chromosomes; (E): Two ends of chromosomes and the centromeric region of most chromosomes; (F): Diffuse distribute on all middle part of chromosomes; (G): The centromeric region of most chromosomes; (H): Diffuse distribute on all chromosomes; (I): No obvious signal. Scale bars = 5 μm.

Figure 4.
The statistic result of various types of the probe sequence.

Figure 5.
The result of repeat FISH. (A): The first round of FISH results; (B): The second round of FISH results. Scale bars = 5 μm.
Figure 5.
The result of repeat FISH. (A): The first round of FISH results; (B): The second round of FISH results. Scale bars = 5 μm.

Figure 6.
Chromosome karyotype of Hainan 92–105. Scale bars = 5 μm.

Figure 7.
The result of three repeated FISH. (A): The first round of FISH results; (B): The second round of FISH results; (C): The third round of FISH results. Scale bars = 5 μm.
Figure 7.
The result of three repeated FISH. (A): The first round of FISH results; (B): The second round of FISH results; (C): The third round of FISH results. Scale bars = 5 μm.

Figure 8.
Distribution of the repetitive sequences in different chromosomes of T. arundinaceum. (A) The location of seven probes (Ea-0663, 5S rDNA, 45S rDNA, Ea-0267, Eacent, Ea-0070 and Ea-0265) on the chromosomes of T. arundinaceum; (B) The distribution of Ea-0663, Ea-0070, Ea-0267, and Ea-0265 on six homologous chromosomes that carried 5S rDNA loci; (C) The distribution of Ea-0663, EA-0070, Ea-0267, and Ea-0265 on six homologous chromosomes that carried 45S rDNA loci.


Table 1.
The different types of chromosomes based on repetitive sequence probes.
| Chromosome Number | 1 | 2 | 3 | 4 | 5 | 6 | 7 | 8 | 9 | 10 |
|---|---|---|---|---|---|---|---|---|---|---|
| Chromosome type |  |  |  |  |  |  |  |  |  |  |
| number | 12 | 6 | 6 | 6 | 5 | 6 | 6 | 5 | 6 | 2 |
Note: Ea-0907: The end of the chromosome or centromeric region (green), Ea-0098: centromeric region (red), 45S rDNA: The end of the chromosome (red). Scale bars = 5 μm.
Table 2.
The designed primer sequence by comparing.
| Primer Name | Primer Sequence (5′—3′) |
|---|---|
| EaCent-F | CGGTTTGTTTGGAGACTTGC |
| EaCent-R | GCCCTAAATGATTTCTGAGCCTAT |
| EaST1-F | TTTTGGGACTCAGTTTCATTTC |
| EaST1-R | TGAAGACGCTAGAGTAGTATTTGTG |
| EaST2-F | TTACCATAAGCCACAAATC |
| EaST2-R | CATCTAAATACTCCACCCTAACT |
Publisher’s Note: MDPI stays neutral with regard to jurisdictional claims in published maps and institutional affiliations. |
© 2022 by the authors. Licensee MDPI, Basel, Switzerland. This article is an open access article distributed under the terms and conditions of the Creative Commons Attribution (CC BY) license (https://creativecommons.org/licenses/by/4.0/).
Share and Cite
MDPI and ACS Style
Chai, J.; Luo, L.; Yu, Z.; Lei, J.; Zhang, M.; Deng, Z. Repetitive Sequence Barcode Probe for Karyotype Analysis in Tripidium arundinaceum. Int. J. Mol. Sci. 2022, 23, 6726. https://doi.org/10.3390/ijms23126726
AMA Style
Chai J, Luo L, Yu Z, Lei J, Zhang M, Deng Z. Repetitive Sequence Barcode Probe for Karyotype Analysis in Tripidium arundinaceum. International Journal of Molecular Sciences. 2022; 23(12):6726. https://doi.org/10.3390/ijms23126726
Chicago/Turabian StyleChai, Jin, Ling Luo, Zehuai Yu, Jiawei Lei, Muqing Zhang, and Zuhu Deng. 2022. "Repetitive Sequence Barcode Probe for Karyotype Analysis in Tripidium arundinaceum" International Journal of Molecular Sciences 23, no. 12: 6726. https://doi.org/10.3390/ijms23126726
Note that from the first issue of 2016, this journal uses article numbers instead of page numbers. See further details here.