Article

Chromosomal Characterization of Tripidium arundinaceum Revealed by Oligo-FISH

1
National Engineering Research Center for Sugarcane, Fujian Agriculture and Forestry University, Fuzhou 350002, China
2
Key Lab of Sugarcane Biology and Genetic Breeding, Ministry of Agriculture, Fujian Agriculture and Forestry University, Fuzhou 350002, China
3
State Key Laboratory for Protection and Utilization of Subtropical Agro-bioresources, Guangxi University, Nanning 530004, China
4
Institute of Nanfan & Seed Industry, Guangdong Academy of Sciences, Guangzhou 510316, China
*
Authors to whom correspondence should be addressed.
Int. J. Mol. Sci. 2021, 22(16), 8539; https://doi.org/10.3390/ijms22168539
Submission received: 3 July 2021 / Revised: 6 August 2021 / Accepted: 7 August 2021 / Published: 9 August 2021
(This article belongs to the Special Issue Cytomolecular Organisation of the Nuclear Genome)

Abstract

:
Sugarcane is of important economic value for producing sugar and bioethanol. Tripidium arundinaceum (old name: Erianthus arundinaceum) is an intergeneric wild species of sugarcane that has desirable resistance traits for improving sugarcane varieties. However, the scarcity of chromosome markers has hindered the cytogenetic study of T. arundinaceum. Here we applied maize chromosome painting probes (MCPs) to identify chromosomes in sorghum and T. arundinaceum using a repeated fluorescence in situ hybridization (FISH) system. Sequential FISH revealed that these MCPs can be used as reliable chromosome markers for T. arundinaceum, even though T. arundinaceum has diverged from maize over 18 MYs (million years). Using these MCPs, we identified T. arundinaceum chromosomes based on their sequence similarity compared to sorghum and labeled them 1 through 10. Then, the karyotype of T. arundinaceum was established by multiple oligo-FISH. Furthermore, FISH results revealed that 5S rDNA and 35S rDNA are localized on chromosomes 5 and 6, respectively, in T. arundinaceum. Altogether, these results represent an essential step for further cytogenetic research of T. arundinaceum in sugarcane breeding.

1. Introduction

Sucrose is produced from two major crops, sugarcane (Saccharum spp.) and sugar beet (Beta vulgaris). Sugarcane, however, accounts for the vast majority of global sugar production and provides feedstocks for bio-energy production. For sugarcane breeding, interspecific hybridization is a powerful way to enhance resistance but also provides unexpected benefits in increasing yield and improving ratooning ability and adaptability [1]. S. spontaneum (2n = 40–128), which for more than a century has played a major role in sugarcane breeding, has been widely applied to improve the resistance of sugarcane cultivars. Simultaneously, E. arundinaceum (2n = 60, x = 10) is also used for sugarcane breeding due its high biomass productivity, superior ratooning ability, and exceptional adaptability to biotic and abiotic stresses [2]. Most recently, Lloyd Evans et al. placed E. arundinaceum to the Tripidium genus based on the whole chloroplast genome [3]. Thus, E. arundinaceum was referred to T. arundinaceum accordingly. Currently, many studies have reported cytogenetic research on T. arundinaceum, especially on the chromosome inheritance of the hybrids between sugarcane and T. arundinaceum [4,5,6]. However, basic cytogenetic information such as the karyotype, and the precise chromosome contribution of T. arundinaceus in interspecific hybridization, could not be addressed due to lack of effective cytogenetic markers to identify the individual chromosomes.
FISH is a powerful tool that has widely answered the cytogenetics issues, such as karyotype, chromosome recombination, genetic relationship of the related species, and chromosome transmission [7]. Successful and efficient FISH needs a reliable probe, such as genomic DNA (gDNA), repetitive sequences, bacterial artificial chromosome (BAC) clones, and oligonucleotides (oligos) [7,8,9]. Of these, oligos are a recent development and application of a probe that can be computationally identified according to sequencing genome data [7,10]. Oligo probes now are classified as repetitive oligonucleotide (repetitive DNA sequence), chromosome barcode (a specific chromosomal region), and chromosome painting (an entire chromosome region), and have been successfully applied in many plants, i.e., rice [11], wheat [12], citrus [13], maize [14], etc. Oligos designed from genome sequences based on low-copy sequences are better conserved than the repetitive DNA, which can be used for chromosome identification in related species that have diverged for several million years (MYs), or even more than 15 MYs [13,15,16].
In the present study, we tested maize chromosome painting probes (MCPs) in sorghum and T. arundinaceum using multiple rounds of FISH. Based on the oligo-FISH results, for the first time, we reported that MCPs can distinctly detect chromosomes 1–10 of T. arundinaceum. Then, the karyotype of T. arundinaceum was established according to the individual chromosome identification combining MCPs, 5S rDNA, and 35S rDNA probes. Altogether, these results will be useful for further understanding the chromosome inheritance of T. arundinaceum and improving the efficiency of sugarcane breeding.

2. Results

2.1. Sequence Alignment Analysis between MCP Sequences and Sorghum Genome

We aimed to align 10 MCP sequences to 10 pseudomolecules of sorghum. Then, the sequence comparison was performed between MCP sequences and sorghum genome (see Methods section). The results showed that the number of oligos that align to the sorghum genome ranged from 277 to 27,169 (Table 1), which implied that these MCPs will produce various signals on the chromosomes of sorghum. To further understand the distribution of MCP sequences, we selected the MCP sequences that have the potential to produce obvious signals (the number of oligos > 1000) for displaying their locations on ten sorghum chromosomes (Figure 1); for example, MCP1 sequences aligned with sorghum chromosomes 1, 7, and 8 (Figure 1a and Figure S1). This implies that the MCP1 probe may produce hybridization signals on these three sorghum chromosomes. Although the MCP sequences showed an uneven distribution in sorghum, the number of the aligned MCP oligos was up to 10,000 on half of the sorghum chromosomes (chromosomes 1, 2, 3, 4, and 9, Table 1), and even 27,169 (chromosome 1, Table 1). These results indicated that the MCPs may be valid chromosome markers for sorghum chromosome identification.

2.2. Chromosome Painting Using MCPs in Sorghum

Based on the distributions of the ten MCPs above, we selected six probes, MCP5–MCP10, that were sufficient to distinguish ten sorghum chromosomes in a few rounds of oligo-FISH. These six MCPs were labeled by digoxigenin or biotin, and conjugated with anti-dig or anti-bio antibodies, respectively. Pairs of probes were sequentially hybridized to the same metaphase chromosomes prepared from the root tips of sorghum. For example, MCP9 and MCP10 probes were hybridized to the metaphase cell (Figure 2a). The slide was then washed and re-probed with MCP7 and MCP8 probes (Figure 2b). Finally, all six MCPs probes were applied after three sequential FISH experiments (Figure 2a–c).
Expectedly, our FISH results suggested that the MCPs’ signal patterns were well correlated with the sequence alignment distribution between MCP sequences and sorghum genome (Figure 1 and Figure 2). For example, MCP10 produced variously distinct signals on chromosomes 6, 7, and 8, which presented unique signal types for each of these chromosomes (Figure 2a). However, MCP10 did not produce an observed signal on chromosome 9 (Figure 2a). Furthermore, MCP6 (Figure 1f and Figure 2c) and MCP5 (Figure 1e and Figure 2c) did not produce an observed signal on chromosome 7 and chromosome 10, respectively. These results suggested that the unobservable signal of these probes may be caused by the limited oligo numbers on the chromosomes (Figure S1). In addition, MCP5 did not produce an expected strong signal on chromosome 4 (Figure 2c), which implied that the sequential FISH may affect the efficiency of hybridization.

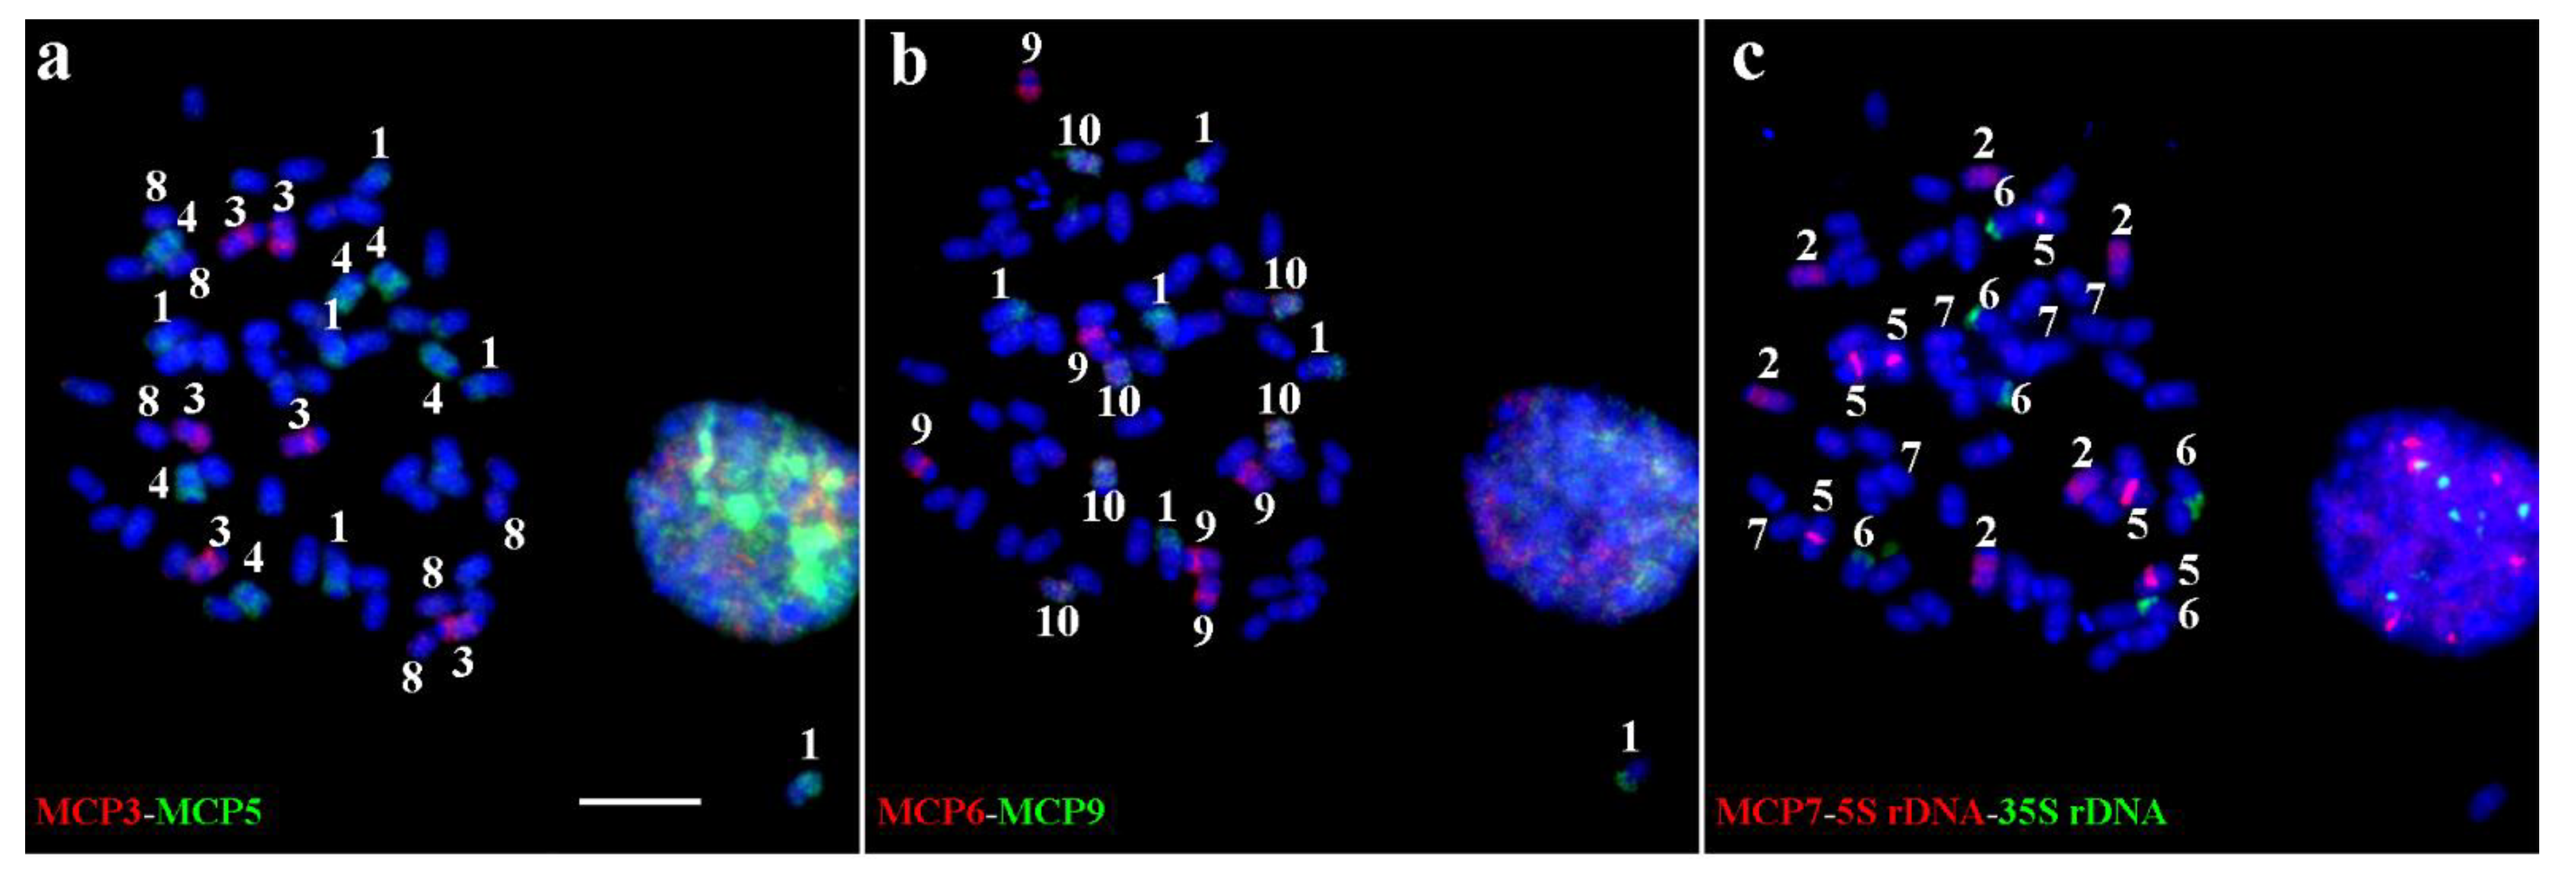
2.3. Chromosome Identification in T. arundinaceum Using MCPs, 5S rDNA, and 35S rDNA Probes

So far, the T. arundinaceum genome data are still unavailable. It is difficult to establish the karyotype using repetitive sequences or BAC clones. Hence, we attempted to use the same metaphase cell for chromosome identification in T. arundinaceum. The sequential FISH prevented cross-hybridization signals from non-target chromosomes. We selected a putative hexaploid T. arundinaceum (Hainan92-77, 2n = 60, x = 10) for chromosome painting analysis using MCPs. We performed five rounds of sequential FISH using MCPs on the same metaphase plate of T. arundinaceum. Based on the distribution of MCP on the sorghum genome, we named the chromosomes 1–10 of T. arundinaceum according to the sequential FISH results (Figure 3 and Figure S2). For example, MCP2 and MCP1 were labeled with digoxigenin (red signal) or biotin (green signal), respectively (Figure S2a and Figure 3c). FISH showed that MCP2 produced differential signals on chromosomes 2, 5. and 6 of T. arundinaceum (Figure S2a). We named them as chromosomes 2, 5 and 6 of T. arundinaceum according to the sorghum chromosome nomenclature (Figure 1b). The MCP1 probe produced distinct signals on six chromosomes of T. arundinaceum and we identified them as chromosome 1 in T. arundinaceum (Figure 3c). Altogether, all the T. arundinaceum chromosomes were identified using the eight MCPs, although the signals varied on different chromosomes. Additionally, the above FISH results between sorghum and T. arundinaceum showed that the synteny of all ten chromosomes was conserved over more than 9 MYs of divergence among these two species [17].
We then performed FISH using 5S and 35S rDNAs probes in the fifth rounds of the sequential FISH after MCP. FISH results suggested that 5S and 35S rDNAs sites were located on chromosome 5 and chromosome 6 (Figure S2c), respectively. However, 5S rDNA was close to the centromeric region and 35S rDNA was mapped on the distal region.

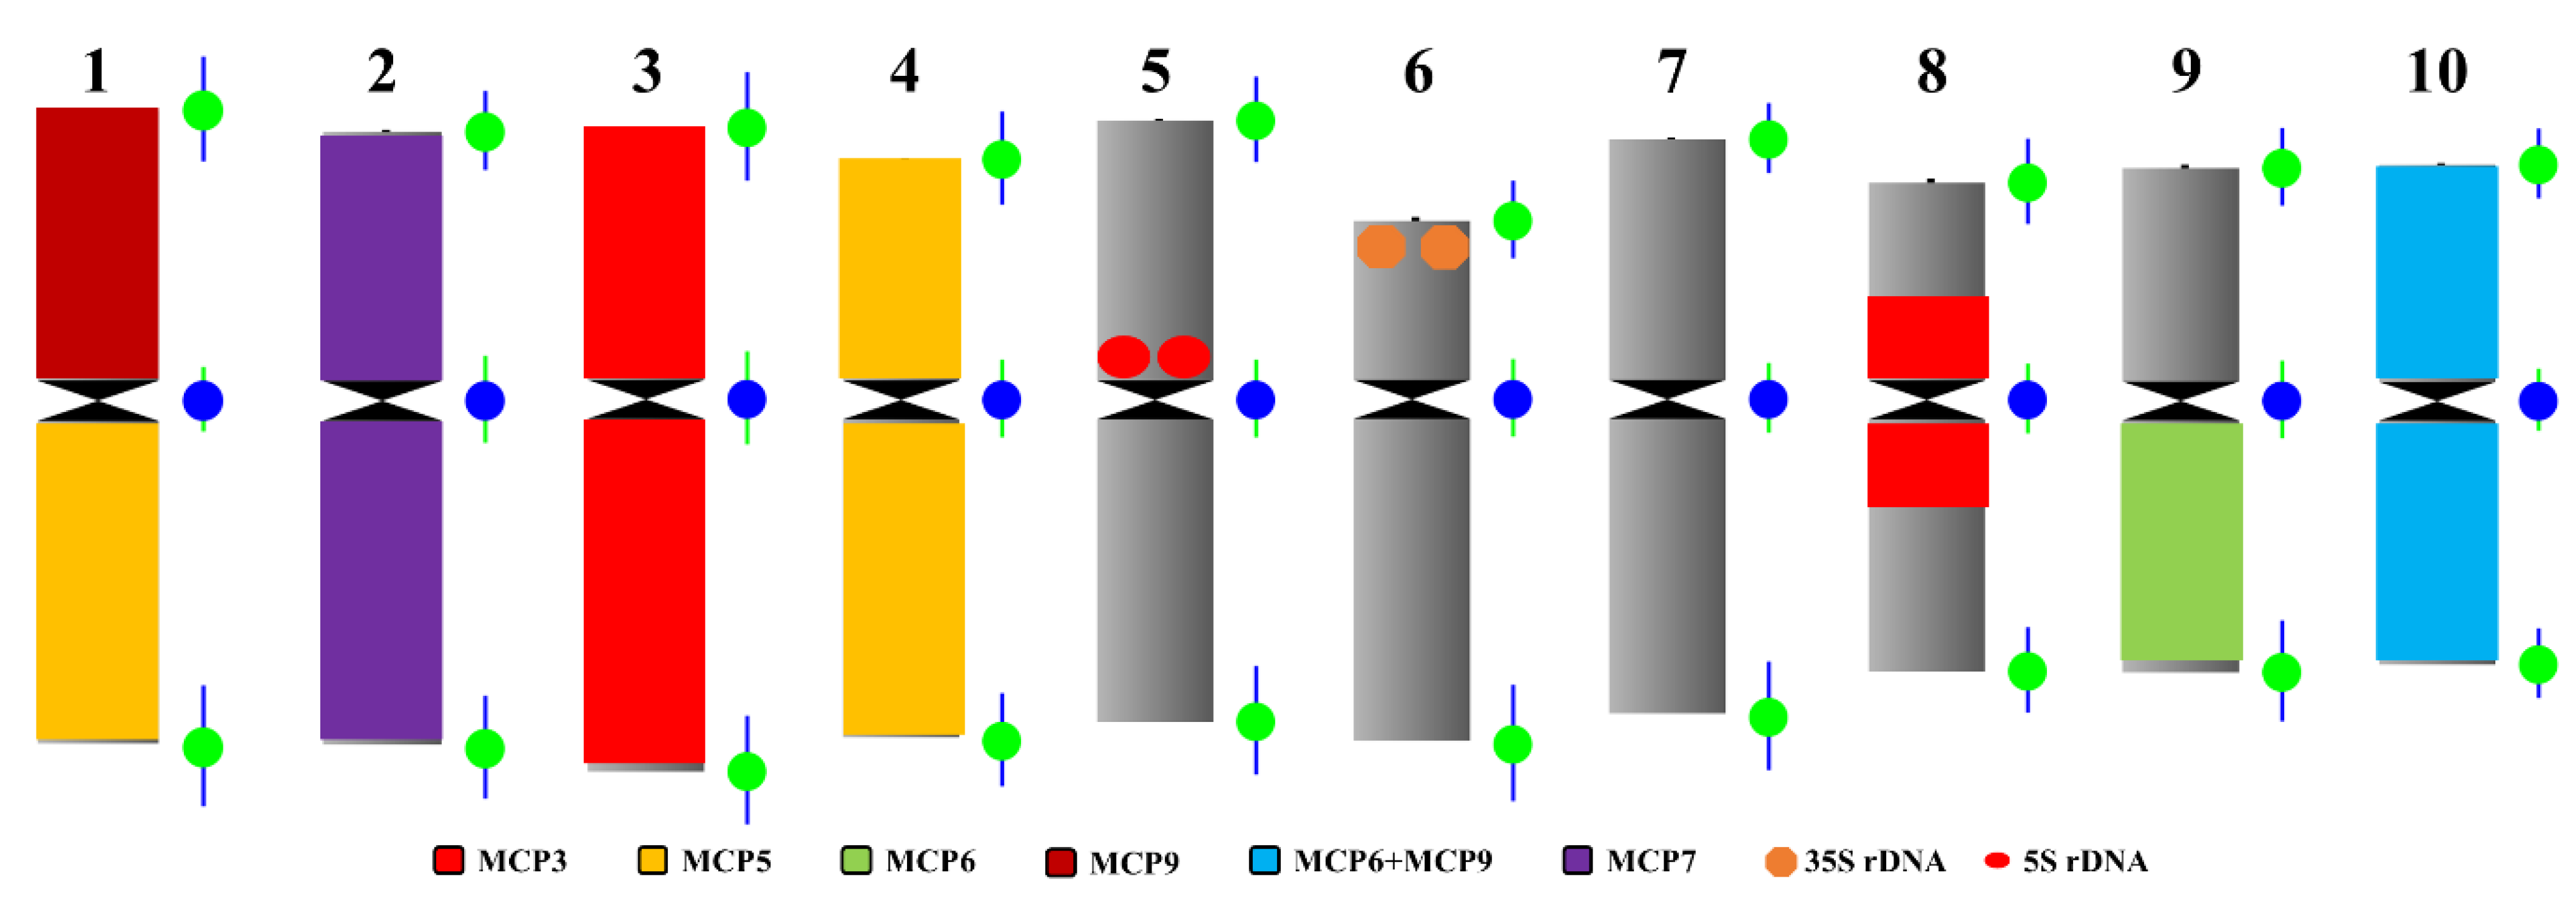
2.4. Standard Karyotype Analysis of T. arundinaceum Based on Sequential Oligo-FISH

In order to identify the T. arundinaceum chromosomes quickly, we selected seven probes, namely MCP3, MCP5, MCP6, MCP7, MCP9, 5S rDNA, and 35S rDNA. The combined probes could be used to identify T. arundinaceum chromosomes with three rounds of sequential FISH (Figure 4). For example, we used MCP3 (red) and MCP5 (green) probes to identify chromosomes 1, 3, 4, and 8 (Figure 4a). Among them, chromosome 8 produced a weak signal. Then MCP6 (red) and MCP9 (green) were selected to identify chromosomes 1, 9, and 10 (Figure 4b). MCP7 (red), 5S rDNA (red), and 35S rDNA (green) probes were used to classify chromosomes 2, 5, and 6 (Figure 4c). Finally, chromosome 7 was classified by excluding nine nonhomologous chromosomes already identified above.
Identification of chromosomes on the same metaphase plate provided us a standard karyotype based on the individually identified chromosome. After identification of chromosomes 1–10, the centromere probe was also located on T. arundinaceum chromosomes for further chromosome measurement (Figure S4). We measured each of ten chromosomes on the metaphase cells for T. arundinaceum, then the karyotype was established accordingly (Table 2 and Figure 5). According to the traditional chromosome classification [18], most chromosomes of T. arundinaceum are metacentric with the arm ratio ranging from 1.14 ± 0.17 to 1.45 ± 0.21 (Table 2). The idiogram of T. arundinaceum was also constructed based on the measured data (Figure 5). Chromosome 1 was the longest (3.58 ± 0.19 μm, Table 2 and Figure 5) and chromosome 8 was the shortest one (2.50 ± 0.23 μm, Table 2 and Figure 5).

3. Discussion

The development of the FISH method based on oligo probes provided a powerful tool for understanding the structure, organization, and evolution of plants [7]. However, karyotype analysis is still a huge challenge in non-model plants. Although there are various available DNA probes for FISH in plants, such as repetitive sequences [19] and bacterial artificial chromosome (BAC) clones [20], etc., application in related species that diverged a few MYs ago has always shown an unsatisfactory result. For example, BAC probes are not suitable for FISH in some plant species with large complex genomes [21]. Repetitive DNA probes are the FISH probes used widely in plant genome research, however, such probes always show a varied signal among different species as a result of the instability of genome, so that they cannot be used for cytogenetics research [22]. In T. arundinaceum, Yu et al. [23] screened many repetitive sequences; unfortunately, these repeats showed a diversity site that cannot be used as a stable marker for chromosome identification. By comparison, recently, the FISH probe based on single copy sequences designed from genome sequences has provided us a more universal and stable marker for cytological study in plants [15,24].
Previous researchers have shown that oligo probes can be applied to chromosome identification in related species that diverged ~12 MYs ago, such as in Cucumis [24], or even as long ago as ~15 MYs in Solanum species [15]. In our study, MCPs were used to identify all sorghum chromosomes successfully, even though sorghum and maize diverged from the common ancestor about 11.9 MYs ago [25]. Braz et al. [26] tested the maize barcode probes in sorghum, however, it did not produce a sufficient number of signals to identify all sorghum chromosomes. In this case, it could be due to the insufficient number of oligos used. Altogether, these results suggest that chromosome painting probes should have greater potential for related species chromosome identification.
T. arundinaceum is an important wild resource for sugarcane breeding. As T. arundinaceum is a ployploid plant with 2n = 60 chromosomes (basic chromosome number x = 10), the genome sequences are still unavailable, which has greatly hindered the development of cytogenetics research. Although many repetitive sequences were obtained in T. arundinaceum [27], none of them have been successfully applied to identify individual chromosomes in T. arundinaceum. Here we tested the MCPs derived from maize, suggesting an unexpected signal in T. arundinaceum. We demonstrated that the MCPs can be used for chromosome identification in T. arundinaceum, even though the divergence time between T. arundinaceum and maize is approximately 18 MYs [17]. Furthermore, 5S rDNA was located on chromosome 5 of T. arundinaceum, which is quite different from sorghum, in which the locus of 5S rDNA was mapped on chromosome 9 [28]. This result suggests an unidentified chromosome rearrangement between sorghum and T. arundinaceum, although the synteny of the ten chromosomes has been conserved based on the oligo-FISH patterns.
There are also many reports about chromosome inheritance between sugarcane and T. arundinaceum [29]. Notably, Babil et al. found that there were significant positive correlations between E. arundinaceus chromosome and agronomic characterization [4]. However, these results are just based on the counted number of T. arundinaceum chromosomes. It is necessary for us to explore the exact chromosome inheritance or significant positive correlation according to the individual chromosome identification in T. arundinaceum. In this study, we identified all T. arundinaceum chromosomes for the first time using MCPs and classified them 1 through 10 according to the sorghum genome data. These MCPs will be powerful tools for further understanding the chromosome inheritance in the hybrids between sugarcane and T. arundinaceum. In addition, individual chromosome identification will dramatically accelerate the research about the exact chromosome, which will contribute to trait improvement in sugarcane breeding.

4. Materials and Methods

4.1. Plant Material and the Preparation of Metaphase Plates

T. arundinaceum (Hainan92-77, 2n = 60, x = 10) was maintained at Fujian Agriculture and Forestry University and the root tips were collected from healthy plants. The seeds of Sorghum bicolor inbred line BTx623 were used to generate roots at room temperature. Then, the root tips were treated and the slides were prepared according to Braz et al.’s protocol [30] with minor adjustments. Treated root tips were washed in water, then the section containing dividing cells was dissected and digested in enzyme mixture (1% pectolyase Y23, 2% pectinase, 2% RS, and 4% cellulase Onozuka R-10) for 4 h at 37 °C. After digestion, the root sections were washed in water and then washed in Carnoy’s fixative two times briefly. The root sections were carefully broken by using a pipette tip. The suspension cells were dropped onto glass slides and another 10 μL acetic acid were dropped onto them when the slide had almost dried.

4.2. Sequence Alignment and Analysis

The sequence of maize CPs is available in the published paper [14] (https://www.pnas.org/content/suppl/2019/01/15/1813957116.DCSupplemental, accessed on 17 January 2019). The MCP sequences evenly cover the entire chromosome sequence of maize with an average oligo density of 0.25 oligo per kb. The sorghum genome was downloaded from the NCBI website (https://www.ncbi.nlm.nih.gov/genome/?term=Sorghum%20bicolor, accessed on 7 April 2017). TBtools software [31] was used to sequence alignment between MCP sequences and the sorghum genome with default parameters. The chromosome location of the ten MCP sequences was drawn by RIdeogram software [32]. We discarded the aligned sequences that were smaller than 32 bp, meaning that at least a 32 bp (70% homology) match with the sorghum genome was required for sequences to be retained and counted.

4.3. Oligo-FISH and Karyotype Analysis

5S and 35S rDNAs were labeled with digoxigenin-11-dUTP or biotin-16-dUTP (Roche Diagnostics, Mannheim, Germany) using a Nick Translation Kit (Roche Diagnostics, Mannheim, Germany). The centromere probe was prepared according to Huang et al. [33]. The So1 probe was used to localize the centromeric region, as it has the highest genome proportion and is located on all chromosomes in sugarcane. MCPs were amplified and labeled according to published protocols [30] using a T7 in vitro transcription method. The first round of FISH was performed as described by Braz et al. [30]. All biotin-labeled (~500 ng) probes were detected by anti-biotin fluorescein (Vector Laboratories, Burlingame, CA, USA) and digoxigenin-labeled probes (~400 ng) were detected by antidigoxigenin rhodamine (Roche Diagnostics, Indianapolis, IN, USA). Chromosomes were counterstained with DAPI (4′, 6-diamidino-2-phenylindole). An AxioScope A1 Imager fluorescent microscope (Carl Zeiss, Gottingen, Germany) was used for capturing images. The final image contrast was processed using Adobe Photoshop 21.0.0 software. Measurement of the short arm and long arm of the individual chromosomes was conducted in the DRAWID software [34]. Arm ratio = the long arm/the short arm; 10 metaphase cells were used for measurement on each chromosome.
Slides with high-quality metaphases were retained for sequential FISH. After the first round of FISH and image capture, the slides were washed three times in 4×SSC (10 min each). The slides were then washed three times in 2×SSC at room temperature (5 min each). Finally, the slides were continuously dehydrated in 70% and 100% ethanol series (room temperature, 3 min each), denatured again in 70% formamide at 70 °C for 2 min, dehydrated in a second ethanol series (pre-cooled at −20 °C, 5 min each) and further hybridized with different probes.

5. Conclusions

In this study, the MCPs were applied in sorghum and T. arundinaceum using stable oligo-FISH. Our results suggest that MCPs can be used as reliable markers for chromosome identification in T. arundinaceum. Using this system, for the first time, we were able to identify all chromosomes of T. arundinaceum though chromosomes 7 and 8 had a weak signal. The tested MCPs may be a useful FISH marker for further cytogenetics research in the hybrids between T. arundinaceum and sugarcane, since genomic DNA probes have been used to distinguish these species’ chromosomes separately.

Supplementary Materials

The following are available online at https://www.mdpi.com/article/10.3390/ijms22168539/s1.

Author Contributions

Z.D. designed the research. F.Y., J.C., X.L., Z.Y., R.Y., X.D. and Q.W. performed the experiments. F.Y., X.Y., J.W. and Z.D. analyzed the results and wrote the manuscript. All authors have read and agreed to the published version of the manuscript.

Funding

This research was funded by the National Natural Science Foundation of China (31771863). This project was also supported by independent fund of Guangxi Key Laboratory of sugarcane biology, Scientific Research Foundation of Graduate School of Fujian Agriculture and Forestry University (324-1122yb056), Guangdong Provincial Team of Technical System Innovation for Sugarcane Sisal Hemp Industry (2019KJ104-04), grants from the State Key Laboratory for Conservation and Utilization of Subtropical Agro-Bioresources and the project supported by China Agriculture Research System of MOF and MARA (No. CARS-20-1-5).

Institutional Review Board Statement

Not applicable.

Informed Consent Statement

Not applicable.

Data Availability Statement

Sorghum genome originated from the National Center for Biotechnology Information (NCBI, https://www.ncbi.nlm.nih.gov/genome/?term=Sorghum%20bicolor, accessed on 7 April 2017) database.

Acknowledgments

We thank Jiming Jiang for providing the maize oligo library.

Conflicts of Interest

The authors declare no conflict of interest.

References

  1. Roach, B.T. Nobilisation of sugarcane. Proc. Int. Soc. Sugar Cane Technol. 1972, 14, 206–216. [Google Scholar]
  2. Anzoua, K.G.; Yamada, T.; Henry, R.J. Wild Crop Relatives: Genomic and Breeding Resources; Kole, C., Ed.; Springer: Berlin/Heidelberg, Germany, 2011. [Google Scholar] [CrossRef]
  3. Lloyd Evans, D.; Joshi, S.V.; Wang, J. Whole chloroplast genome and gene locus phylogenies reveal the taxonomic placement and relationship of Tripidium (Panicoideae: Andropogoneae) to sugarcane. BMC Evol. Biol. 2019, 19, 33. [Google Scholar] [CrossRef] [PubMed] [Green Version]
  4. Pachakkil, B.; Terajima, Y.; Ohmido, N.; Ebina, M.; Irei, S.; Hayashi, H.; Takagi, H. Cytogenetic and agronomic characterization of intergeneric hybrids between Saccharum spp. hybrid and Erianthus arundinaceus. Sci. Rep. 2019, 9, 1748. [Google Scholar] [CrossRef] [Green Version]
  5. Piperidis, N.; Chen, J.W.; Deng, H.H.; Wang, L.P.; Jackson, P.; Piperidis, G. GISH characterization of Erianthus arundinaceus chromosomes in three generations of sugarcane intergeneric hybrids. Genome 2010, 53, 331–336. [Google Scholar] [CrossRef] [PubMed]
  6. Yang, S.; Zeng, K.; Chen, K.; Wu, J.; Wang, Q.; Li, X.; Deng, Z.; Huang, Y.; Huang, F.; Chen, R.; et al. Chromosome transmission in BC4 progenies of intergeneric hybrids between Saccharum spp. and Erianthus arundinaceus (Retz.) Jeswiet. Sci. Rep. 2019, 9, 2528. [Google Scholar] [CrossRef] [Green Version]
  7. Jiang, J. Fluorescence in situ hybridization in plants: Recent developments and future applications. Chromosome Res. 2019, 27, 153–165. [Google Scholar] [CrossRef]
  8. Jiang, J.; Gill, B.S. Nonisotopic in situ hybridization and plant genome mapping: The first 10 years. Genome 1994, 37, 717–725. [Google Scholar] [CrossRef]
  9. Singh, R.S.; Jiang, J.; Gill, B.S. Current status and the future of fluorescence in situ hybridization (FISH) in plant genome research. Genome 2006, 49, 1057–1068. [Google Scholar]
  10. Zhang, T.; Liu, G.; Zhao, H.; Braz, G.T.; Jiang, J. Chorus2: Design of genome-scale oligonucleotide-based probes for fluorescence in situ hybridization. Plant Biotechnol. J. 2021. [Google Scholar] [CrossRef]
  11. Liu, X.; Sun, S.; Wu, Y.; Zhou, Y.; Gu, S.; Yu, H.; Yi, C.; Gu, M.; Jiang, J.; Liu, B.; et al. Dual-color oligo-FISH can reveal chromosomal variations and evolution in Oryza species. Plant J. 2020, 101, 112–121. [Google Scholar] [CrossRef]
  12. Song, X.; Song, R.; Zhou, J.; Yan, W.; Zhang, T.; Sun, H.; Xiao, J.; Wu, Y.; Xi, M.; Lou, Q.; et al. Development and application of oligonucleotide-based chromosome painting for chromosome 4D of Triticum aestivum L. Chromosome Res. 2020, 28, 171–182. [Google Scholar] [CrossRef]
  13. He, L.; Zhao, H.; He, J.; Yang, Z.; Jiang, J. Extraordinarily conserved chromosomal synteny of Citrus species revealed by chromosome: Pecific painting. Plant J. 2020, 103, 2225–2235. [Google Scholar] [CrossRef]
  14. Albert, P.S.; Zhang, T.; Semrau, K.; Rouillard, J.M.; Kao, Y.H.; Wang, C.J.R.; Danilova, T.V.; Jiang, J.; Birchler, J.A. Whole-chromosome paints in maize reveal rearrangements, nuclear domains, and chromosomal relationships. Proc. Natl. Acad. Sci. USA 2019, 116, 1679–1685. [Google Scholar] [CrossRef] [PubMed] [Green Version]
  15. Braz, G.T.; He, L.; Zhao, H.; Zhang, T.; Jiang, J. Comparative Oligo-FISH Mapping: An Efficient and Powerful Methodology To Reveal Karyotypic and Chromosomal Evolution. Genetics 2017, 208, 513–523. [Google Scholar] [CrossRef] [PubMed] [Green Version]
  16. Xin, H.; Zhang, T.; Wu, Y.; Zhang, W.; Zhang, P.; Xi, M.; Jiang, J. An extraordinarily stable karyotype of the woody Populus species revealed by chromosome painting. Plant J. 2020, 101, 253–264. [Google Scholar] [CrossRef]
  17. Shin-Ichi, T.; Masumi, E.; Makoto, K.; Wataru, T.; Berthold, H. Complete Chloroplast Genomes of Erianthus arundinaceus and Miscanthus sinensis: Comparative Genomics and Evolution of the Saccharum Complex. PLoS ONE 2017, 12, e0169992. [Google Scholar]
  18. Levan, A. Nomenclature for centromeric position on chromosomes. Heriditas 1964, 52, 201–220. [Google Scholar] [CrossRef]
  19. Zhou, H.C.; Pellerin, R.J.; Waminal, N.E.; Yang, T.-J.; Kim, H.H. Pre-labelled oligo probe-FISH karyotype analyses of four Araliaceae species using rDNA and telomeric repeat. Genes Genom. 2019, 41, 839–847. [Google Scholar] [CrossRef]
  20. Do Vale Martins, L.; de Oliveira Bustamante, F.; da Silva Oliveira, A.R.; da Costa, A.F.; de Lima Feitoza, L.; Liang, Q.; Zhao, H.; Benko-Iseppon, A.M.; Muñoz-Amatriaín, M.; Pedrosa-Harand, A.; et al. BAC- and oligo-FISH mapping reveals chromosome evolution among Vigna angularis, V. unguiculata, and Phaseolus vulgaris. Chromosoma 2021, 1–15. [Google Scholar] [CrossRef]
  21. Guangrui, D.; Jiao, S.; Qing, Z.; Jianping, W.; Qingyi, Y.; Ray, M.; Kai, W.; Jisen, Z. Development and Applications of Chromosome-Specific Cytogenetic BAC-FISH Probes in S. spontaneum. Front. Plant Sci. 2018, 9, 218. [Google Scholar]
  22. Thumjamras, S.; Iamtham, S.; Prammanee, S.; de Jong, H. Meiotic analysis and FISH with rDNA and rice BAC probes of the Thai KPS 01-01-25 sugarcane cultivar. Plant Syst. Evol. 2016, 302, 305–317. [Google Scholar] [CrossRef] [Green Version]
  23. Yu, F.; Huang, Y.; Luo, L.; Li, X.; Wu, J.; Chen, R.; Zhang, M.; Deng, Z. An improved suppression subtractive hybridization technique to develop species-specific repetitive sequences from Erianthus arundinaceus (Saccharum complex). BMC Plant Biol. 2018, 18, 269. [Google Scholar] [CrossRef] [PubMed] [Green Version]
  24. Han, Y.; Zhang, T.; Thammapichai, P.; Weng, Y.; Jiang, J. Chromosome-Specific Painting in Cucumis Species Using Bulked Oligonucleotides. Genetics 2015, 200, 771–779. [Google Scholar] [CrossRef] [PubMed] [Green Version]
  25. Swigonova, Z. Close Split of Sorghum and Maize Genome Progenitors. Genome Res. 2004, 14, 1916–1923. [Google Scholar] [CrossRef] [Green Version]
  26. Braz, G.T.; do Vale Martins, L.; Zhang, T.; Albert, P.S.; Birchler, J.A.; Jiang, J. A universal chromosome identification system for maize and wild Zea species. Chromosome Res. 2020, 28, 183–194. [Google Scholar] [CrossRef]
  27. Besse, P.; Taylor, G.; Carroll, B.; Berding, N.; Burner, D.; McIntyre, C.L. Assessing genetic diversity in a sugarcane germplasm collection using an automated AFLP analysis. Genetica 1998, 104, 143–153. [Google Scholar] [CrossRef] [PubMed]
  28. Meng, Z.; Zhang, Z.; Yan, T.; Lin, Q.; Wang, Y.; Huang, W.; Huang, Y.; Li, Z.; Yu, Q.; Wang, J.; et al. Comprehensively Characterizing the Cytological Features of Saccharum spontaneum by the Development of a Complete Set of Chromosome-Specific Oligo Probes. Front. Plant Sci. 2018, 9. [Google Scholar] [CrossRef]
  29. Jiayun, W.; Yongji, H.; Yanquan, L.; Cheng, F.; Shaomou, L.; Zuhu, D.; Qiwei, L.; Zhongxing, H.; Rukai, C.; Muqing, Z. Unexpected Inheritance Pattern of Erianthus arundinaceus Chromosomes in the Intergeneric Progeny between Saccharum spp. and Erianthus arundinaceus. PLoS ONE 2014, 9, e110390. [Google Scholar]
  30. Braz, G.T.; Yu, F.; do Vale Martins, L.; Jiang, J. Fluorescent In Situ Hybridization Using Oligonucleotide-Based Probes. Methods Mol. Bio. 2020, 2148, 71–83. [Google Scholar]
  31. Chengjie, C.; Hao, C.; Yi, Z.; Hannah, R.T.; Margaret, H.F.; Yehua, H.; Rui, X. TBtools: An Integrative Toolkit Developed for Interactive Analyses of Big Biological Data. Mol. Plant 2020, 13, 1194–1202. [Google Scholar] [CrossRef]
  32. Hao, Z. RIdeogram: Drawing SVG graphics to visualize and map genome-wide data on the idiograms. PeerJ Comput. Sci. 2020, 6, e251. [Google Scholar] [CrossRef] [PubMed] [Green Version]
  33. Huang, Y.; Ding, W.; Zhang, M.; Han, J.; Jing, Y.; Yao, W.; Hasterok, R.; Wang, Z.; Wang, K. The formation and evolution of centromeric satellite repeats in Saccharum species. Plant J. 2021, 106, 616–629. [Google Scholar] [CrossRef] [PubMed]
  34. Kirov, I.; Khrustaleva, L.; Van Laere, K.; Soloviev, A.; Meeus, S.; Romanov, D.; Fesenko, I. DRAWID: User-friendly java software for chromosome measurements and idiogram drawing. Comp. Cytogenet. 2017, 11, 747–757. [Google Scholar] [CrossRef] [PubMed]
Figure 1. Maize CP sequences’ distribution on sorghum chromosomes. Arabic numerals indicate the chromosome of sorghum; (aj) indicate the MCP1-10 sequence distributions on sorghum chromosomes in each 500 kb window, respectively.
Ijms 22 08539 g001
Figure 2. Sequential FISH identifying each of the ten chromosomes in sorghum. (a) First round of FISH using MCP10 (digoxigenin-red) and MCP9 (biotin-green) probes. (b) Second round of FISH using MCP8 (digoxigenin-red) and MCP7 (biotin-green) probes. (c) Third round of FISH using MCP6 (digoxigenin-red) and MCP5 (biotin-green) probes. Arabic numerals denote the chromosome number in sorghum. Bar = 10 μm.
Ijms 22 08539 g002
Figure 3. Sequential oligo-FISH identifying all 10 chromosomes on the same metaphase plate of T. arundinaceum. (a) Second round of oligo-FISH using MCP5 (biotin-green) and MCP3 (digoxigenin-red) probes. (b) Fourth round of oligo-FISH using MCP9 (biotin-green) and MCP10 (digoxigenin-red) probes. (c) Statistical results of different probes. Arabic numerals denote the chromosome numbers. The dotted box denotes the weak signals of chromosomes 8 and 7. The symbol * indicates chromosomes 5 and 9 were both missing one copy in this particular cell due to the preparation of the slides. The six copies of chromosomes 5 and 9 on metaphase plate are provided in Figure S3. Bar = 10 μm.
Ijms 22 08539 g003
Figure 4. Sequential oligo-FISH identifying all 10 chromosomes on the same metaphase plate of T. arundinaceum. (a) First round of FISH using MCP3 (digoxigenin-red) and MCP5 (biotin-green) probes. (b) Second round of FISH using MCP6 (digoxigenin-red) and MCP9 (biotin-green) probes. (c) Third round of FISH using MCP7 (digoxigenin-red), 5S rDNA (digoxigenin-red), and 35S rDNA (biotin-green) probes. Arabic numerals denote the chromosome numbers. Bar = 10 μm.
Ijms 22 08539 g004
Figure 5. Idiogram of the karyotype in T. arundinaceum. The different colors denote the different probes or combined probes.
Ijms 22 08539 g005
Table 1. The number of maize CP sequences aligned to each of the sorghum chromosomes.
No. of OligoSorghum1Sorghum2Sorghum3Sorghum4Sorghum5Sorghum6Sorghum7Sorghum8Sorghum9Sorghum10
MCP127,16974689282065768948122772700791
MCP27019016564521261311,784405446525524
MCP371154620,5745504954154633761435513
MCP4836531600990051204494999564484543
MCP5723653955215,9913824684114905302548
MCP6625416507404424322139065910,9186910
MCP748817,672421422316316387347367415
MCP846640211,2974202942823133725725419
MCP985444344124112773042963003299614
MCP106484715014794669307288839831136481
Table 2. Chromosome length and arm ratio of mitotic metaphase chromosomes of T. arundinaceum.
Chromosome NumberLong Arm
(μm)
Short Arm
(μm)
Chromosome Length (μm)Arm Ratio
Chr.12.02 (±0.19)1.56 (±0.10)3.58 (±0.19)1.30 (±0.18)
Chr.22.03 (±0.06)1.54 (±0.10)3.57 (±0.11)1.32 (±0.11)
Chr.32.08 (±0.21)1.49 (±0.21)3.57 (±0.30)1.42 (±0.24)
Chr.41.84 (±0.16)1.29 (±0.15)3.13 (±0.22)1.45 (±0.21)
Chr.51.76 (±0.21)1.49 (±0.13)3.25 (±0.26)1.19 (±0.17)
Chr.61.80 (±0.90)0.90 (±0.10)2.69 (±0.22)2.03 (±0.37)
Chr.71.70 (±0.19)1.39 (±0.09)3.10 (±0.24)1.22 (±0.12)
Chr.81.40 (±0.13)1.10 (±0.14)2.50 (±0.23)1.29 (±0.15)
Chr.91.42 (±0.16)1.19 (±0.11)2.61 (±0.20)1.20 (±0.18)
Chr.101.38 (±0.08)1.21 (±0.09)2.59 (±0.12)1.14 (±0.10)
Publisher’s Note: MDPI stays neutral with regard to jurisdictional claims in published maps and institutional affiliations.

