Multi-Model Approach on Growth Estimation and Association With Life History Trait for Elasmobranchs
 Kwang-Ming Liu
 Chiao-Bin Wu
 Shoou-Jeng Joung
 Wen-Pei Tsai
 Kuan-Yu Su1,2
- 1Institute of Marine Affairs and Resource Management, National Taiwan Ocean University, Keelung, Taiwan
- 2George Chen Shark Research Center, National Taiwan Ocean University, Keelung, Taiwan
- 3Center of Excellence for the Oceans, National Taiwan Ocean University, Keelung, Taiwan
- 4Department of Environmental Biology and Fisheries Science, National Taiwan Ocean University, Keelung, Taiwan
- 5Department of Fishery Production and Management, National Kaohsiung University of Science and Technology, Kaohsiung, Taiwan
Age and growth information is essential for stock assessment of fish, and growth model selection may influence the accuracy of stock assessment and subsequent fishery management decision making. Previous descriptions of the age and growth of elasmobranchs relied mainly on the von Bertalanffy growth model (VBGM). However, it has been noted that sharks, skates and rays exhibit significant variety in size, shape, and life history traits. Given this variation, the VBGM may not necessarily provide the best fit for all elasmobranchs. This study attempts to improve the growth estimates by using multi-model approach to test four growth models—the VBGM, the two-parameter VBGM, the Robertson (Logistic) and the Gompertz models to fit observed or simulated length-at-age data for 38 species (44 cases) of elasmobranchs. The best-fit growth model was selected based on the bias corrected Akaike’s Information Criterion (AICc), the AICc difference, the AICc weight, the Bayesian Information Criterion (BIC), and the Leave-one-out cross-validation (LOOCV). The VBGM and two-parameter VBGM provide the best fit for species with slow growth and extended longevity (L∞ > 100 cm TL, 0.02 < k < 0.25 yr–1), such as pelagic sharks. For fast-growing small sharks (L∞ < 100 cm TL, kr or kg > 0.2 yr–1) in deep waters and for small-sized demersal skates/rays, the Robertson and the Gompertz models provide the best fit. The best-fit growth models for small sharks in shallow waters are the two-parameter VBGM and the Robertson model. Although it was found that the best-fit growth models for elasmobranchs were associated with their life history trait, exceptions were also noted. Therefore, a multi-model approach incorporating with the best-fit model selected for each group in this study was recommended in growth estimation for elasmobranchs.
Introduction
Elasmobranch life histories and assessments are different than those of teleosts for a number of reasons. Most elasmobranchs are characterized as slow growth, late maturation, extended longevity, few offspring, and low mortality (Hoenig and Gruber, 1990; Winemiller and Rose, 1992; King and McFarlane, 2003). Elasmobranchs also take a long time to recover when subjected to high fishing pressure (Stevens et al., 2000). The life history traits, particularly the reproductive traits of elasmobranchs, are more complex than those of teleosts, which are mostly oviparous.
Similar to many marine mammals, elasmobranchs are among the ocean’s apex predators, and their life history characteristics make them vulnerable to overexploitation. A collapse of the elasmobranch population could result in imbalances in marine ecosystems (Stevens et al., 2000). Age, growth, and reproduction parameters are crucial for accurate stock assessment and evaluation of their population dynamics (Cailliet et al., 1986; Cailliet and Goldman, 2004). Information on age and growth can be used in natural mortality, longevity, and yield-per-recruit estimates (Ismen, 2003). However, age and growth study of elasmobranchs is more challenging compared with that of teleost species for several reasons. Some deep-water species are difficult to age such as spiny dogfish (Squalus spp.) (Campana et al., 2006), and the periodicity of band pair deposition may vary in different life stages such as shortfin mako shark Isurus oxyrinchus (Kinney et al., 2016) which may lead to the uncertainty in age estimation. In addition, ageing based on hard parts of elasmobranchs is typically underestimated in larger and older individuals based on bomb radiocarbon analysis (Passerotti et al., 2010; Harry, 2018; Natanson et al., 2018). These studies showed that vertebrae may not be useful for age estimation in some species once asymptotic length is reached. The underestimated age may lead to an underestimation of longevity and biased estimation of mortality which may affect the result of stock assessment and management measures.
In the 1950s, Beverton and Holt (1957) first applied the von Bertalanffy growth model (VBGM) to fish population dynamics. However, VBGM may not necessarily provide the best fit for all elasmobranchs (Cailliet and Goldman, 2004). Therefore, selecting the most appropriate growth model is important in stock assessment and fishery management of elasmobranchs (Gelsleichter et al., 1998).
Four growth models are commonly used in description of age and growth of elasmobranchs: the VBGM, the two-parameter VBGM, the Robertson (Logistic) model, and the Gompertz model (Cailliet et al., 2006). Derived from the allometric relationship between metabolic rate and body weight, the VBGM has been widely used to describe the growth of fish (Haddon, 2001). The ideas underpinning this model are that energy transformation during growth can be expressed as the difference between anabolism and catabolism and that the growth rate decreases exponentially with age (Pütter, 1920). While the Robertson and the Gompertz models are S-shaped curves with inflection points occurring at an intermediate age when the growth rate starts to decrease (Wang and Zuidhof, 2004). The inflection point of the Robertson model occurs at 50% of L∞, but it occurs at approximately 37% of L∞ for the Gompertz model (Winsor, 1932). Under these two models, growth rates increase with age to a maximum at the inflection points and then decrease thereafter (Ricker, 1975, 1979). Discrepancies in life history among elasmobranch species are likely to affect the result of selecting the best-fit growth model. In addition, energy allocation for elasmobranchs varies with habitat and reproductive strategies; this may result in differences in growth.
Numerous examples exist that used VBGM to estimate the age and growth of elasmobranchs for example, the pelagic thresher Alopias pelagicus (Liu et al., 1999), whiskery shark Furgaleus macki (Simpfendorfer et al., 2000), and undulate ray Raja undulate (Coelho and Erzini, 2002). Although the VBGM is the most commonly-used growth model, others have also been employed. The two-parameter VBGM has been successfully applied in describing growth of the bull shark Carcharhinus leucas (Neer et al., 2005), the shortfin mako shark Isurus oxyrinchus (Natanson et al., 2006; Chang and Liu, 2009; Semba et al., 2009), and the oceanic whitetip shark, Carcharhinus longimanus (Joung et al., 2016) for which size-at-birth data are available. An S-sharp model (Gompertz model) has been used to estimate the growth of the Pacific electric ray Torpedo californica (Neer and Cailliet, 2001), pelagic stingray Dasyatis violacea (Mollet et al., 2002), and the Kwangtung skate Dipturus kwangtungensis (Joung et al., 2015a). While, the Robertson (Logistic) model has been used to fit the length-at-age data for the spinner shark Carcharhinus brevipinna (Carlson and Baremore, 2005), the dusky shark Carcharhinus obscures (Natanson et al., 2014; Joung et al., 2015b), and Mediterranean skate Raja polystigma (Porcu et al., 2020). In recent years, multi-models have been used in age and growth studies of sharks. The use of multi-models in fitting length-at-age data is considered preferable to using single growth model (Katsanevakis and Maravelias, 2008; Smart et al., 2016).
Romney and Campana (2009) examined four skate species and concluded that the VBGM best fit the winter and thorny skate Amblyraja radiata, while the Robertson model best fit the little skate, Leucoraja erinacea, and the Gompertz model best fit the smooth skate. Ebert et al. (2007) concluded that the VBGM provided the best fit for the Aleutian skate Bathyraja aleutica but that the Bering skate B. interrupta was more accurately described by the Robertson model. Katsanevakis (2006) also concluded that various growth models best described the growth of different chondrichthyan fish. Chen (pers. comm., 2004) applied several growth models to a variety of teleost species and concluded that the Richards and Robertson models best fit fish with slender and long lateral profile, while the VBGM and Gompertz model best fit other species. However, despite of the examination on the influence of taxa, body size, and sex segregation on candidate model fits for elasmobranchs (Smart et al., 2016), no other study has attempted to examine the correlation of growth model fits and life traits for sharks and rays.
Given the influence of growth model selection on the results of stock assessment, in particular, age-structured models, the objectives of this study were twofold: first, to fit the length-at-age data using multi-model approach, selecting the best-fit model for each species; and second, to group species on the basis of the best-fit model, examine the life history traits for each of these groups, and discuss the possible correlation involved. The hypothesis of this study is that age and growth of life-history closely related species can be best described by a similar growth model. We hope that our findings can provide an important future reference for the selection of the most appropriate growth model for elasmobranchs.
Methods
Source of Data
This study collected and analyzed the length-at-age data of 38 species, including the observations of vertebral band counts of 8 species and the age-length key data of 30 species from the literature (Supplementary Table 1). Of which, sex-specific data were available for 6 species. These species fell into 6 orders and 12 families (Supplementary Table 2). Two species were from Hemiscylliidae and Rhincodontidae (Orectolobiformes), 3 species were from Odontaspididae, Lamnidae, and Alopiidae (Lamniformes), 19 species were from Triakidae, Carcharhinidae, and Sphyrnidae (Carcharhiniformes), 2 species were from Etmopteridae (Squaliformes), 1species was from Rhinobatidae, 10 species were from Rajiformes (Rajidae), and 1 species was from Dasyatidae (Myliobatiformes). Life history parameters and ecological information, including habitat information, reproductive strategy, fecundity, reproductive cycle (Rc), and size at maturity (Lmat), were collected through literature searches in FishBase1 as well as from published scientific articles and gray literature.
Data Process
In addition to observed length-at-age data, age-length key data adopted from the literature comprised the following data sets: (1) detailed age-specific length distribution data that can be directly fit by the growth models, (2) age-specific mean length with standard deviation, and (3) age-specific length interval. For data sets 2 and 3, a simulation process was used to generate (mimic) individual observations. For data set 2, a normal random number generator in Excel was used to generate simulated observations based on the sample size, mean length, and standard deviation for each age. The simulated data set for each age was adopted when its mean length and standard deviation approximate to the observed values within a limit of 0.1 for the observed mean length and standard deviation. For data set 3, the length distribution of each age was assumed to be a uniform distribution, and simulated observations were generated from a uniform random number generator in Excel based on the sample size and the maximum and minimum length of each age. The simulated data set for each age was adopted when its mean length (the average of the maximum and the minimum length) approximated to the observed mean within a limit of 0.5 (see examples in Supplementary Data Sheet).
The literature reveals an inconsistency in the way that body length is measured. Total length (TL) of 26 species, fork length (FL) of 4 species, precaudal length (PCL) of 7 species, and disc width (DW) of 1 species have all been used. Size-at-birth data were available for 23 of the 38 species (Supplementary Table 1). As most length measurements were in TL, our analysis converted other length measurements to TL using linear relationships between TL and other length measurements.
Data Analysis
Growth Models
Three commonly used growth models, the VBGM (Beverton, 1954), the Robertson (Logistic) (Robertson, 1923) and the Gompertz (Gompertz, 1825), were fit to the length-at-age data for all species. For those species where size-at-birth data were available, an additional model, the two-parameter VBGM (Fabens, 1965), was also used. The nonlinear least squares function (nls) in R program (R Core Team, 2013) was used to estimate the parameters of each model. The four growth models are described as follows:
(1) VBGM (Beverton, 1954)
(2) Two-parameter VBGM (Fabens, 1965)
(3) Robertson (Logistic) model (Robertson, 1923)
(4) Gompertz model (Gompertz, 1825)
where Lt is the length at age t, L∞ is the asymptotic length, k is the growth coefficient, t is the age (year from birth), L0 is the size at birth, t0 is the age at length 0, cr and kr are the parameters of the Robertson model, and cg and kg are the parameters of the Gompertz model.
Model Selection
The goodness of fit of the four growth models was compared based on the bias corrected Akaike’s Information Criterion (AICc), the AICc difference (ΔAICc), and the AICc weight (wi) (Burnham and Anderson, 2002), the Bayesian Information Criterion (BIC; Schwarz, 1978), and the Leave-one-out cross-validation (LOOCV; Breiman and Spector, 1992). The model with the smallest values of the aforementioned criteria was selected as the best growth model. AICc was expressed as:
where n is the total sample size, MSE is the mean square of residuals, and K is the number of parameters estimated in the growth model. The AICc difference (ΔAICc) of each model was calculated as the difference between AICc,i and the lowest observed AICc value (AICcmin). The corrected Akaike weight (Wi) is expressed as a percentage, which is useful when there are only minor differences in AICc values among the growth models (Burnham and Anderson, 2002). The BIC can be expressed as: BIC = n × ln(MSE) + K × ln(n) (Schwarz, 1978). Minimizing a CV statistic is a common way to do model selection such as LOOCV. The LOOCV statistic was expressed as:
where . for i = 1,…,n and is the predicted value obtained when the model is estimated after deleting the ith observation. The best fit model can be found out by cross validating (CV) and choosing the one that has lowest mean squares error (MSE).
Results
The goodness of fit of the 4 growth models for 44 cases (38 species and 6 with both sexes data) are listed in Supplementary Table 3. The best-fit model for each species was selected based on the minimum values of the AICc, BIC, and LOOCV. The best-fit models selected based on the three criteria were consistent for 32 of 38 species examined in this study. Only slight difference among the criteria was found for the other 6 species. The BIC values of the VBGM (the best-fit model) were slightly larger than those of two-parameter VBGM for the silky and sandbar shark. The values of LOOCV of two-parameter VBGM (the best-fit model) were slightly larger than those of the VBGM for the scalloped hammerhead and the whitespotted bamboo shark. While, the value of LOOCV of the Gompertz model (the best-fit model) was larger than that of the two-parameter VBGM model for the gummy shark Mustelus antarcticus (both sexes). The BIC value of the Gompertz model (the best-fit model) was slightly larger than that of the two-parameter VBGM for cukoo ray Leucoraja naevus (Supplementary Table 3).
VBGM as the Best-Fit Growth Model
The VBGM provided the best fit for 9 species/cases including 7 shark species: the pelagic thresher, female shortfin mako, blue shark, night shark Carcharhinus signatus, and tiger shark; and 2 skates: female Kwangtung skate Dipturus kwangtungensis, and blue skate D. batis (Table 1). All are large-size sharks or skates except the female Kwangtung skate. The blue skate had the highest L∞ (L∞ = 475.9 cm TL), while the female Kwangtung skate had the lowest (L∞ = 57.0 cm TL). The blue skate had the slowest growth rate (k = 0.024 yr–1), while the female Kwangtung skate had the fastest growth rate (k = 0.294 yr–1).
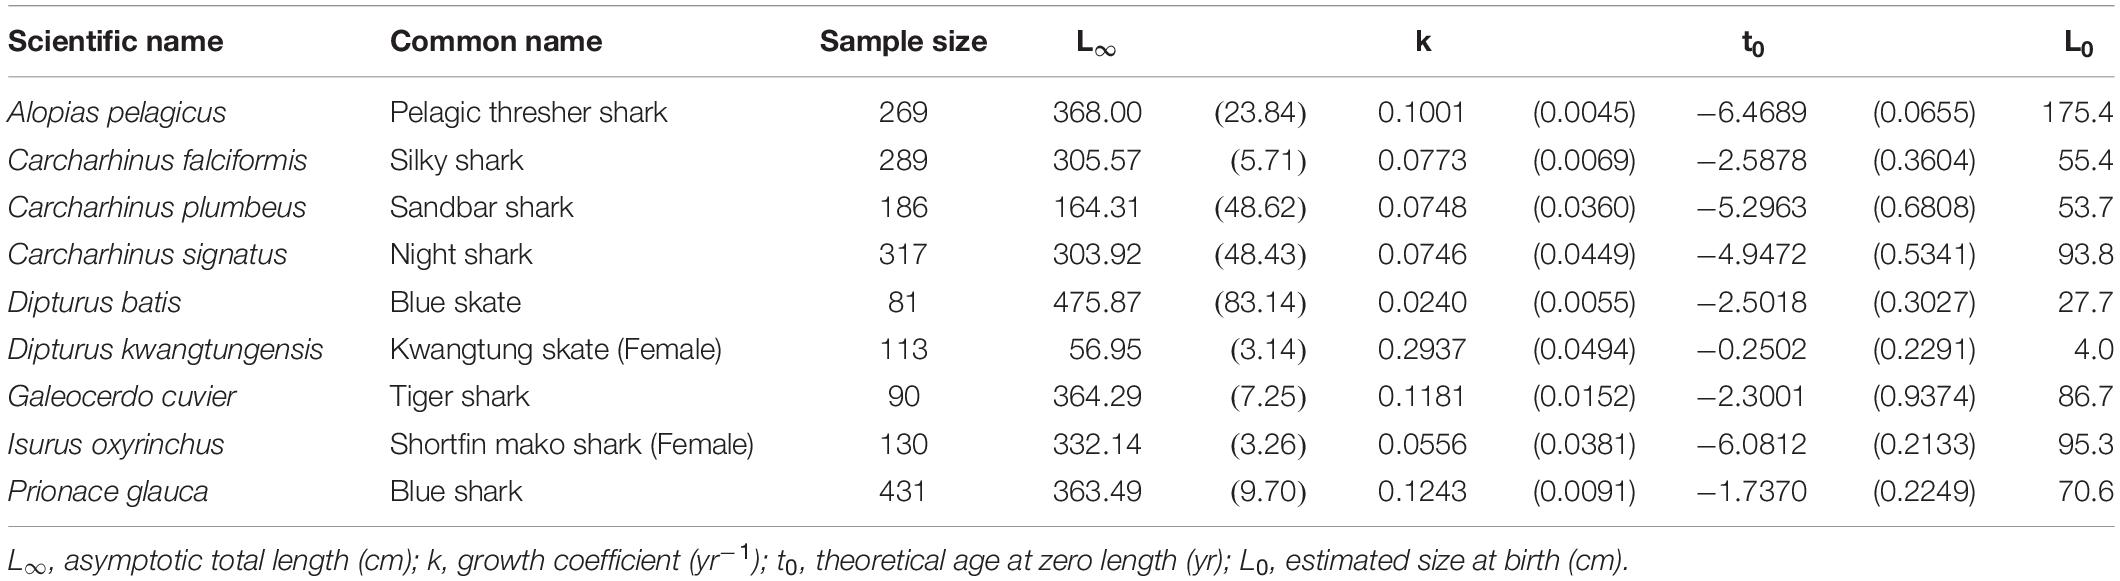
Table 1. Growth parameters of the species best fit by the VBGM. Parenthese indicate standard errors.
Two-Parameter VBGM as the Best-Fit Growth Model
The two-parameter VBGM provided the best fit for 13 of the 23 species with size at birth data, of which 11 were sharks and 2 were skates/rays, comprising 39% and 12% of the 26 species of sharks and 12 species of skates/rays, respectively analyzed in this study (Figure 1).
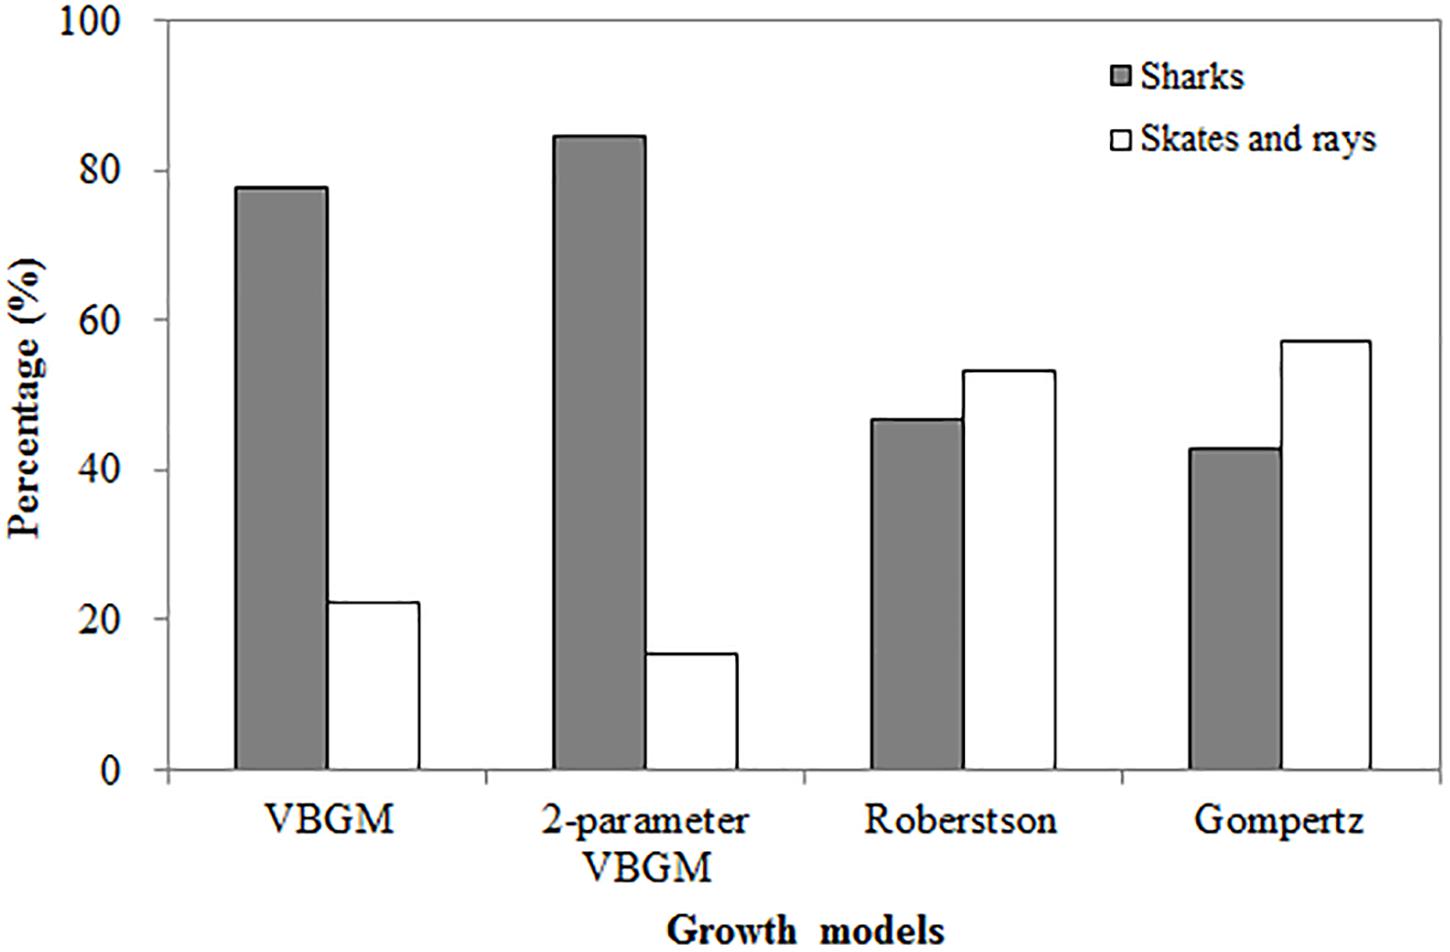
Figure 1. The percentage of four growth models being selected as the best-fit model, categorized by sharks, skates and rays.
Only the smooth lantern shark, and the Atlantic sharpnose shark had an L∞ < 100 cm TL. The remaining species had an L∞ > 100 cm TL. The exceptionally large-sized whale shark fell into this group, with L∞ = 1580 cm TL and k = 0.020 yr–1 (Table 2). Apart from that, the sand tiger shark had the highest L∞ (L∞ = 299.5 cm TL), while the smooth lantern shark had the lowest (L∞ = 53.1 cm TL). The Atlantic sharpnose shark had the fastest growth rate (k = 0.582 yr–1), while the spinner shark had the slowest (k = 0.081 yr–1).
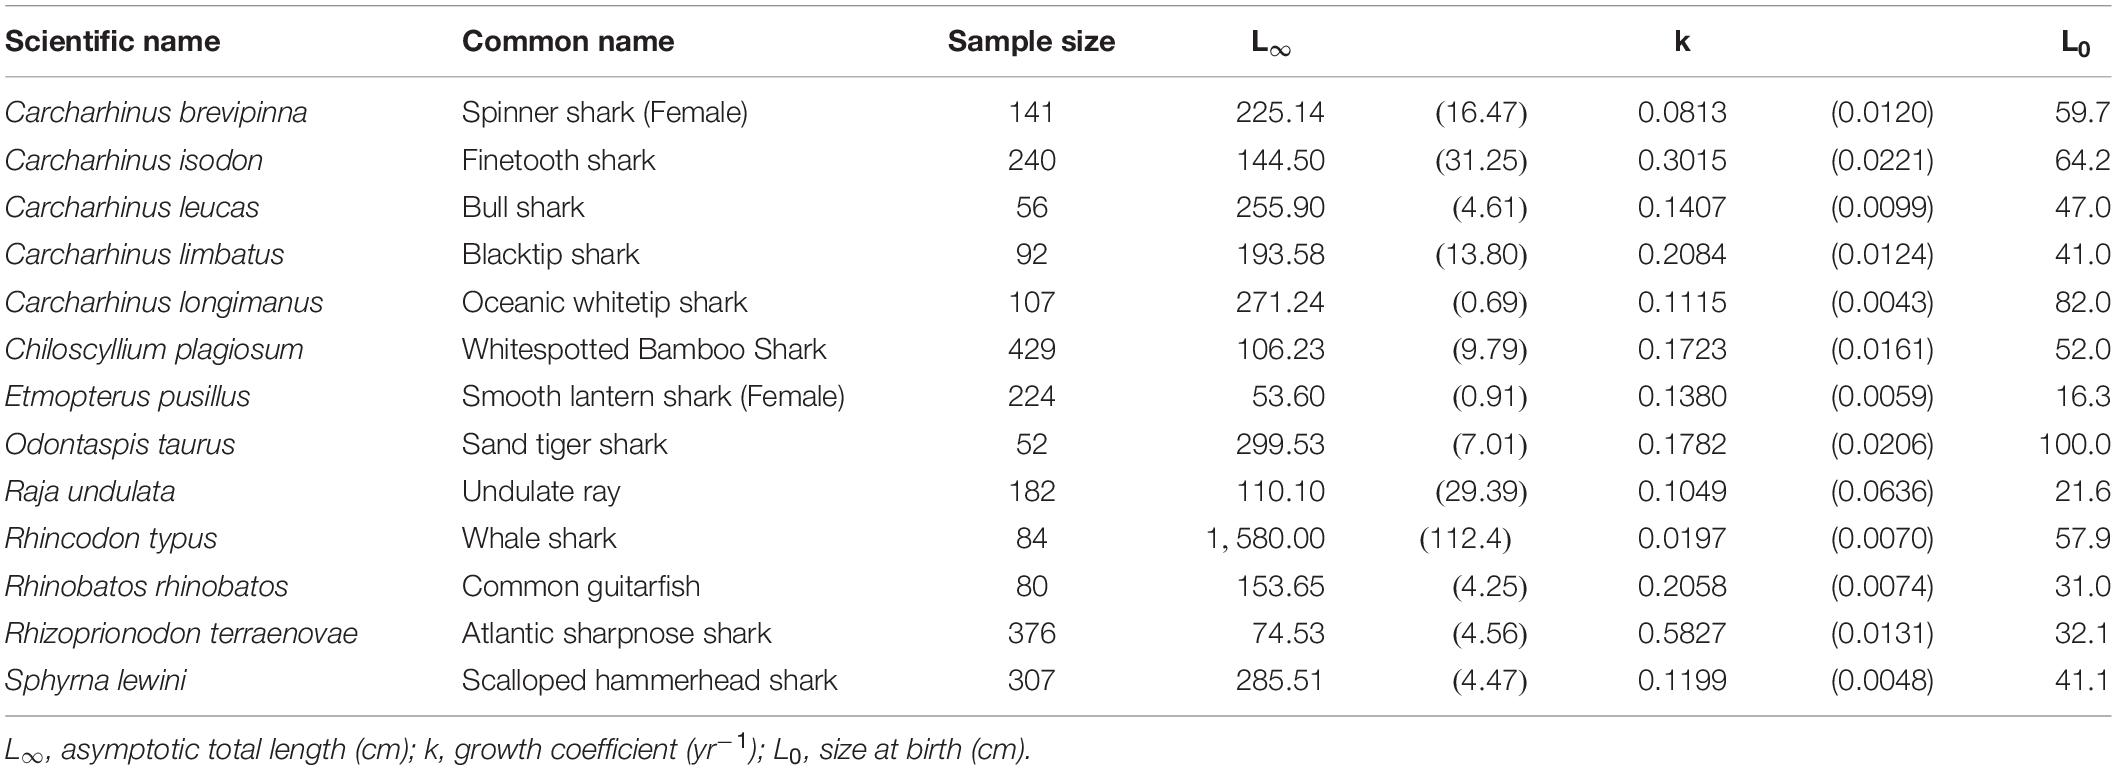
Table 2. Growth parameters of the species best fit by the two-parameter VBGM. Parenthese indicate standard errors.
Robertson Model as the Best-Fit Growth Model
The Roberson model provided the best fit for 14 species (15 cases) (Table 3), including 7 sharks and 8 skates/rays, comprising 25% and 50% (Figure 1) of the sharks and skates/rays in this study, respectively. Four species (27%) were large sharks, 3 species (20%) were small sharks, and 8 species (53%) were skates/rays (Figure 2).
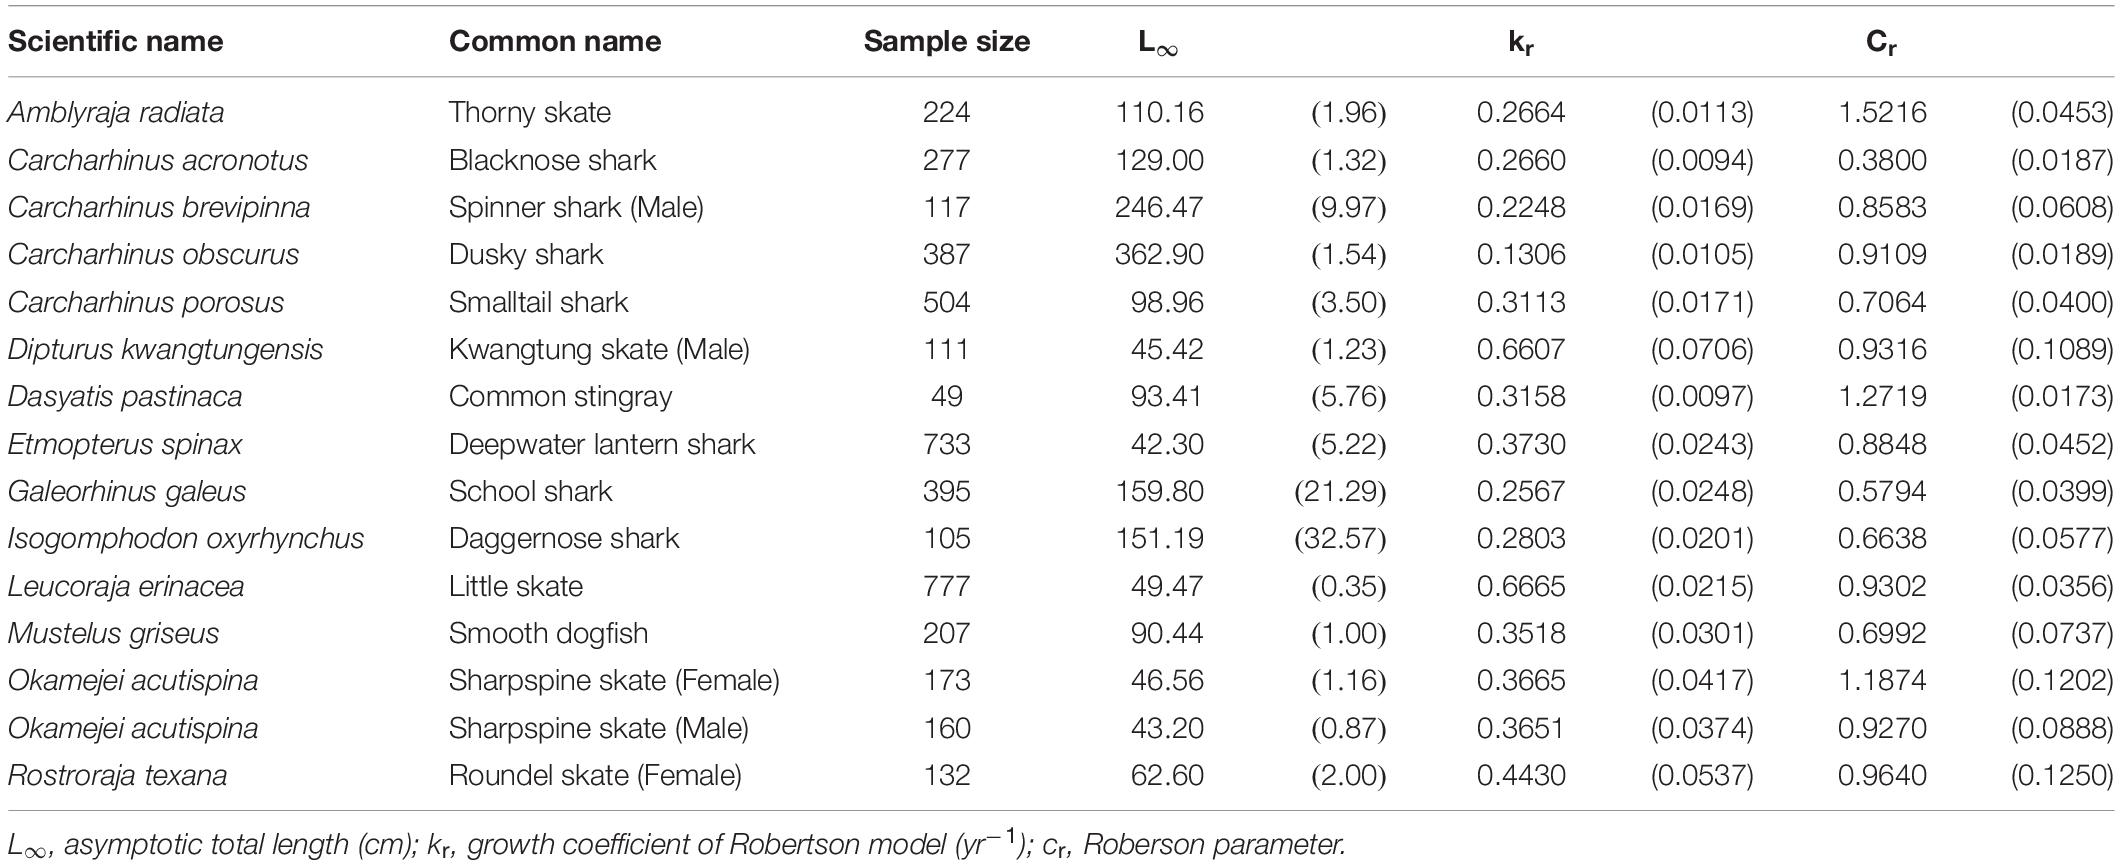
Table 3. Growth parameters of the species best fit by the Robertson model. Parenthese indicate standard errors.
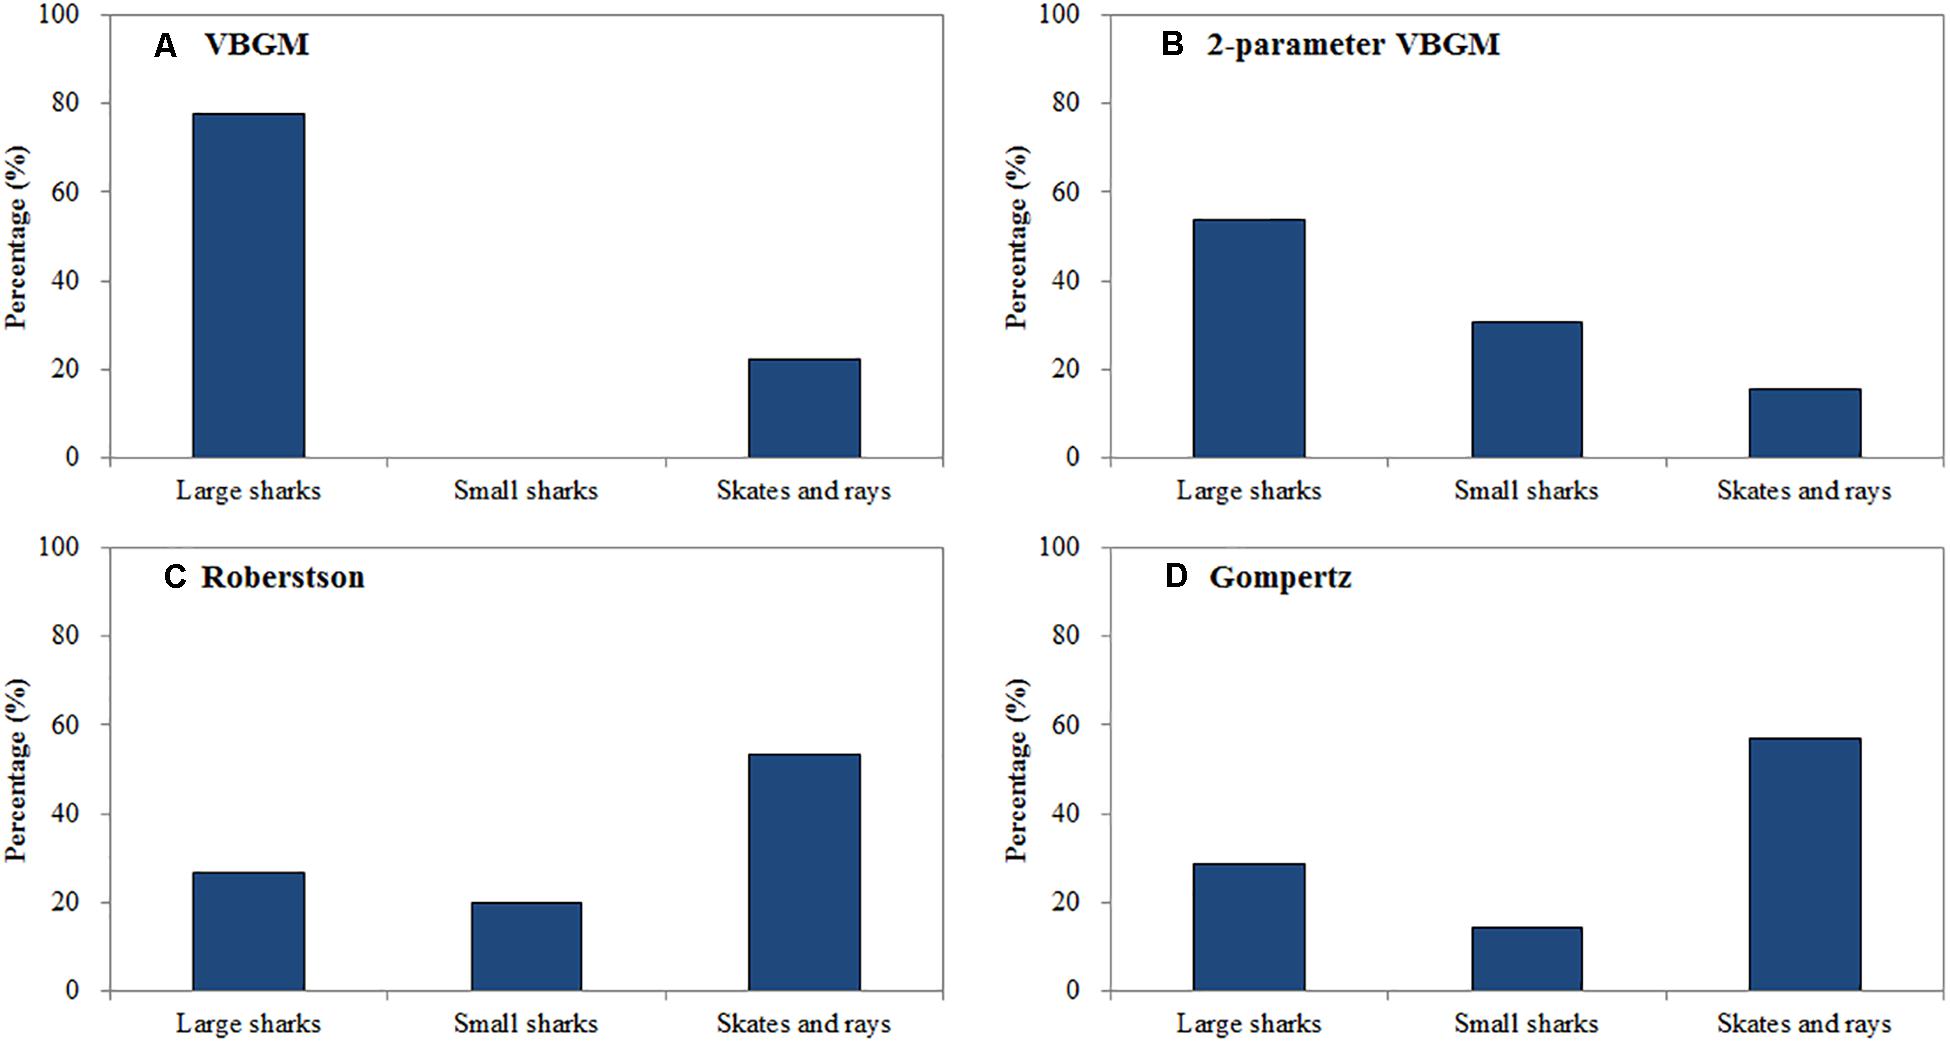
Figure 2. The percentage of large sharks, small sharks and skates and rays in each best-fit growth model. (A) VBGM, (B) two-parameter VBGM, (C) Robertson growth model, (D) Gompertz growth model.
The thorny skate, blacknose shark Carcharhinus acronotus, male spinner shark, daggernose shark Isogomphodon oxyrhynchus, school shark Galeorhinus galeus, and dusky shark fell into the large-size category (L∞ > 100 cm). The remainder fell into the small-size category (L∞ < 100 cm). The dusky shark had the largest L∞ (L∞ = 362.9 cm), while the deepwater lantern shark had the smallest (L∞ = 42.3 cm). The little skate had the fastest growth rate (kr = 0.667 yr–1), while the dusky shark had the slowest (kr = 0.131 yr–1).
Gompertz Model as the Best-Fit Growth Model
The Gompertz model provided the best fit for 6 species (7 cases) (Table 4), including the yellownose skate, male smooth lantern shark, winter skate, gummy shark (both sexes), male roundel skate, and cuckoo ray Leucoraja naevus. The cuckoo ray, male smooth lantern shark, and male roundel skate fell into the small-size category (L∞ < 100 cm). While the yellownose skate and winter skate fell into the large-size category (L∞ > 100 cm). The male roundel skate had the fastest growth rate (kg = 0.448 yr–1), while the female gummy shark had the slowest growth rate (kg = 0.126 yr–1).
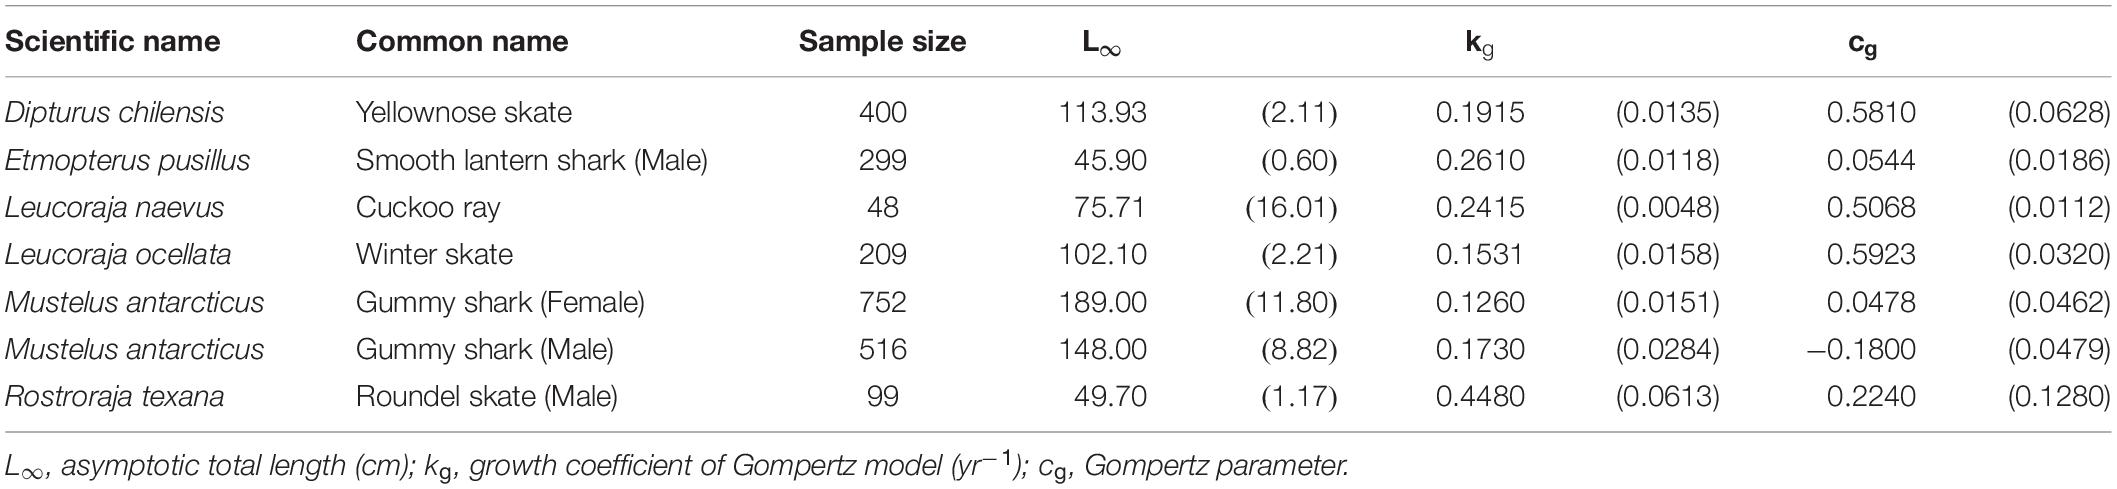
Table 4. Growth parameters of the species best fit by the Gompertz model. Parenthese indicate standard errors.
In summary, sharks were best fit by the two-parameter VBGM (39%) and VBGM (25%). Large sharks were best fit by the VBGM (35%) and the two-parameter VBGM (35%), small sharks were best fit by the two-parameter VBGM (50%) and Robertson model (38%), and skates/rays were best fit by the Robertson model (50%) and the Gompertz model (25%) (Figure 2). For 6 species with sex-specific data, same best-fit models were found in both sexes for the gummy shark (Gompertz model) and sharpspine skate (Robertson model). While, different best-fit models between sexes were found for the spinner shark (two-parameter VBGM and Robertson model), smooth lantern shark (two-parameter VBGM and Robertson model), roundel skate (Robertson and Gompertz model), and Kwangtung skate (VBGM and Robertson model) (Tables 1–4).
Discussion
Cailliet and Goldman (2004) intensively reviewed 115 publications on the age and growth of 91 species of chondrichthyans, and Cailliet et al. (2006) presented updated information on 28 new studies. However, most of these studies did not provide either length-at-age or age-length key data. Thus, only 38 species with either observed length-at-age or age-length key data were used in this study.
Uncertainties
As mentioned above, observed length-at-age data were available for only 10 of 38 species. For the remaining 30 species, figures were generated (simulated) from age-length key data. Because such simulations may not be representative of real observations, there may be inaccuracies in the growth parameter estimates. Some species were represented by a small sample size - the common stingray, sand tiger shark, cuckoo ray, etc. Because of this, and due to a lack of small or large specimens, the size-at-age data may not cover the whole life history of the fish. As a result, estimated parameters might not accurately describe the growth over the entire life history. Cailliet and Goldman (2004) stated that growth parameter estimates are greatly influenced by a lack of very young or old individuals. The existence of length-at-birth information may therefore have a significant effect on the choice of growth model. The size at birth and the growth in neonate stage of fish cannot be well described by the VBGM, the Robertson, and the Gompertz models (Cailliet and Goldman, 2004). On the other hand, the two-parameter VBGM can better describe the growth in the early life stage (Cailliet and Goldman, 2004). In this study, the simulated observation data set was adopted only when its mean length and standard deviation approach to observed values within limit values. Several simulations were made for each species and although minor variations in growth parameter estimates were noted, this had no effect on the selection of best-fit growth model. As for the model selection, Brewer et al. (2016) concluded that the AIC performs as well as the BIC when the heterogeneity is small, but the BIC performs better if the unobserved heterogeneity between data sets is large. In the present study, as no large heterogeneity between data was found, the same best-fit growth model was selected for 32 of the 38 species using the three criteria. In addition, only slightly inconsistence in the minimum values of the three criteria was found for the other 6 species. Therefore, the best-fit growth model selection in this study was believed to be robust.
Pardo et al. (2013) recommended three-parameter VBGF and discourage use of the two-parameter VBGF because it results in substantially biased growth estimates even with slight variations in the value of fixed L0. That study was based on simulated data (large sample size for each age class) yet not the observed length at age data. However, in most age and growth studies including this study, the sample sizes of very small and very large fish are less than that of medium size fish. So, the conclusion made by Pardo et al. (2013) may not be necessarily true for all elasmobranchs. In addition, compared with teleost fish, the size at birth can be easier estimated for elasmobranchs particularly the viviparous or ovoviviparous species. We believe the two-parameter VBGM can better describe the growth in the early life stage of some large pelagic elasmobranch species as VBGM, Robertson, and Gompertz model usually overestimate or underestimate the L0.
The Basic Theory of Growth Equation
In this study, growth of the bull shark was best described by the two-parameter VBGM. According to Schmid and Murru (1994), the juvenile bull shark allocates most of its energy to catabolism and waste and little to growth. Conversely, the chain dogfish Scyliorhinus rotifer, similar to the species best described by the Robertson model in this study, allocates most of its energy to growth and reproduction (Duffy, 1999). This suggests that small-size species allocate the most energy to growth and reproduction, while the converse is true for large-size species. The fact that the VBGM or two-parameter best fit large sharks, while the Robertson and Gompertz models best fit small sharks may therefore be related to their energy allocation.
Cailliet and Goldman (2004) suggested that the Gompertz model better describes changes in body weight over time than changes in length. However, this hypothesis cannot be tested because age-at-weight data are not available in the literature. Most sharks are torpedo-shaped and large, while most skates and rays are flat and small. The best-fit growth model might be related to the ratio of size-at-maturity and maximum observed size. Species for which the VBGM and two-parameter VBGM provide the best fit are mostly sharks that tend to be late-maturing (Table 5), e.g., the pelagic thresher shark, bull shark and blacktip shark. Species best fit by the Robertson and Gompertz models tend, in contrast, to be early-maturing, such as the common stingray, sharpspine skate, and cuckoo ray (Table 5).
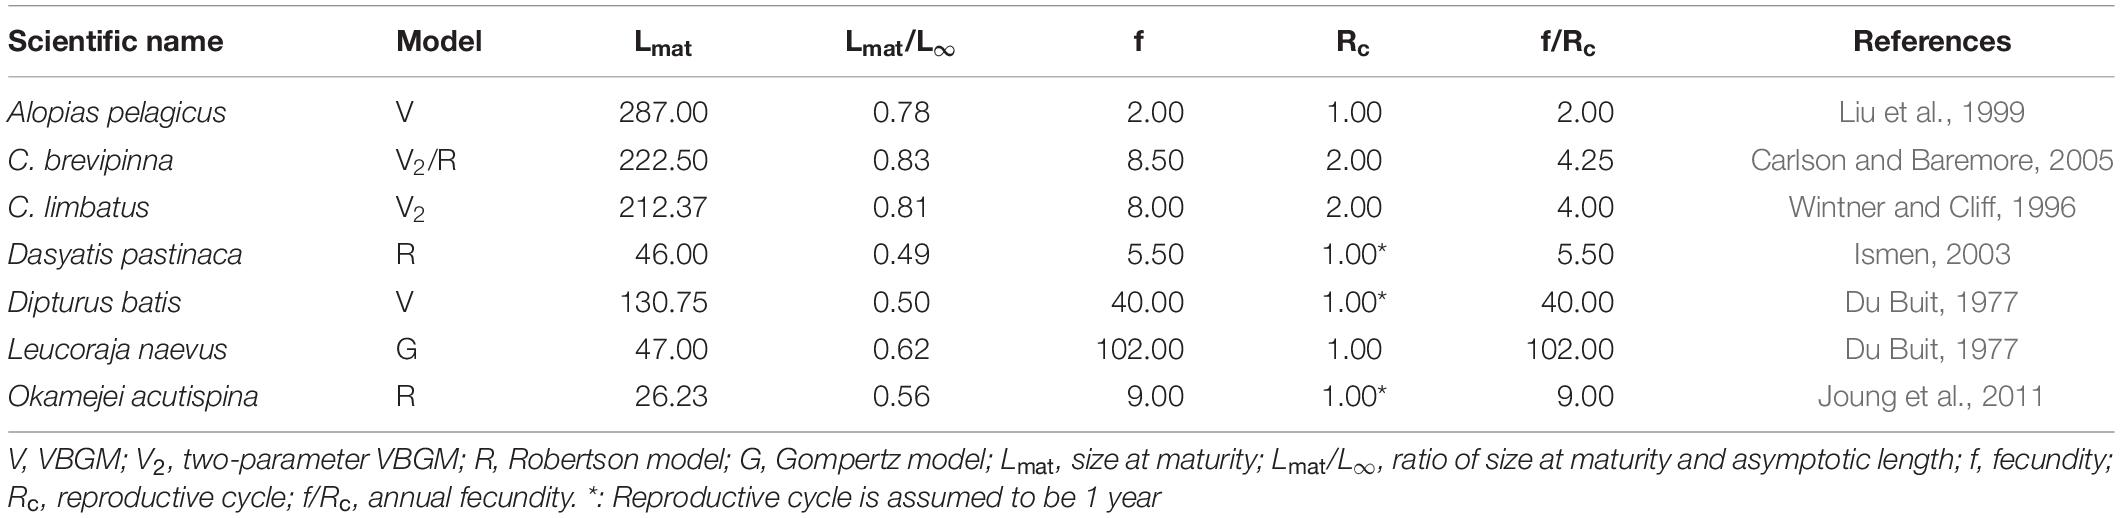
Table 5. The parameters of maturity and reproduction of elasmobranchs in each best-fit growth model.
Other Growth Models
The four-parameter Richards growth model is a general form of the VBGM, Robertson, and Gompertz models and is considered superior to the three-parameter growth models (Quinn and Deriso, 1999). However, in this study, the lack of large specimens and the relatively small sample size for certain species may cause the inconvergence of iterations in parameter estimation by non-linear procedures. Araya and Cubillos (2006) used a two-phase growth model (TPGM) to fit for the porbeagle shark Lamna nasus and leopard shark Triakis semisfaciata and concluded that the model provided a better estimate of elasmobranch growth than the VBGM. This finding was later supported by Braccini et al. (2007) and Mejía-Falla et al. (2014) in their study of the piked spurdog Squalus megalops and the round stingray Urotrygon rogersi. The TPGF is a four or five-parameter growth model; the additional parameter is the age at which transition between two phases occurs. Because more detailed age-length data are required for this model, it was not applied in this study. Rogers-Bennett and Rogers (2016) also proposed a two-step growth model to account for the variation in growth rate during different life stages (juvenile vs adult) for marine invertebrates. However, because the size at maturity information is not necessarily available for all species used in this study, this approach has not been used.
Estimation of Parameters
In this study, L∞ estimates derived by the VBGM and two-parameter VBGM were larger than those derived by the Robertson and Gompertz models (Figure 3). A similar finding has been documented by Katsanevakis and Maravelias (2008). Therefore, it seems that L∞ is closely related to growth model selection.
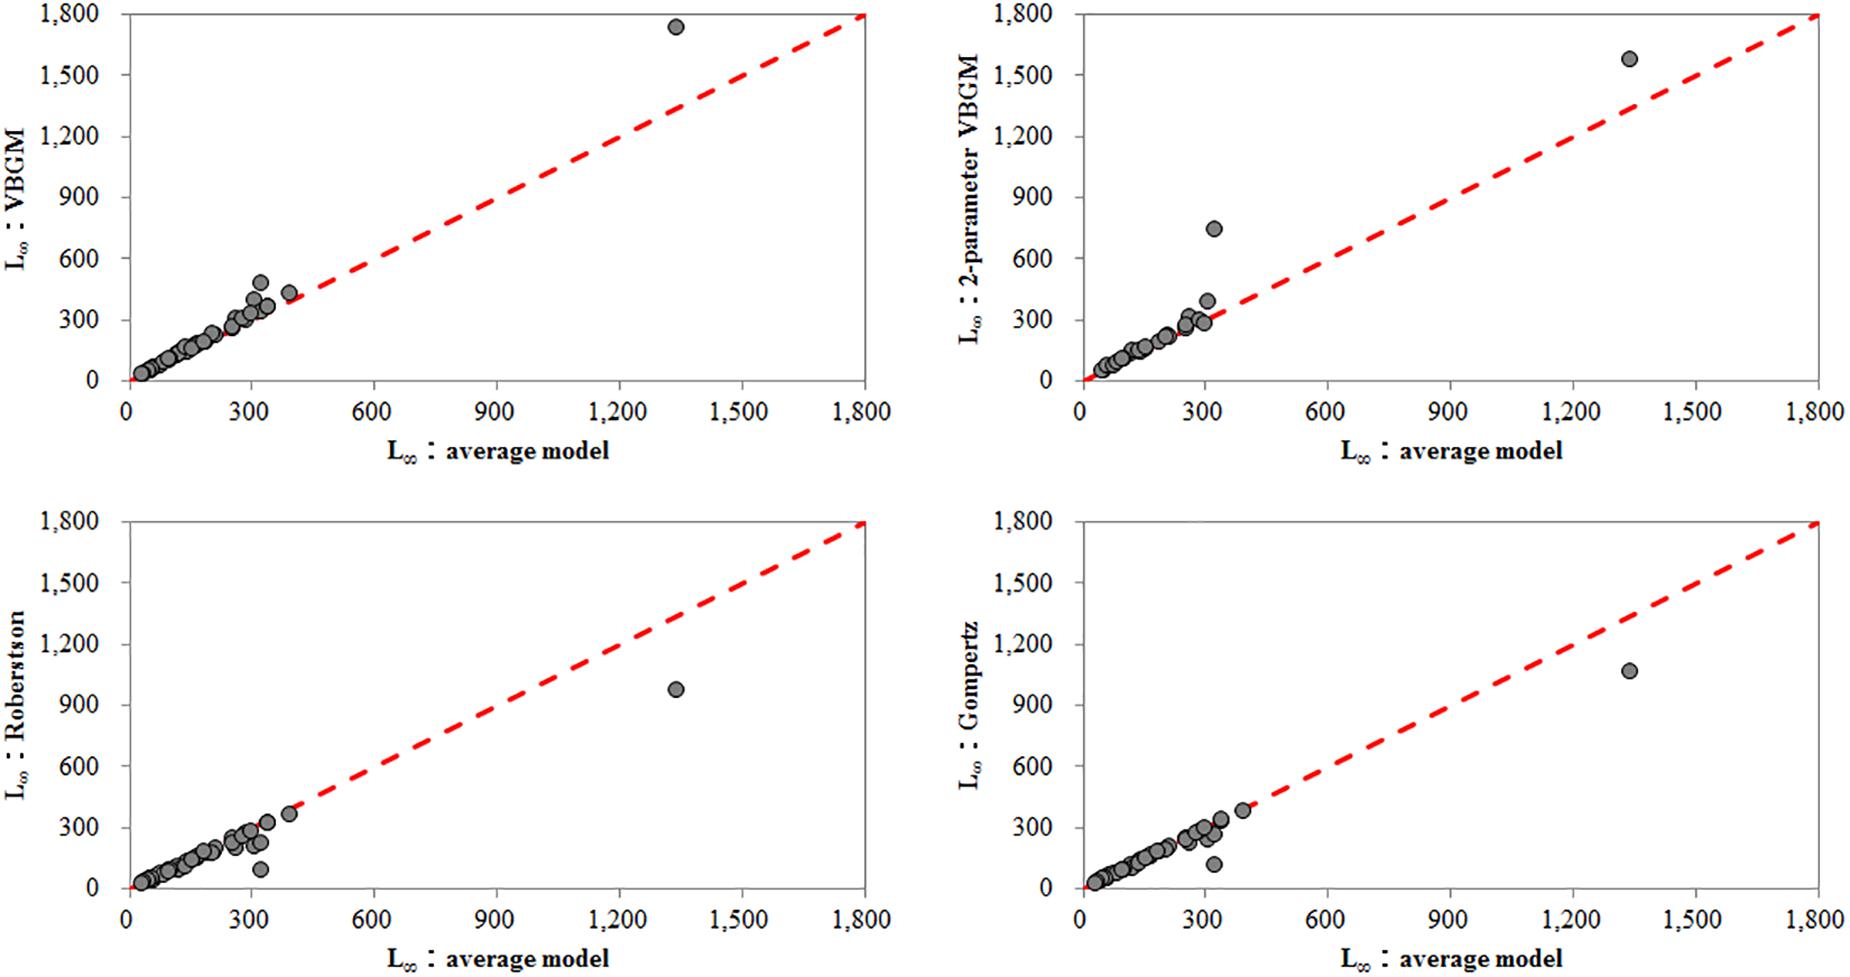
Figure 3. The relationship between asymptotic total length estimated from each best-fit growth model and averaged asymptotic total length.
In this study, the VBGM provided the best fit for 9 species/cases, with estimated k values of 0.024 - 0.294 year–1. All but one of these are moderate or slow-growing species (k < 0.2 year–1). Recent ageing studies of the blue shark supported that VBGM is best-fit model for the blue shark with k < 0.2 year–1 (k = 0.130 year–1, 0.128-0.164 year–1 in the South Atlantic and the South Pacific (Joung et al., 2017, 2018). The two-parameter VBGM was the best fit for 13 species/cases, with estimated k values of 0.020 - 0.583 year–1. Most of these are also moderate- or slow-growing species (k < 0.2 year–1), the exceptions being the Atlantic sharpnose shark Rhizoprionodon terraenovae, finetooth shark Carcharhinus isodon, blacktip shark C. limbatus, and common guitarfish Rhinobatos (k > 0.2 year–1). The Robertson model provided the best fit for 14 species (15 cases), with estimated kr values of 0.131-0.667 year–1. Most of these are fast-growing species (kr > 0.2 year–1), the exception being the dusky shark (kr < 0.2 year–1). The Gompertz model was the best fit for 6 species (7 cases), with estimated kg values of 0.126-0.448 year–1. These included moderate-growing species, the yellownose skate, winter skate, and cuckoo ray (0.15 < kg < 0.25 year–1). The VBGM and two-parameter VBGM provided the best fit for slow-to moderate-growing species, while the Gompertz model was the best fit for moderate-growing species, and the Robertson model was the best fit for fast-growing species (Figure 4).
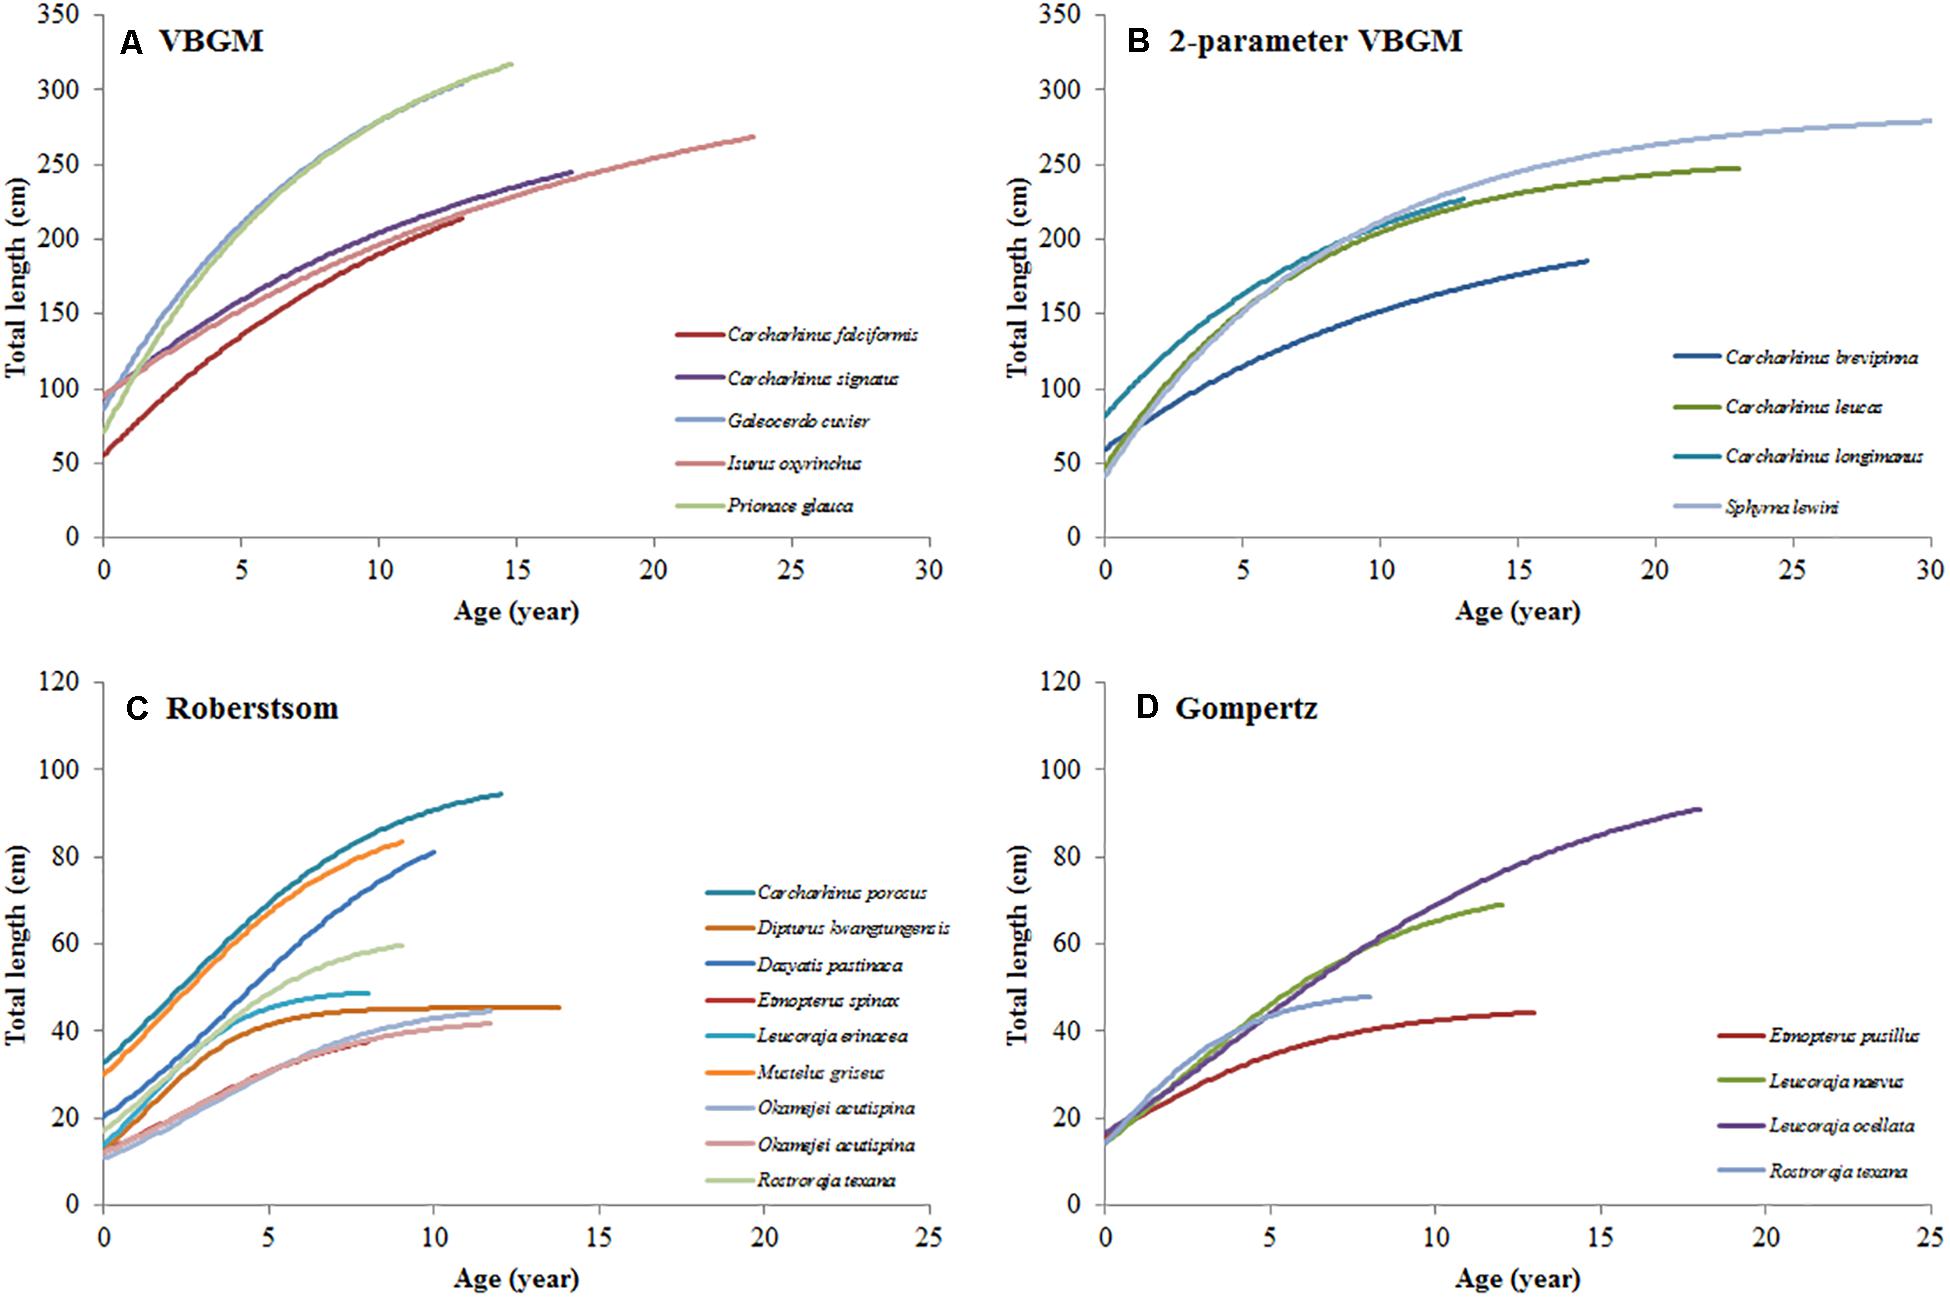
Figure 4. The growth curves of selected species in each best-fit growth model. (A) VBGM, (B) two-parameter VBGM, (C) Robertson growth model, (D) Gompertz growth model.
Contingency of Fitting Models
For the 9 species best fit by the VBGM, the second best choice was the Gompertz model (78%) that without size at birth information followed by the two-parameter VBGM (22%) that with size at birth data. For the species best fit by the two-parameter VBGM (13 species), the second-best choice was the VBGM (92%) and the Gompertz model (8%), while for the species best fit by the Robertson model (15 species), the second-best choice was the Gompertz model (100%). For the species best fit by the Gompertz model (7 species), the second-best choice was the two-parameter VBGM, and the Robertson model (43% each). In their study of elasmobranchs, Katsanevakis and Maravelias (2008) proposed four growth models in order of fit, as follows: Logistic-Gompertz-VBGM-Power (where Gompertz is the best choice, and Logistic and VBGM are the second-best choices). They concluded that the VBGM provided the best description of growth among elasmobranchs and bony fish. Our study arrived at a similar order of growth models, namely Robertson (Logistic)-Gompertz-VBGM-two-parameter VBGM, although it should be noted that the previous study separated species into sharks, skates, and rays. Mollet et al. (2002) found that the best-fit for the growth of the pelagic stingray was the Gompertz model. In this study, the growth of skates/rays is best described by the S-shaped Gompertz or Robertson models.
Comparison With Literature Results
Of the 38 species analyzed in this study, 12 have been previously fit with more than one growth model in the literature. Of these, our study found the same best-fit growth model for 10 species. The remaining 26 species have previously been described using VBGM alone, but our study found that 21 of these species are better fit by an alternative model. Thorson and Simpfendorfer (2009) have suggested using AICc, AICc weight, and multi-model inference to obtain the most appropriate model to describe fish growth. In this study, the best-fit growth model for each stock was selected based on similar criteria, AICc, ΔAICc, the AICc weight, the BIC, and the LOOCVadditionally suggesting that the derived results are reasonable.
The Best-Fit Growth Models Associate With Life History Traits
Based on their life history traits, three groups of sharks have been identified using cluster analysis (Liu et al., 2015) as follows. Group 1: large size, extended life span, slow growth, e.g., the bull shark, scalloped hammerhead shark, and oceanic whitetip shark. These are similar to the species best described in this study by the two-parameter VBGM. Group 2: small size, short life span, rapid growth, e.g., the smooth dogfish and blacknose shark. These are similar to the species best described in this study by the Robertson model. Group 3: late-maturing, moderate life span, e.g., the pelagic thresher shark, blue shark and night shark. These are similar to the species best described in this study by the VBGM. This study found that the Robertson and Gompertz models provided the best fit for skates and rays. Those best described by the Robertson model are characterized by small size and rapid growth, e.g., the thorny skate, common stingray and little skate. Those best described by Gompertz have the characters of small or large size and moderate growth, e.g., the winter skate, yellownose skate, and cuckoo ray.
As mentioned above, the Orectolobiformes, Lamniformes and large-sized species of Carcharihidae are best fit by the VBGM or two-parameter VBGM. Rajiformes and Myliobatiformes are best fit by the Robertson or Gompertz model, while the Robertson model best describes the growth of small-size species of Carcharihidae.
Most species for which the VBGM or two-parameter VBGM provided the best fit are viviparous (70% and 54% respectively), while all species best described by the Gompertz models are oviparous. Species best described by the VBGM or two-parameter VBGM have lower annual fecundity and mature later (higher Lmat/L∞) than those best described by the Robertson or Gompertz models (Table 5).
Although VBGM has been widely used in fitting age and length data, where alternative models have not been tried and evaluated, the derived age structure may be biased and inaccurate (Roff, 1980). This will cause further errors in the estimates of mortality, yield per recruit, and stock assessment. If the Robertson or Gompertz models better describe the growth of certain species, variations in different life stages can be considered, and stock assessment will be improved (Carlson and Baremore, 2005).
Katsanevakis and Maravelias (2008) suggested that multi-model inference should be used to estimate growth for aquatic taxa. The authors concluded that the weighted means of the growth parameters derived from different growth models based on AICc weights are better estimators than those from a single growth model. However, given the definitions of growth coefficient vary among different growth models, this approach may not be appropriate and more discussion is needed. Smart et al. (2016) examined 74 elasmobranch growth studies to test the hypothesis that the best growth model is related the shape, reproductive mode, or life history trait using general linear models. The authors rejected the hypothesis as VBGM best fit all taxa and reproductive modes. It is concluded that the best growth model is not associated with the shape or reproductive mode of sharks and rays and recommended multi-model approach should be applied to growth estimate for elasmobranchs. However, we found the best-fit growth models for elasmobranchs were associated with their life history traits but with some exceptions in this study. These findings meet the basic theory of growth equation. Given this, it is suggested that the best-fit model selected for each group in this study should be included as the candidate when using a multi-model approach in growth estimation for elasmobranchs in the future. Additional growth model such as Schnute and Richards (1990) model should also be considered.
Conclusion
The best-fit growth model for elasmobranchs depends on their size and life history characteristics. VBGM provides the best fit for large pelagic sharks that are late-maturing and of moderate longevity. These include the pelagic thresher and blue sharks. The two-parameter VBGM best fits large pelagic sharks that are slow-growing and have extended longevity, such as the bull and oceanic whitetip sharks. The Robertson model is the best-fit for fast-growing small sharks that inhabit deep water. For small sharks in shallow waters, the two-parameter VBGM and the Robertson model provide the best description. The Robertson model is also the best-fit for medium and small-size demersal skates and rays, which are fast-growing and of short longevity, such as the smooth dogfish and thorny skate. The Gompertz model best fits large or small, median-growing skates and rays, such as the yellownose and winter skates. For the whale shark, with its huge size, slow growth, extended longevity, late maturity, and prolonged reproductive cycle, the two-parameter VBGM provides the best fit. Although it was found the best-fit growth models for elasmobranchs were associated with their life history traits, exceptions were also noted. Therefore, a multi-model approach incorporating the best-fit model selected for each group in this study was recommended in growth estimation for elasmobranchs.
Data Availability Statement
The raw data supporting the conclusions of this article will be made available by the authors, without undue reservation.
Author Contributions
K-ML and C-BW conceived and designed the experiments and performed the experiments. C-BW, W-PT, K-YS, and K-ML analysed the data. S-JJ, W-PT, and K-YS contributed reagents, materials, and analysis tools. K-ML and C-BW wrote the manuscript. All authors contributed to the article and approved the submitted version.
Funding
This study was financially supported by the Ministry of Science and Technology, Taiwan under Contracts no. MOST 105-2313-B-019-005-MY3.
Conflict of Interest
The authors declare that the research was conducted in the absence of any commercial or financial relationships that could be construed as a potential conflict of interest.
Supplementary Material
The Supplementary Material for this article can be found online at: https://www.frontiersin.org/articles/10.3389/fmars.2021.591692/full#supplementary-material
Supplementary Table 1 | Age-length data, reproduction strategy and the information of age determination used in the present study. “F”, female; “M”, male; “C”, both sexes combined; “a”, sample simulation; “b”, age-length-key; “c”, original data; “Ver”, vertebrae; “Sp”, spines; ∗, no L0; “R”, reproduction strategy; “o”, oviparity; “v”, viviparity; “ov”, aplacental viviparity; “CV”, coefficient of variation; “PA”, percent agreement; “IAPE”, index of average percentage error; “MIR”, marginal increment ratio analysis; “EA”, edge analysis.
Supplementary Table 2 | A list of elasmobranchs used in the present study.
Supplementary Table 3 | The AIC, AICc, BIC, and LOOCV of different growth models for each species.
Footnotes
References
Akaike, H. (1973). “Information theory as an extension of the maximum likelihood principle,” in Proceedings of the 2nd International Symposium on Information Theory, eds F. Csáki and B. N. Petrov (Budapest: Akademiai Kiado), 267–281.
Araya, M., and Cubillos, L. A. (2006). Evidence of two-phase growth in elasmobranches. Environ. Biol. Fishes 77, 293–300. doi: 10.1007/978-1-4020-5570-6_9
Beverton, R. J. H. (1954). Notes on the Use of Theoretical Models in the Study of the Dynamics of Exploited Fish Populations. Beaufort, NC: US Fishery Laboratory.
Beverton, R. J. H., and Holt, S. J. (1957). On the Dynamics of Exploited Fish Populations. Fisheries Investment Series 2, Vol. 19. London: UK Ministry of Agriculture and Fisheries, 533.
Braccini, J. M., Gillanders, B. M., Walker, T. I., and Tovar-Avila, J. (2007). Comparison of deterministic growth models fit to length-at-age data of the piked spurdog (Squalus megalops) in south-eastern Australia. Mar. Freshw. Res. 58, 24–33. doi: 10.1071/mf06064
Branstetter, S., and Musick, J. A. (1994). Age and growth estimates for the sand tiger in the northwestern Atlantic Ocean. Trans. Am. Fish. Soc. 123, 242–254. doi: 10.1577/1548-8659(1994)123<0242:aageft>2.3.co;2
Breiman, L., and Spector, P. (1992). Submodel selection and evaluation in regression. The X-random case. Int. Stat. Rev. 60, 291–319. doi: 10.2307/1403680
Brewer, M. J., Butler, A., and Cooksley, S. L. (2016). The relative performance of AIC, AICC and BIC in the presence of unobserved heterogeneity. Methods Ecol. Evol. 7, 679–692. doi: 10.1111/2041-210x.12541
Burnham, K. P., and Anderson, D. R. (2002). Model Selection and Multimodel Inference: A Practical-Theoretic Approach. New York, NY: Springer.
Cailliet, G. M., and Goldman, K. J. (2004). “Age determination and validation in chondrichthyan fishes,” in Biology of Sharks and Their Relatives, eds J. Carrier, J. A. Musick, and M. R. Heithaus (Boca Raton, FL: CRC Press), 399–447. doi: 10.1201/9780203491317.pt3
Cailliet, G. M., Radtke, M. S., and Welden, B. A. (1986). “Elasmobranch age determination and verification: a review,” in Indo-Pacific Fishes Biology: Proceedings of the Second International Conference on Indo-Pacific Fishes, eds T. Uyeno, R. Arai, and T. Matsuura (Tokyo: Ichthyological Society of Japan), 345–359.
Cailliet, G. M., Smith, W. D., Mollet, H. F., and Goldman, K. J. (2006). Age and growth studies and growth of chondrichthyan fishes: the need for consistency in terminology, verification, validation, growth function. Environ. Biol. Fishes 77, 211–228. doi: 10.1007/978-1-4020-5570-6_2
Campana, S. E., Jones, C., McFarlane, G. A., and Myklevoll, S. (2006). Bomb dating and age validation using the spines of spiny dogfish (Squalus acanthias). Environ. Biol. Fishes 77, 327–336. doi: 10.1007/978-1-4020-5570-6_13
Carlson, J. K., and Baremore, I. E. (2005). Growth dynamics of the spinner shark (Carcharhinus brevipinna) off the United States southeast and Gulf of Mexico coasts: a comparison of methods. Fish. Bull. 103, 280–291.
Carlson, J. K., Cortés, E., and Bethea, D. M. (2003). Life history and population dynamics of the finetooth shark (Carcharhinus isodon) in the northeastern Gulf of Mexico. Fish. Bull. 101, 281–292.
Carlson, J. K., Cortés, E., and Johnson, A. G. (1999). Age and growth of the blacknose shark, Carcharhinus acronotus, in the eastern Gulf of Mexico. Copeia 1999, 684–691. doi: 10.2307/1447600
Chang, J. H., and Liu, K. M. (2009). Stock assessment of the shortfin mako shark, Isurus oxyrinchus, in the Northwest Pacific Ocean using per-recruit and virtual population analyses. Fish. Res. 98, 92–101. doi: 10.1016/j.fishres.2009.04.005
Chen, W. K., Chen, P. C., Liu, K. M., and Wang, S. B. (2007). Age and growth estimates of the whitespotted bamboo shark, Chiloscyllium plagiosum, in the northern waters of Taiwan. Zool. Stud. 46, 92–102.
Coelho, R., and Erzini, K. (2002). Age and growth of the undulate ray, Raja undulata, in the Algarve (southern Portugal). J. Mar. Biol. Assoc. U.K. 82, 987–990. doi: 10.1017/s0025315402006495
Coelho, R., and Erzini, K. (2007). Population parameters of the smooth lantern shark, Etmopterus pusillus, in southern Portugal (NE Atlantic). Fish. Res. 86, 42–57. doi: 10.1016/j.fishres.2007.04.006
Coelho, R., and Erzini, K. (2008). Life history of a wide-ranging deepwater lantern shark in the north-east Atlantic, Etmopterus spinax (Chondrichthyes: Etmopteridae), with implications for conservation. J. Fish Biol. 73, 1419–1443. doi: 10.1111/j.1095-8649.2008.02021.x
Du Buit, M. H. (1977). Age et croissance de Raja batis et de Leucoraja naevus en Mer Celtique. ICES J. Mar. Sci. 37, 261–265. doi: 10.1093/icesjms/37.3.261
Duffy, K. A. (1999). Feeding, Growth and Bioenergetics of the Chain Dogfish, Scyliorhinus retifer. Ph. D. Thesis, University of Rhode Island, Kingston, RI.
Ebert, D. A., Smith, W. D., Haas, D. L., Ainsley, S. M., and Cailliet, G. M. (2007). “Life history and population dynamics of Alaskan skates: providing essential biological information for effective management of bycatch and target species,” in North Pacific Research Board Project Final Report (Anchorage, AK: North Pacific Research Board), 130.
Fabens, A. J. (1965). Properties and fitting of the von Bertalanffy growth curve. Growth 29, 265–289.
Gelsleichter, J., Piercy, A., and Musick, J. A. (1998). Evaluation of copper, iron and lead substitution techniques in elasmobranch age determination. J. Fish Biol. 53, 465–470. doi: 10.1111/j.1095-8649.1998.tb00995.x
Geraghty, P. T., Mecbeth, W. G., Harry, A. V., Bell, J. E., Yerman, M. N., and Williamson, J. E. (2014). Age and growth parameters for three heavily exploited shark species off temperate eastern Australia. ICES J. Mar. Sci. 71, 559–573. doi: 10.1093/icesjms/fst164
Gompertz, B. (1825). On the nature of the function expressive of the law of human mortality and on a new mode of determining life contingencies. Philos. Trans. R. Soc. London 115, 513–585. doi: 10.1098/rstl.1825.0026
Harry, A. V. (2018). Evidence for systemic age underestimation in shark and ray ageing studies. Fish Fish. 19, 185–200. doi: 10.1111/faf.12243
Hoenig, J. M., and Gruber, S. H. (1990). “Life history patterns in the elasmobranches: implications for fisheries management,” In Elasmobranchs as Living Resources: Advances in the Biology, Ecology, Systematics, and the Status of the Fisheries: NOAA Technical Report NMFS. eds H. L. Pratt, S. H. Gruber, and T. Taniuchi (Washington, DC: NOAA). 90, 1–15.
Hsu, H. H. (2009). Age, Growth, and Migration of the Whale Shark, Rhincodon Typus, in the Northwest Pacific. Ph. D. Thesis, National Taiwan Ocean University, Keelung.
Hsu, H. H., Joung, S. J., Hueter, R., and Liu, K. M. (2014). Age and growth of the whale shark, Rhyncodon typus in the northwestern Pacific. Mar. Freshw. Res. 65, 1145–1154. doi: 10.1071/mf13330
Huang, J. C. (2006). Age and Growth of Blue Shark, Prionace Glauca in the Northwestern Pacific. M. Sc. Thesis, National Taiwan Ocean University, Keelung.
Hurvich, C. M., and Tsai, C. L. (1989). Regression and time series model selection in small samples. Biometrika 76, 297–307. doi: 10.1093/biomet/76.2.297
Ismen, A. (2003). Age, growth, reproduction and food of common stingray (Dasyatis pastinaca L., 1758) in Ýskenderun Bay, the eastern Mediterranean. Fish. Res. 60, 169–176. doi: 10.1016/s0165-7836(02)00058-9
Ismen, A., Yıgın, C., and Ismen, P. (2007). Age, growth, reproductive biology and feed of the common guitarfish (Rhinobatos Rhinobatos Linnaeus, 1758) in Ýskenderun Bay, the eastern Mediterranean Sea. Fish. Res. 84, 263–269. doi: 10.1016/j.fishres.2006.12.002
Joung, S. J., Chen, C. C., Liu, K. M., and Hsieh, T. C. (2015a). Age and growth estimate of the Kwangtung skate, Dipturus kwangtungensis in the northern waters off Taiwan. J. Mar. Biol. Assoc. UK 96, 1395–1402. doi: 10.1017/S0025315415001307
Joung, S. J., Chen, J. H., Chin, C. P., and Liu, K. M. (2015b). Age and growth estimates of the dusky shark, Carcharhinus obscurus, in the western North Pacific Ocean. Terr. Atmos. Oceanic Sci. 26, 153–160. doi: 10.3319/TAO.2014.10.15.01(Oc)
Joung, S. J., Chen, N. F., Hsu, H. H., and Liu, K. M. (2016). Estimates of life history parameters of the oceanic whitetip shark, Carcharhinus longimanus, in the western North Pacific Ocean. Mar. Biol. Res. 12, 758–768. doi: 10.1080/17451000.2016.1203947
Joung, S. J., Lee, P. H., Liu, K. M., and Liao, Y. Y. (2011). Estimates of life history parameters of the sharpspine skate, Okamejei acutispina, in the northeastern waters of Taiwan. Fish. Res. 108, 258–267. doi: 10.1016/j.fishres.2010.12.013
Joung, S. J., Leu, K. T., Hsu, H. H., and Liu, K. M. (2018). Age and growth estimates of the blue shark, Prionace glauca, in the South Pacific Ocean. Mar. Freshw. Res. 69, 1346–1354. doi: 10.1071/MF17098
Joung, S. J., Leu, K. T., Su, K. Y., Hsu, H. H., and Liu, K. M. (2017). Distribution pattern and age and growth estimates of the blue shark, Prionace glauca, in the South Atlantic Ocean. Mar. Coast. Fish. 9, 38–49. doi: 10.1080/19425120.2016.1249579
Katsanevakis, S. (2006). Modelling fish growth: model selection, multi-model inference and model selection uncertainty. Fish. Res. 81, 229–235. doi: 10.1016/j.fishres.2006.07.002
Katsanevakis, S., and Maravelias, C. D. (2008). Modelling fish growth: multi-model inference as a better alternative to a priori using von Bertalanffy equation. Fish Fish. 9, 178–187. doi: 10.1111/j.1467-2979.2008.00279.x
King, J. R., and McFarlane, G. A. (2003). Marine fish life history strategies: applications to fishery management. Fish. Manage. Ecol. 10, 249–264. doi: 10.1046/j.1365-2400.2003.00359.x
Kinney, M., Wells, R., and Kohin, S. (2016). Oxytetracycline age validation of an adult shortfin mako shark Isurus oxyrinchus after 6 years at liberty. J. Fish Biol. 89, 1828–1833. doi: 10.1111/jfb.13044
Lessa, R., and Santana, F. M. (1998). Age determination and growth of the smalltail shark, Carcharhinus porosus, from northern Brazil. Mar. Freshw. Res. 49, 705–711. doi: 10.1071/mf98019
Lessa, R., Santana, F. M., Batists, V., and Almeida, Z. (2000). Age and growth of the daggernose shark, Isogomphodon oxyrhynchus, from northern Brazil. Mar. Freshw. Res. 51, 339–347. doi: 10.1071/mf99125
Lessa, R., Santana, F. M., and Paglerani, R. (1999). Age, growth and stock structure of the oceanic whitetip shark, Carcharhinus longimanus, from the southwestern equatorial Atl. Fish. Res. 42, 21–30. doi: 10.1016/s0165-7836(99)00045-4
Licandeo, R. R., Lamilla, J. G., Rubilar, P. G., and Vega, R. M. (2006). Age, growth, and sexual maturity of the yellownose skate Dipturus chilensis in the south-eastern Pacific. J. Fish Biol. 68, 488–506. doi: 10.1111/j.0022-1112.2006.00936.x
Liu, K. M., Chen, C. T., Liao, T. H., and Joung, S. J. (1999). Age, growth and reproduction of the pelagic thresher shark, Alopias pelagicus in the northwestern Pacific. Copeia 1999, 68–74. doi: 10.2307/1447386
Liu, K. M., Chin, C. P., Chen, C. H., and Chang, J. H. (2015). Estimating finite rate of population increase for sharks based on vital parameters. PLoS One 10:e0143008. doi: 10.1371/journal.pone.0143008
Liu, K. M., Sibagariang, R. D., Joung, S. J., and Wang, S. B. (2018). Age and growth of the shortfin mako shark in the South Indian Ocean. Mar. Coast. Fish. 10, 577–589. doi: 10.1002/mcf2.10054
Loefer, J. K., and Sedberry, G. R. (2003). Life history of the Atlantic sharpnose shark (Rhizoprionodon terraenovae) (Richardson, 1836) off the southeastern United States. Fish. Bull. 101, 75–88.
Mejía-Falla, P. A., Cortés, E., Navia, A. F., and Zapata, F. A. (2014). Age and growth of the round stingray Urotrygon rogersi, a particularly fast-growing and short lived elasmobranch. PLoS One 9:e96077. doi: 10.1371/journal.pone.0096077
Mollet, H. F., Ezcurra, J. M., and O’Sullivan, J. B. (2002). Captive biology of the pelagic stingray, Dasyatis violacea (Bonaparte, 1832). Mar. Freshw. Res. 53, 531–541.
Moulton, P. L., Walker, T. I., and Saddlier, S. R. (1992). Age and growth studies of gummy shark, Mustelus antarcticus Günther, and school shark, Galeorhinus galeus (Linnaeus), from southern Australian waters. Aust. J. Mar. Freshw. Res. 43, 1241–1267. doi: 10.1071/mf9921241
Natanson, L. J., Gervelis, B. J., Winton, M. V., Hamady, L. L., Gulak, S. J. B., and Carlson, J. K. (2014). Validated age and growth estimates for Carcharhinus obscurus in the northwestern Atlantic Ocean, with pre- and post-management growth comparisons. Environ. Biol. Fishes 97, 881–896. doi: 10.1007/s10641-013-0189-4
Natanson, L. J., Kohler, N. C., Ardizzone, D., Cailliet, G. M., Wintner, S. P., and Mollet, H. F. (2006). Validated age and growth estimates for the shortfin mako, Isurus oxyrinchus, in the North Atlantic Ocean. Environ. Biol. Fishes 77, 367–383. doi: 10.1007/978-1-4020-5570-6_16
Natanson, L. J., Skomal, G. B., Hoffmann, S. L., Porter, M. E., Goldman, K. J., and Serra, D. (2018). Age and growth of sharks: do vertebral band pairs record age? Mar. Freshw. Res. 69, 1440–1452. doi: 10.1071/mf17279
Neer, J. A., and Cailliet, G. M. (2001). Aspects of the life history of the Pacific electric ray, Torpedo californica (Ayres). Copeia 2001, 842–847. doi: 10.1643/0045-8511(2001)001[0842:aotlho]2.0.co;2
Neer, J. A., Thompson, B. A., and Carlson, J. K. (2005). Age and growth of Carcharhinus leucas in the northern Gulf of Mexico: incorporating variability in size at birth. J. Fish Biol. 67, 370–383. doi: 10.1111/j.0022-1112.2005.00743.x
Oshitani, S., Nakano, H., and Tanaka, S. (2003). Age and growth of the silky shark Carcharhinus falciformis from the Pacific Ocean. Fish. Sci. 69, 456–464. doi: 10.1046/j.1444-2906.2003.00645.x
Pardo, S. A., Cooper, A. B., and Dulvy, N. K. (2013). Avoiding fishy growth curves. Methods Ecol. Evol. 4, 353–360. doi: 10.1111/2041-210x.12020
Passerotti, M. S., Carlson, J. K., Piercy, A. N., and Campana, S. E. (2010). Age validation of great hammerhead shark (Sphyrna mokarran), determined by bomb radiocarbon analysis. Fish. Bull. 108, 346–351.
Piercy, A. N., Carlson, J. K., Sulikowski, J. A., and Burgess, G. H. (2007). Age and growth of the scalloped hammerhead shark, Sphyrna lewini, in the north-west Atlantic Ocean and Gulf of Mexico. Mar. Freshw. Res. 58, 34–40. doi: 10.1071/mf05195
Porcu, C., Bellodi, A., Cau, A., Cannas, R., Marongiu, M. F., Mulas, A., et al. (2020). Uncommon biological patterns of a little known endemic Mediterranean skate, Raja polystigma (Risso, 1810). Reg. Stud. Mar. Sci. 34:101065. doi: 10.1016/j.rsma.2020.101065
Pütter, A. (1920). Studien über physiologische Ähnlichkeit VI. Wachstumsähnlichkeiten. Pflugers Arch. Gesamte Physiol. Menschen Tiere 180, 298–340.
Quinn, T. J. II, and Deriso, R. B. (1999). Quantitative Fish Dynamics. New York, NY: Oxford University Press.
R Core Team (2013). R: A Language and Environment for Statistical Computing. Vienna, Austria: R Foundation for Statistical Computing.
Ricker, W. E. (1975). Computation and interpretation of biological statistics of fish populations. J. Fish. Res. Board Can. 191, 1–382.
Ricker, W. E. (1979). Growth Rate and Models. Fish Physiology VIII Series. San Diego, CA: Academic Press, 677–743.
Robertson, T. B. (1923). The Chemical Basis of Growth and Senescence. Philadelphia, PA: J.B. Lippincott, 389.
Roff, D. A. (1980). A motion for the retirement of the von Bertalanffy function. Can. J. Fish. Aquat. Sci. 37, 127–129. doi: 10.1139/f80-016
Rogers-Bennett, L., and Rogers, D. W. (2016). A two-step growth curve: approach to the von Bertalanffy and Gompertz equations. Advan. Pure Mathem. 6, 321–330. doi: 10.4236/apm.2016.65023
Romine, J. G., Grubbs, R. D., and Musick, J. A. (2006). Age and growth of the sandbar shark, Carcharhinus plumbeus, in Hawaiian waters through vertebral analysis. Environ. Biol. Fishes 77, 229–239. doi: 10.1007/978-1-4020-5570-6_3
Romney, P. M., and Campana, S. E. (2009). Bomb dating and age determination of skates (family Rajidae) off the eastern coast of Canada. J. Mar. Sci. 66, 546–560. doi: 10.1093/icesjms/fsp002
Santana, F. M., and Lessa, R. (2004). Age determination and growth of the night shark (Carcharhinus signatus) off the northeastern Brazilian coast. Fish. Bull. 102, 156–167.
Schmid, T. H., and Murru, F. L. (1994). Bioenergetics of the bull shark, Carcharhinus leucas, maintained in captivity. Zool. Biol. 13, 177–185. doi: 10.1002/zoo.1430130209
Schnute, J. T., and Richards, L. J. (1990). A unified approach to the analysis of fish growth, maturity, and survivorship data. Can. J. Fish. Aquat. Sci. 47, 24–40. doi: 10.1139/f90-003
Schwarz, G. (1978). Estimating the dimension of a model. Ann. Stat. 6, 461–464. doi: 10.1214/aos/1176344136
Semba, Y., Nakano, H., and Aoki, I. (2009). Age and growth analysis of the shortfin mako, Isurus oxyrinchus, in the western and central North Pacific Ocean. Environ. Biol. Fishes 84, 377–391. doi: 10.1007/s10641-009-9447-x
Simpfendorfer, C. A., Cdlow, J., McAuley, R., and Unsworth, P. (2000). Age and growth of the whiskery shark, Furgaleus macki, from southwestern Australia. Environ. Biol. Fishes 58, 335–343. doi: 10.1023/a:1007624828001
Simpfendorfer, C. A., McAuley, R. B., Chidlow, J., and Unsworth, P. (2002). Validated age and growth of the dusky shark, Carcharhinus obscurus, from Western Australian waters. Mar. Freshw. Res. 53, 567–573.
Smart, J. J., Chin, A., Tobin, A. J., and Simpfendorfer, C. A. (2016). Multimodel approaches in shark and ray growth studies: strengths, weaknesses and the future. Fish Fish. 17, 955–971. doi: 10.1111/faf.12154
Stevens, J. D., Bonfil, R., Dulvy, N. K., and Walker, P. A. (2000). The effects of fishing on sharks, rays, and chimaeras (chondrichthyans), and the implications for marine ecosystems. ICES J. Mar. Sci. 57, 476–494. doi: 10.1006/jmsc.2000.0724
Sulikowski, J. A., Irvine, S. B., DeValerio, K. C., and Carlson, J. K. (2007). Age, growth and maturity of the roundel skate, Raja texana, from the Gulf of Mexico, USA. Mar. Freshw. Res. 58, 41–53. doi: 10.1071/mf06048
Sulikowski, J. A., Kneebone, J., and Elzey, S. (2005). Age and growth estimates of the thorny skate (Amblyraja radiata) in the western Gulf of Maine. Fish. Bull. 103, 161–168.
Sulikowski, J. A., Morin, M. D., Suk, S. H., and Howell, W. H. (2003). Age and growth estimates of the winter skate (Leucoraja ocellata) in the western Gulf of Maine. Fish. Bull. 101, 405–413.
Thorson, J. T., and Simpfendorfer, C. A. (2009). Gear selectivity and sample size effects on growth curve selection in shark age and growth studies. Fish. Res. 98, 75–84. doi: 10.1016/j.fishres.2009.03.016
Wang, T. M., and Chen, C. T. (1982). Age and growth of smooth dogfish, Mustelus griseus, in northwestern Taiwan waters. J. Fish. Soc. Taiwan 9, 1–12.
Wang, Z., and Zuidhof, M. J. (2004). Estimation of growth parameters using a nonlinear mixed Gompertz model. Poul. Sci. 83, 847–852.
Waring, G. T. (1984). Age, growth, and mortality of the little skate off the northeast coast of the United States. Trans. Amer. Fish. Soc. 113, 314–321. doi: 10.1577/1548-8659(1984)113<314:agamot>2.0.co;2
Winemiller, K. O., and Rose, K. A. (1992). Patterns of life-history diversification in north American fishes: implication for population regulation. Can. J. Fish. Aquat. Sci. 49, 2196–2218. doi: 10.1139/f92-242
Winsor, C. P. (1932). The Gompertz curve as a growth curve. Natl. Acad. Sci. 18, 1–8. doi: 10.1073/pnas.18.1.1
Wintner, S. P., and Cliff, G. (1996). Age and growth determination of the blacktip shark, Carcharhinus limbatus, from the east coast of South Africa. Fish. Bull. 94, 135–144.
Keywords: sharks, skates and rays, von Bertalanffy growth model, Robertson growth model, Gompertz growth model
Citation: Liu K-M, Wu C-B, Joung S-J, Tsai W-P and Su K-Y (2021) Multi-Model Approach on Growth Estimation and Association With Life History Trait for Elasmobranchs. Front. Mar. Sci. 8:591692. doi: 10.3389/fmars.2021.591692
Received: 05 August 2020; Accepted: 27 January 2021;
Published: 23 February 2021.
Edited by:
Morten Omholt Alver, Norwegian University of Science and Technology, NorwayReviewed by:
Maria Cristina Follesa, University of Cagliari, ItalyBryan S. Frazier, South Carolina Department of Natural Resources, United States
Copyright © 2021 Liu, Wu, Joung, Tsai and Su. This is an open-access article distributed under the terms of the Creative Commons Attribution License (CC BY). The use, distribution or reproduction in other forums is permitted, provided the original author(s) and the copyright owner(s) are credited and that the original publication in this journal is cited, in accordance with accepted academic practice. No use, distribution or reproduction is permitted which does not comply with these terms.
*Correspondence: Kwang-Ming Liu, kmliu@mail.ntou.edu.tw