Geographical Variation in Flower Color in the Grassland Daisy Gerbera aurantiaca: Testing for Associations With Pollinators and Abiotic Factors
 Isabel M. Johnson
 Trevor J. Edwards
 Steven D. Johnson
- 1Centre for Functional Biodiversity, School of Life Sciences, University of KwaZulu-Natal, Pietermaritzburg, South Africa
- 2Department of Agriculture and Water Resources, Tullamarine, VIC, Australia
Geographical variation in flower color of a plant species may reflect the outcome of selection by pollinators or may reflect abiotic factors such as soil chemistry or neutral processes such as genetic drift. Here we document striking geographical structure in the color of capitula of the endemic South African grassland daisy Gerbera aurantiaca and ask which of these competing explanations best explains this pattern. The color of capitula ranges from predominantly red in the southwest to yellow in the center, with some northern populations showing within-population polymorphism. Hopliine scarab beetles were the most abundant flower visitors in all populations, apart from a yellow-flowered one where honeybees were frequent. In a mixed color population, yellow, orange and red morphs were equally attractive to hopliine beetles and did not differ significantly in terms of fruit set. Beetles were attracted to both red and yellow pan traps, but preferred the latter even at sites dominated by the red morph. We found no strong associations between morph color and abiotic factors, including soil chemistry. Plants in a common garden retained the capitulum color of the source population, even when grown from seed, suggesting that flower color variation is not a result of phenotypic plasticity. These results show that flower color in G. aurantiaca is geographically structured, but the ultimate evolutionary basis of this color variation remains elusive.
Introduction
Color is one of the most important cues used by pollinators to locate, recognize and discriminate between flowers (Menzel and Shmida, 1993; Schiestl and Johnson, 2013). There is good evidence for differences among pollinator functional groups in their perceptions of colors, their degree of innate attraction to certain colors and their abilities to learn to associate colors with rewards (Chittka and Menzel, 1992; Chittka and Raine, 2006). As a result, deployment of color signals is considered a key part of plant advertising strategies that influence pollination outcomes (Schiestl and Johnson, 2013; Reverté et al., 2016). This is reflected in the broad associations between various animal groups and the colors of flowers they visit (Fenster et al., 2004; Renoult et al., 2014). Some phylogenetic studies have shown that macro-evolutionary transitions in flower color are statistically associated with pollinator shifts (Tripp and Manos, 2008) while others have found no relationship between pollination system and flower color (Smith et al., 2008). The role of selection in generating macro-evolutionary patterns in flower color has been highlighted by experimental studies using hybrid arrays with introgressed flower colors (Bradshaw and Schemske, 2003). These experiments, in which the effects of color and morphological signals on pollinator attraction can be uncoupled, have shown that pollinators frequently discriminate among plants according to flower colors (Bradshaw and Schemske, 2003; Hoballah et al., 2007). Similarly, experiments using arrays of model flowers that vary only in color have shown strong discrimination according to color by flower-visiting animals (Campbell et al., 2010).
Geographical variation in the availability of pollinators with different color preferences would be expected to lead to intraspecific divergence in flower color among plant populations (Stebbins, 1970). For example, the floral color polymorphism in Drosera cistiflora may be accounted for by the spatiotemporal variation in pollinator assemblages which display different color preferences (Johnson et al., 2020). This micro-evolutionary process could account for macro-evolutionary pattern if populations that differ in flower color were to diverge to the point of speciation (Johnson, 2006).
As an alternative to the hypothesis that changes in pollinator composition account for geographical variation in flower color, recent studies have identified geographical variation in color preferences of the same pollinator as a basis of selection (Newman et al., 2012; Whitehead et al., 2018). This can occur when color preferences of a pollinator vary as a result of conditioning due to associations between colors and rewards in local plant communities (Campbell et al., 2010; Whitehead et al., 2018). A much less likely possibility, given the conserved visual systems of insects, is that differences in color preferences among populations of a single insect species could be hard-wired (Raine and Chittka, 2007).
The relative importance of biotic and abiotic drivers of flower color polymorphisms within and between populations are not well understood (Strauss and Whittall, 2006; Dalrymple et al., 2020; Sapir et al., 2021) and there is considerable debate about the extent to which both within and between population flower color polymorphisms represent the outcome of pollinator-mediated selection, as opposed to other mechanisms (Hannan, 1981; Strauss and Whittall, 2006; Rauscher, 2008; Paine et al., 2019; Dafni et al., 2020). Flower color transitions have been attributed to pollinators (Fenster et al., 2004), herbivory (Carlson and Holsinger, 2013), rainfall and sunlight (Schemske and Bierzychudek, 2007; Arista et al., 2013; Vaidya et al., 2018) or neutral processes (Edh et al., 2007; Wang et al., 2016). Plant pigments responsible for flower color, in particular anthocyanins, have a number of functions other than pollinator attraction (Bohm and Stuessy, 2001), and may be associated with abiotic factors such as soil chemistry (Mogford, 1974; Schemske and Bierzychudek, 2007; Koski and Ashman, 2016) drought and heat stress (Strauss and Whittall, 2006; Arista et al., 2013), as well as interactions such as herbivory, seed parasitism and fitness (Coberly and Rauscher, 2008; Carlson and Holsinger, 2013). Flower color may also evolve in response to pollen and nectar robbers that visit flowers and deplete their resources without effecting pollination and fertilization. Red color, for example, may reduce visits by pollen-depleting honeybees (Lunau et al., 2011; Santamaría and Rodríguez-Gironés, 2015). Since plant populations occur in intricate communities and habitats with complex interactions, traits may be the result of several interacting selective factors (Strauss and Whittall, 2006; Carlson and Holsinger, 2013). While flower color polymorphism between populations has been relatively well-researched, within-population variation, which may be either continuous or discrete, has been less well studied (Sapir et al., 2021).
Here we investigated striking patterns of variation in capitulum color among and within populations of the daisy Gerbera aurantiaca and examined biotic and abiotic factors that could be correlated with this variation. Capitula of G. aurantiaca are typically bright red with a dark center, but several recently discovered populations are either entirely yellow-flowered (Johnson et al., 2005) or color polymorphic (ranging from yellow through orange to red). The combination of a red display and black center is typical of a guild of plants attractive to glaphyrid scarab beetles in the Mediterranean region (Dafni et al., 1990; Streinzer et al., 2019) and is also found in some members of various guilds of South African plants which are pollinated solely or primarily by hopliine scarab beetles (Bernhardt, 2000; Goldblatt and Manning, 2011; Johnson et al., 2020). The primary pollinators in red-flowered population of G. aurantiaca are hopliine scarab beetles, but honeybees are frequent visitors in yellow-flowered populations (Johnson et al., 2004; IM Johnson unpublished data). Hopliine scarab beetles use visual cues and are readily attracted to artificial flowers (Picker and Midgley, 1996; Johnson and Midgley, 2001; Van Kleunen et al., 2007), making them excellent experimental subjects for studies of pollinator-mediated selection on flower color.
Here we hypothesized that flower color polymorphism in G. aurantiaca is maintained by natural selection from pollinator preference or from differences in soil or climatic characteristics. We asked the following questions: (1) Does capitulum color variation in G. aurantiaca show a geographic distribution pattern? (2) Is morph color associated with abiotic factors? (3) What are the color preferences of the main pollinators? and (4) Do pollinators display a preference for color morphs in polymorphic populations of G. aurantiaca?
Materials and Methods
Study Species and Sites
Gerbera aurantiaca Sch.Bip. (Asteraceae: Mutisieae) is a long-lived perennial herb endemic to the mistbelt grasslands of KwaZulu-Natal and Mpumalanga in eastern South Africa (Johnson et al., 2005). The species is known from approximately 25 scattered, isolated populations ranging in size from a few to hundreds of clones, and is listed as endangered due to habitat transformation resulting from commercial forestry, agriculture and urban development (Raimondo et al., 2009). The populations occur in grasslands scattered along a roughly north-south axis between –26° and –30° S latitude along the eastern region of SA at elevations of between 900 and 1,700 m (Figure 1). G. aurantiaca populations are found on or near rocky outcrops in organic–rich topsoil overlying well-drained, acidic, nutrient-deficient sub-soils associated with a high degree of leaching typical of the high rainfall and cool temperatures of mistbelt grasslands (Fey, 2010).
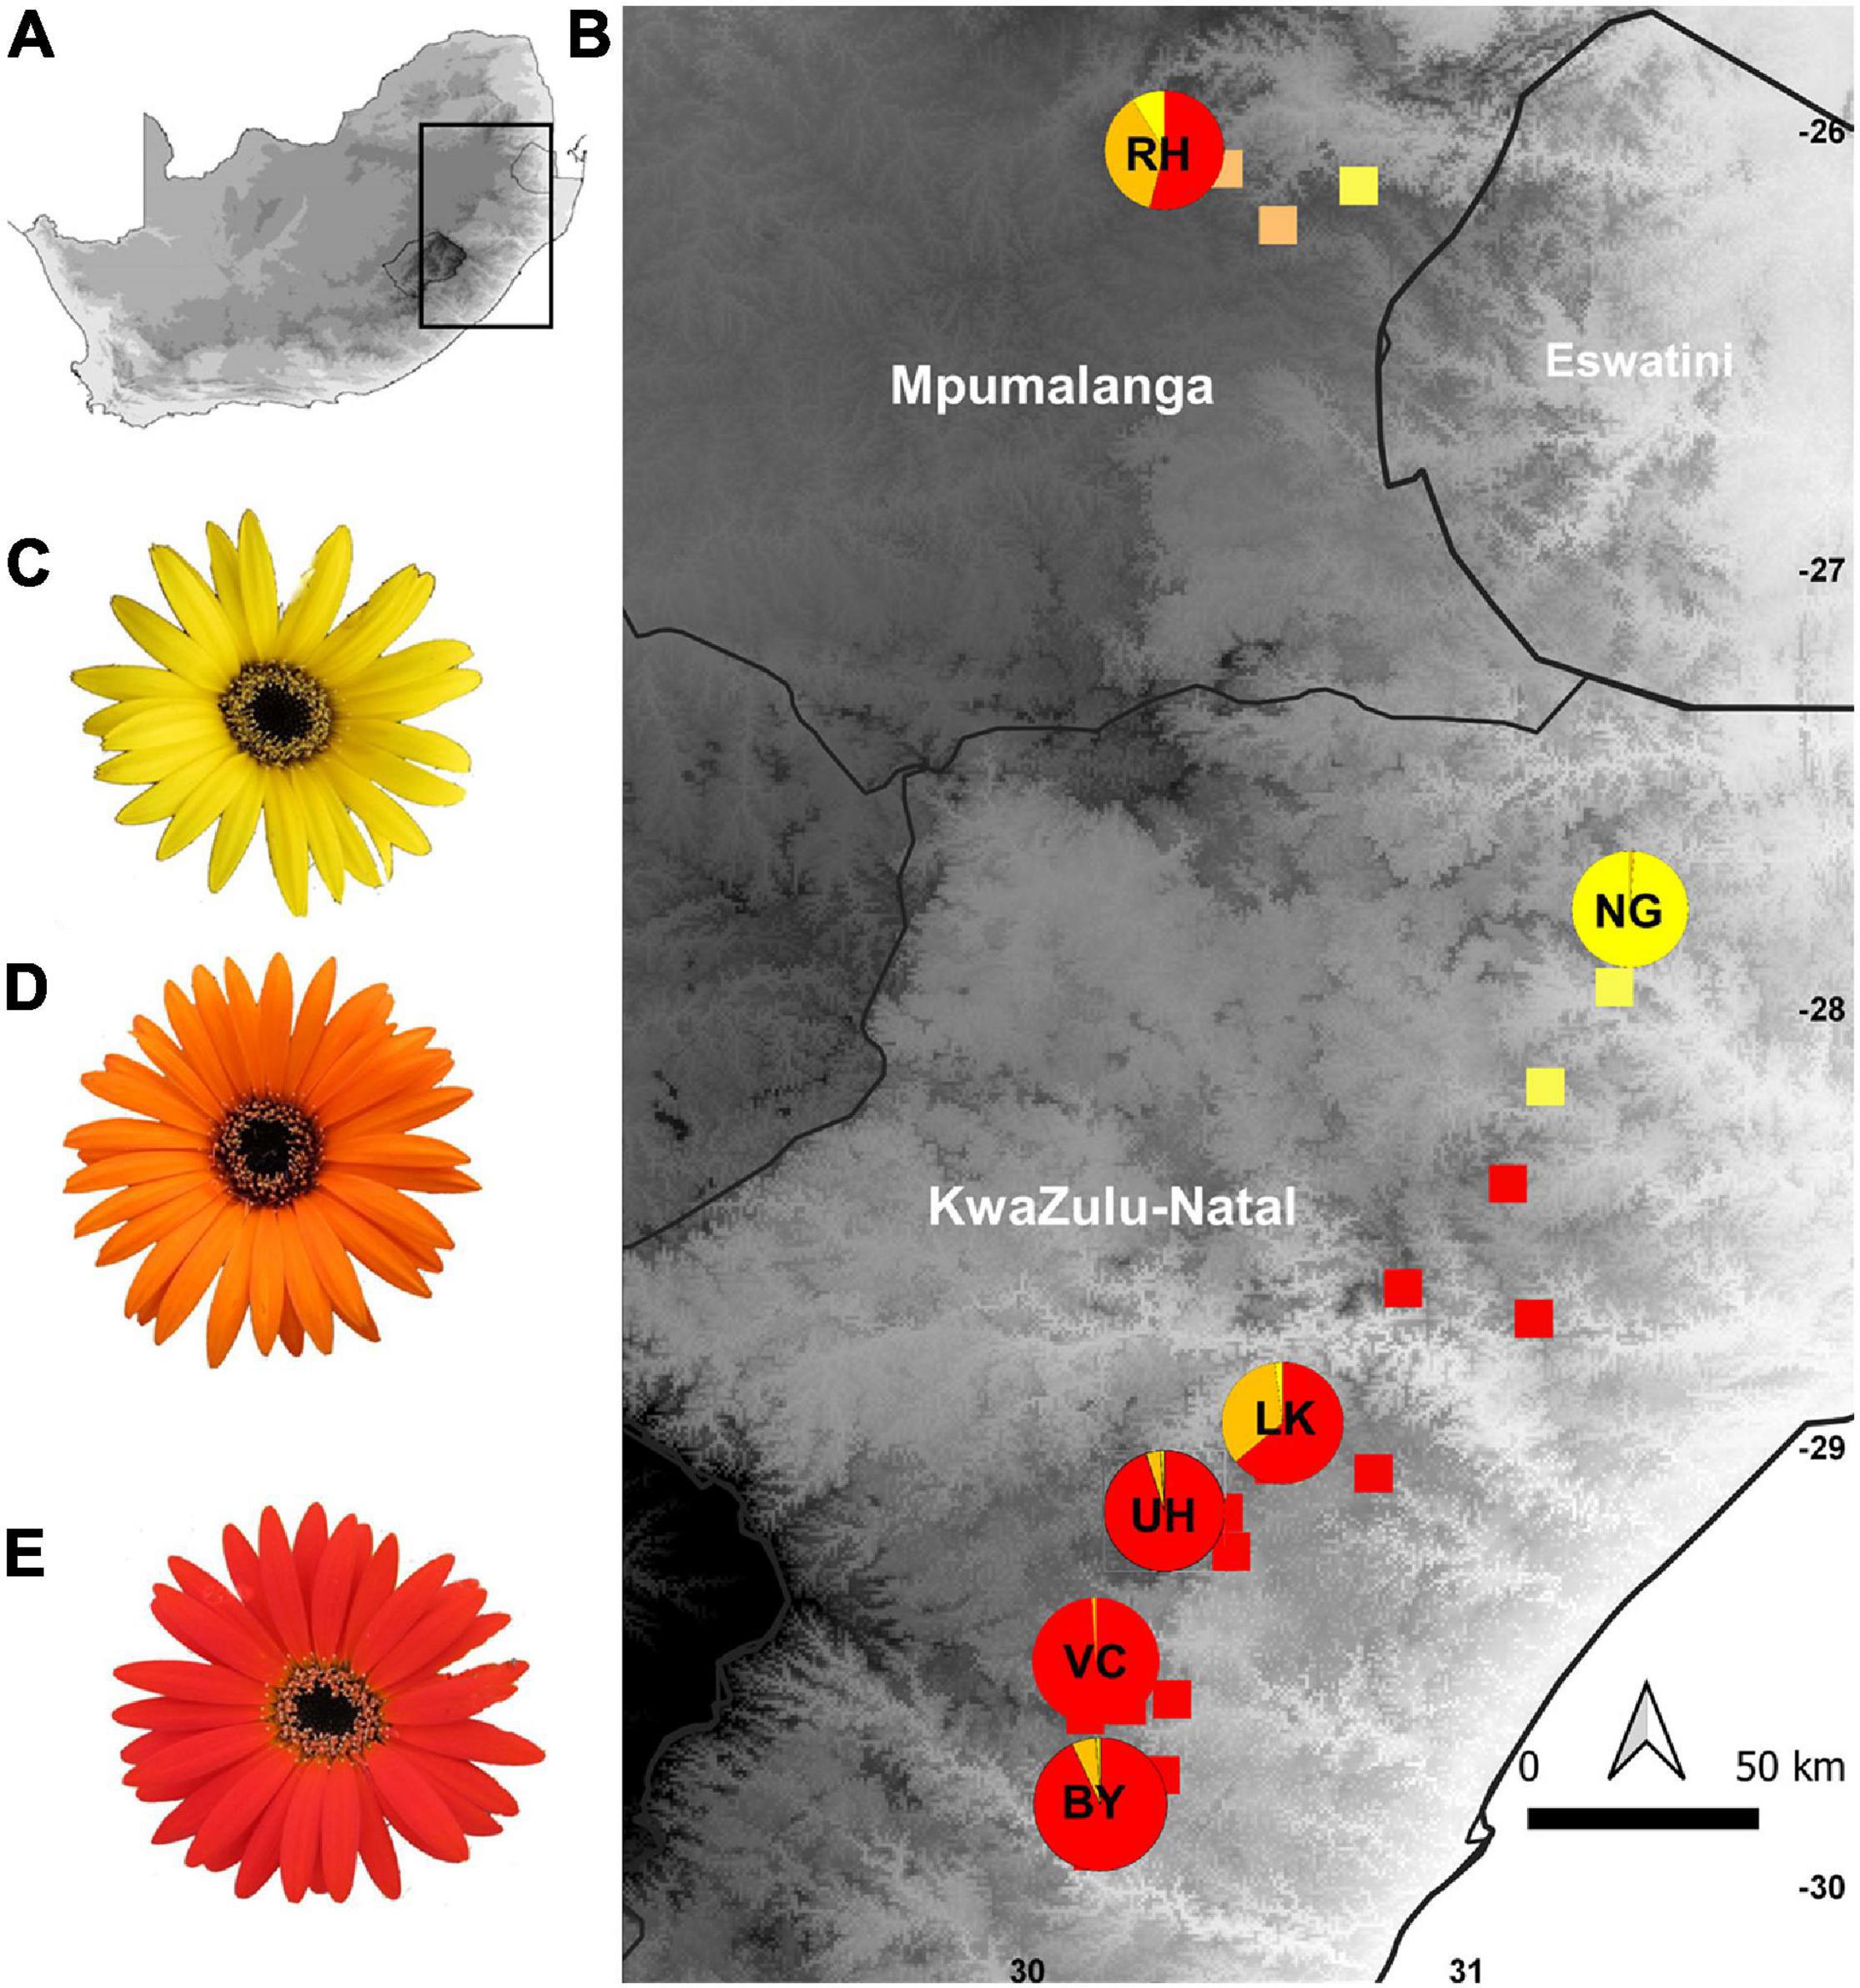
Figure 1. Map showing the geographic distribution of capitulum color morphs in populations of Gerbera aurantiaca along its latitudinal range. (A) Map of South Africa; (B) color forms of G. aurantiaca in eastern South Africa; (C) G. aurantiaca yellow capitulum; (D) G. aurantiaca orange capitulum; (E) G. aurantiaca red capitulum. BY, VC, UH, LK, NG, and RH are the six study populations selected and the pie charts indicate the capitulum color proportions of these populations.
Reproduction of G. aurantiaca is both clonal, by means of underground stems, and sexual with flowering taking place in austral spring (September to November). The radiate capitula contain about 200 florets, with approximately 100 female ray florets in three outer whorls, and with the central disc florets hermaphrodite but functionally male. Capitula are not nyctinastic and remain open throughout flowering. The species is largely self-incompatible and highly dependent on pollinators for fruit set (Johnson et al., 2004). Populations are typically predominantly red-flowered, but both completely yellow-flowered and color polymorphic populations with yellow, orange and red-flowered inflorescences also occur (Johnson et al., 2005). The chemical basis of capitulum coloration of G. aurantiaca has not been analyzed as far as we know but the flower color of G. jamesonii a sister species, and the related commercially important ornamental Gerbera hybrids, is derived from carotenoids which cause yellow and orange coloration, and the flavonoids, pelargonidin and cyanidin, which are responsible for the red coloration (Valadon and Mummery, 1967; Tyrach and Horn, 1997). A feature of G. aurantiaca capitula is the dark center during the initial female stages of flowering when the disc florets are covered by the overarching dark purple pappus hairs and dark anther caps. Pollen is the primary floral reward as the florets produce little or no nectar and have no discernible scent.
The hairy monkey beetle Eriesthis vulpina Burmeister (Coleoptera: Scarabaeidae: Hopliini), appears to be the most important pollinator of G. aurantiaca (Johnson et al., 2004). Its use of color as a cue for locating flowers was evidenced by experiments in which large numbers of these beetles were captured in red plastic dishes placed in populations (Johnson et al., 2004). Eriesthis beetles almost completely ignored blue plastic dishes placed alongside red dishes in these populations (c. 100 beetles attracted to red dishes vs. one beetle attracted to blue dishes; SD Johnson, unpublished data), suggesting that they strongly prefer red over blue colors. The honeybee, Apis mellifera scutellata Lepeletier (Hymenoptera: Apidae) is also a common visitor in the yellow-flowered population.
Geographical Distribution of Color Morphs
We recorded the proportions of capitulum color morphs (as apparent in human vision) along transects across each of 23 populations ranging from southern KwaZulu-Natal to Mpumalanga (Figure 1 and Supplementary Table 1). At least one hundred clones were counted in larger populations and all clones were counted in the smaller populations. To minimize subjective bias in color allocation, one person (IMJ) carried out all counts. Ray floret samples were matched to a flower color chart (RHS, 2007) and broadly assigned to orange, red or yellow. Geographic position (south latitude and east longitude, WGS 84) and elevation (m.a.s.l) were measured using a handheld Garmin Etrex GPS. A generalized linear model (GLM) with a binomial error distribution, logit link function, and correction for overdispersion was applied to model the proportion of clones with red capitula in each population against latitude, longitude and elevation and we used likelihood ratios to test significance of fixed effects. All GLMs in this study were implemented in SPSS ver. 27 (IBM corp.).
Spectral Reflectance and Floral Morphological Trait Measurements
We selected six populations representative of the color variation across the distribution range (Figure 1) to investigate pollinator color preferences; of these three (BY, VC and UH) were predominantly red-flowered, one (NG) almost entirely yellow-flowered and two (RH and LK) polymorphic with a mixture of red, orange and yellow-flowered plants (Table 1). Here we measured spectral reflectance (300–700 nm) of the ray florets using an Ocean Optics S2,000 spectrometer (Ocean Optics Inc., Dunedin, Fla.), Ocean Optics DT-mini deuterium tungsten halogen light source and fibre optic reflection probe (QR-400-7-UVVIS; 400 lm) held at 45° to the object surface in a probe holder (RPH-1). An Ocean Optics WS-1 diffuse reflectance standard was used to calibrate the spectrometer (Johnson and Andersson, 2002). Spectral reflectance readings were averaged from the mid-adaxial surface of three ray florets from at least 20 different plants from each population. All spectral reflectance curves are available from the Floral Reflectance Database (Arnold et al., 2010). Since we were interested in color as a floral signal and insect flower visitors most readily perceive rapid changes in spectral reflectance (Chittka and Menzel, 1992; Dyer et al., 2012) we used inflection or marker points which identify the wavelengths where change in spectral reflectance is maximal. We used the online Spectral MP (Dorin et al., 2020) to class capitulum color as yellow (inflection points from 520 to 530 nm), orange (inflection points from 530 to 600 nm) or red (inflection points from 600 to 625 nm). We recorded the positions of the different color morphs in the polymorphic RH population with a handheld Garmin Etrex GPS to investigate spatial structuring.
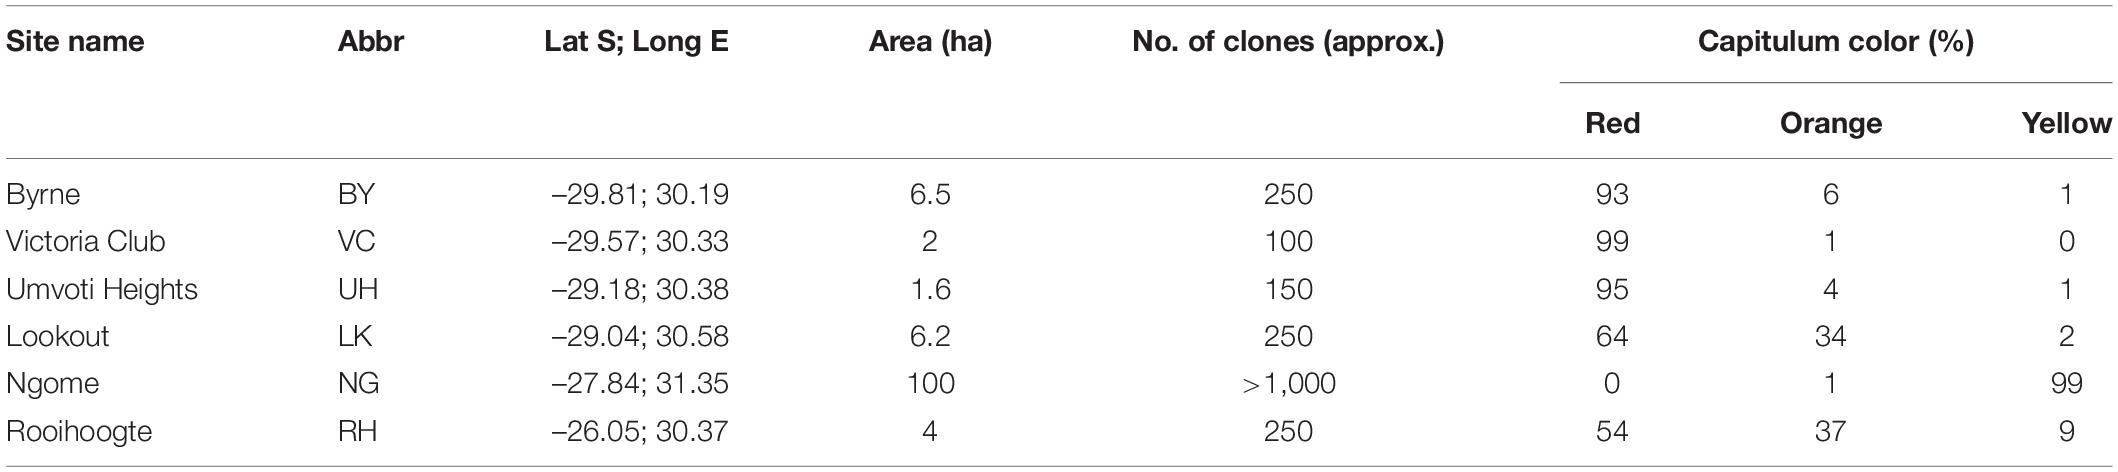
Table 1. Site name, abbreviation (abbr.), geographical co-ordinates (dd), area (ha), approximate number of clones and percentage of clones with red orange and yellow capitula at the six Gerbera aurantiaca study sites.
To test whether other floral traits that might influence pollinator attraction were associated with ray floret color we measured the capitulum diameter and ray floret length and ray floret inflection points for inflorescences from 50 clones collected randomly in the polymorphic RH population and tested for trait correlations using Pearson tests. We used finite mixture analysis allowing for unequal variance and with BIC criteria implemented in the r package mclust 5.4.6 (Scrucca et al., 2016) to assess whether the distribution of inflection points in populations were best explained by a single Gaussian distribution or by two or more Gaussian distributions. Both equal variance and unequal variance models were tested. We also tested for significant deviations from unimodality of inflection points in each population using Hartigan’s diptest implemented in the r package diptest (Maechler, 2016).
The Influence of Abiotic Factors
We sourced the bioclimatic variables temperature (MAT: mean annual temperature °C) and precipitation (MAP: mean annual precipitation mm.) from www.worldclim.org/bioclim (Hijmans et al., 2005) for 23 populations across the distribution range of G. aurantiaca (Supplementary Table 1). A generalized linear model (GLM) with a binomial error distribution, logit link function, and correction for overdispersion was applied to model the proportion of clones with red capitula in each population against temperature and precipitation.
Since flower color in polymorphic species may be associated with differences in edaphic factors (soil characteristics) (Horovitz, 1976; Rajakaruna and Bohm, 1999) we collected soil samples from 14 population locations of G. aurantiaca. For each population 15 augered subsamples of the top 15 cm layer taken randomly across the population patch were combined, air dried, stored at room temperature and analyzed for pH (KCL), exchange acidity, total cations, acid saturation, organic carbon (C), calcium (Ca), copper (Cu), potassium (K), magnesium (Mg), manganese (Mn), nitrogen (N2), phosphorus (P), zinc (Zn), and clay content (Supplementary Table 2) by the Soil Fertility and Analytical Services Laboratory, KwaZulu-Natal Dept. of Agriculture (Manson and Roberts, 2000). We used Principal Components Analysis (Braak and Smilauer, 2002) to assess the relationship between the 14 edaphic variables (standardized to avoid using different scales for comparative purposes). Population scores were plotted onto the principal components axes and correlation vectors were used to examine relationships between the population samples and the first two PCA axes of the soil ordination. Linear regression was carried out using the first four regression factor scores and the proportion of red clones in the 14 populations.
Common Garden Experiment
To test whether the capitulum color of G. aurantiaca plants from different color morph populations changes when they are grown together under identical climatic and edaphic conditions, we cultivated both ramets and seeds collected from red and yellow flowered populations in a common garden at the KwaZulu-Natal National Botanical Garden in Pietermaritzburg where conditions (soil characteristics, temperature and precipitation) were identical. We did not include orange morphs since we were not aware of their extent in the polymorphic populations at the start of this experiment. Sample sizes were limited due to permit restrictions relating to the threatened status of the species. We collected flowering ramets from each of five widely spaced clones growing in red (BY) and yellow (NG) source populations and transplanted these into the common garden nursery bed. Ramets were used as they provided a baseline spectral reflectance and because they take less time to flower in cultivation than seed raised plants. In addition, seeds were collected from clones at least five meters apart in the red-flowered LM and the yellow-flowered NG populations and marked seedlings from each population were transplanted randomly into the common garden nursery bed. Reflectance spectra of ray florets from each individual were measured at collection (in the case of ramets) and at intervals once flowering had occurred for both groups over a 5 year period, We compared mean inflection points of the spectral reflectance curves (Dorin et al., 2020) of ray florets for both ramets and seed grown plants using a GLM with normal distribution with source population and year as independent variables.
Color Choice Behavior of Insect Visitors
Pan traps have been widely used for passive sampling of flower-visiting insects and may give an indication of their color preferences as well as their abundance (Picker and Midgley, 1996; Leong and Thorp, 1999; Shrestha et al., 2019). Here we tested color discrimination of potential pollinators using colored pan trap arrays at the six study populations. Red and yellow traps were chosen as they represent the extremes of capitulum colors that occur naturally in the range of G. aurantiaca. We did not test for orange due the unavailability of traps with suitable reflectance spectra. Spectral reflection curves were used to calculate the inflection points (Dorin et al., 2020) of the traps and compare these to those of G. aurantiaca capitula. We used twenty sets of red and yellow plastic traps (11 cm in diameter and 8.5 cm deep) filled with 150 ml of water and placed randomly in pairs 15 cm apart amongst flowering G. aurantiaca plants. We carried out these experiments during peak flowering on sunny days between 07:00 and 16:00 h in late October when insects were most active. Captured insects were identified at least to family level and counted. Beetles appeared to be unaffected by being trapped and most were released after recording on account of their role as important pollinators of this threatened study species. Pan trap catches of the dominant insect visitors, E. vulpina beetles and honeybees, were analyzed using a GLM with negative binomial distribution and log link with trap color and population site as independent variables. For the analysis of catches, one value at sites where no insects were caught in traps had to be adjusted from a choice for yellow to one for red in order for the model to converge (Zuur et al., 2009).
Since hymenopteran vision is well-researched we used the bee color hexagon (Chittka and Menzel, 1992; Peitsch et al., 1992) to assess how honeybees would perceive the color of capitula of G. aurantiaca and the pan traps. The mean reflectance spectrum calculated from three ray florets from each of 20 individuals of each color form and those from the red and yellow pan traps was plotted in the bee color hexagon. Background color was calculated from the spectra of G. aurantiaca leaves. Coleopteran vision has been less well studied and due to this we did not assess their perception of capitulum color.
Capitulum Visitation and Fruit Set in the Color Polymorphic Population
To determine if E. vulpina hopliine scarab beetles, the dominant insect visitors to G. aurantiaca, exhibit color preferences in a polymorphic population, we recorded the frequency of these beetles visiting capitula of different color morphs at the RH population along three 200 m transects during peak flowering in three separate years. As the intensity of flowering varied from year to year, we recorded different total inflorescence numbers per transect (2008 N = 155, 2011 N = 471, 2013 N = 291). The proportion of capitula of different colors (yellow, orange, and red) that were occupied by beetles was compared using a logistic GLM with binomial distribution and logit link function.
We measured fecundity (mean fruit set per capitulum) in relation to morph color in the polymorphic RH population. In 2011 (N = 61: yellow = 19, orange = 28, red = 24), and 2013 (N = 56: yellow = 9, orange = 13, red = 34) capitula were bagged and labeled at the end of the male phase and harvested after 3 weeks. Filled fruit, easily distinguished by their larger size, darker color and firmness were counted for each bagged capitulum. Fruit set per capitulum for each year was analyzed using a GLM with a negative binomial distribution and log link function. Color morph, year and the interaction of color morph and year were fixed factors in this model.
Results
Geographical Distribution of Color Morphs
In human color vision 15 of the 23 G. aurantiaca populations measured had predominantly red-flowered clones, 5 were predominantly yellow-flowered and 3 were polymorphic with mixed yellow, orange and red-flowered clones. The red flowered populations occur mainly in the southern part of the distribution range with one polymorphic population (LK), the yellow cluster in the center, and northern populations are mainly color polymorphic with varying proportions of red, orange and yellow capitula (Figure 1 and Supplementary Table 1). The proportion of clones with red capitula in the 23 populations was significantly correlated with latitude (χ2 = 9.460, df = 22, P = 0.002), and longitude (χ2 = 6.791, df = 22, P = 0.009) but not with elevation (χ2 = 1.805, df = 22, P = 0.179).
Spectral Reflectance and Floral Morphological Trait Measurements
Mean inflection points of the reflectance spectra of the six representative populations were between 609 and 615 nm for the red-flowered populations (BY 615 nm, VC 611 nm, UH 609 nm, LK 600 nm) populations, 524 nm for the yellow-flowered NG population and 597 nm for the polymorphic RH population (Figures 2A–F and Supplementary Table 2). No UV reflectance (300–400 nm) was recorded (Figure 2). Although the northern color polymorphic RH and central LK populations showed a wide range of color variation we were able to assign plants to particular color classes as the distribution of inflection points in this population was broad (Figures 2D,F), with most inflection points clustered around 620 nm with a smaller peak around 540 nm for RH and 600–620 with a smaller cluster at 530–570 nm for LK. The frequency of inflection points in the NG, BY, VC and UH populations fitted a single Gaussian distribution better than two (ΔBIC range = 2.24–7.80), but the distribution of inflection points fitted two Gaussian distributions much better than one Gaussian distribution in the RH population (ΔBIC = 39.8) and LK population (ΔBIC = 23.5). Fits to three or more Gaussian distributions were not supported for any population, but in the RH and LK populations, models with fits to three Gaussian distributions fitted better than models with fits to a single distribution (ΔBIC = 16.4–33.6) but were still supported less than were models fitted to two Gaussian distributions (ΔBIC = 6.2–7.1). However, we found no significant deviations from unimodality for the distributions of inflection points in any of the populations (P > 0.095). We also found no significant correlations between inflection points and capitulum diameter (r = –0.15, P = 0.289) or ray length (r = –0.029, P = 0.845) (Supplementary Table 3).
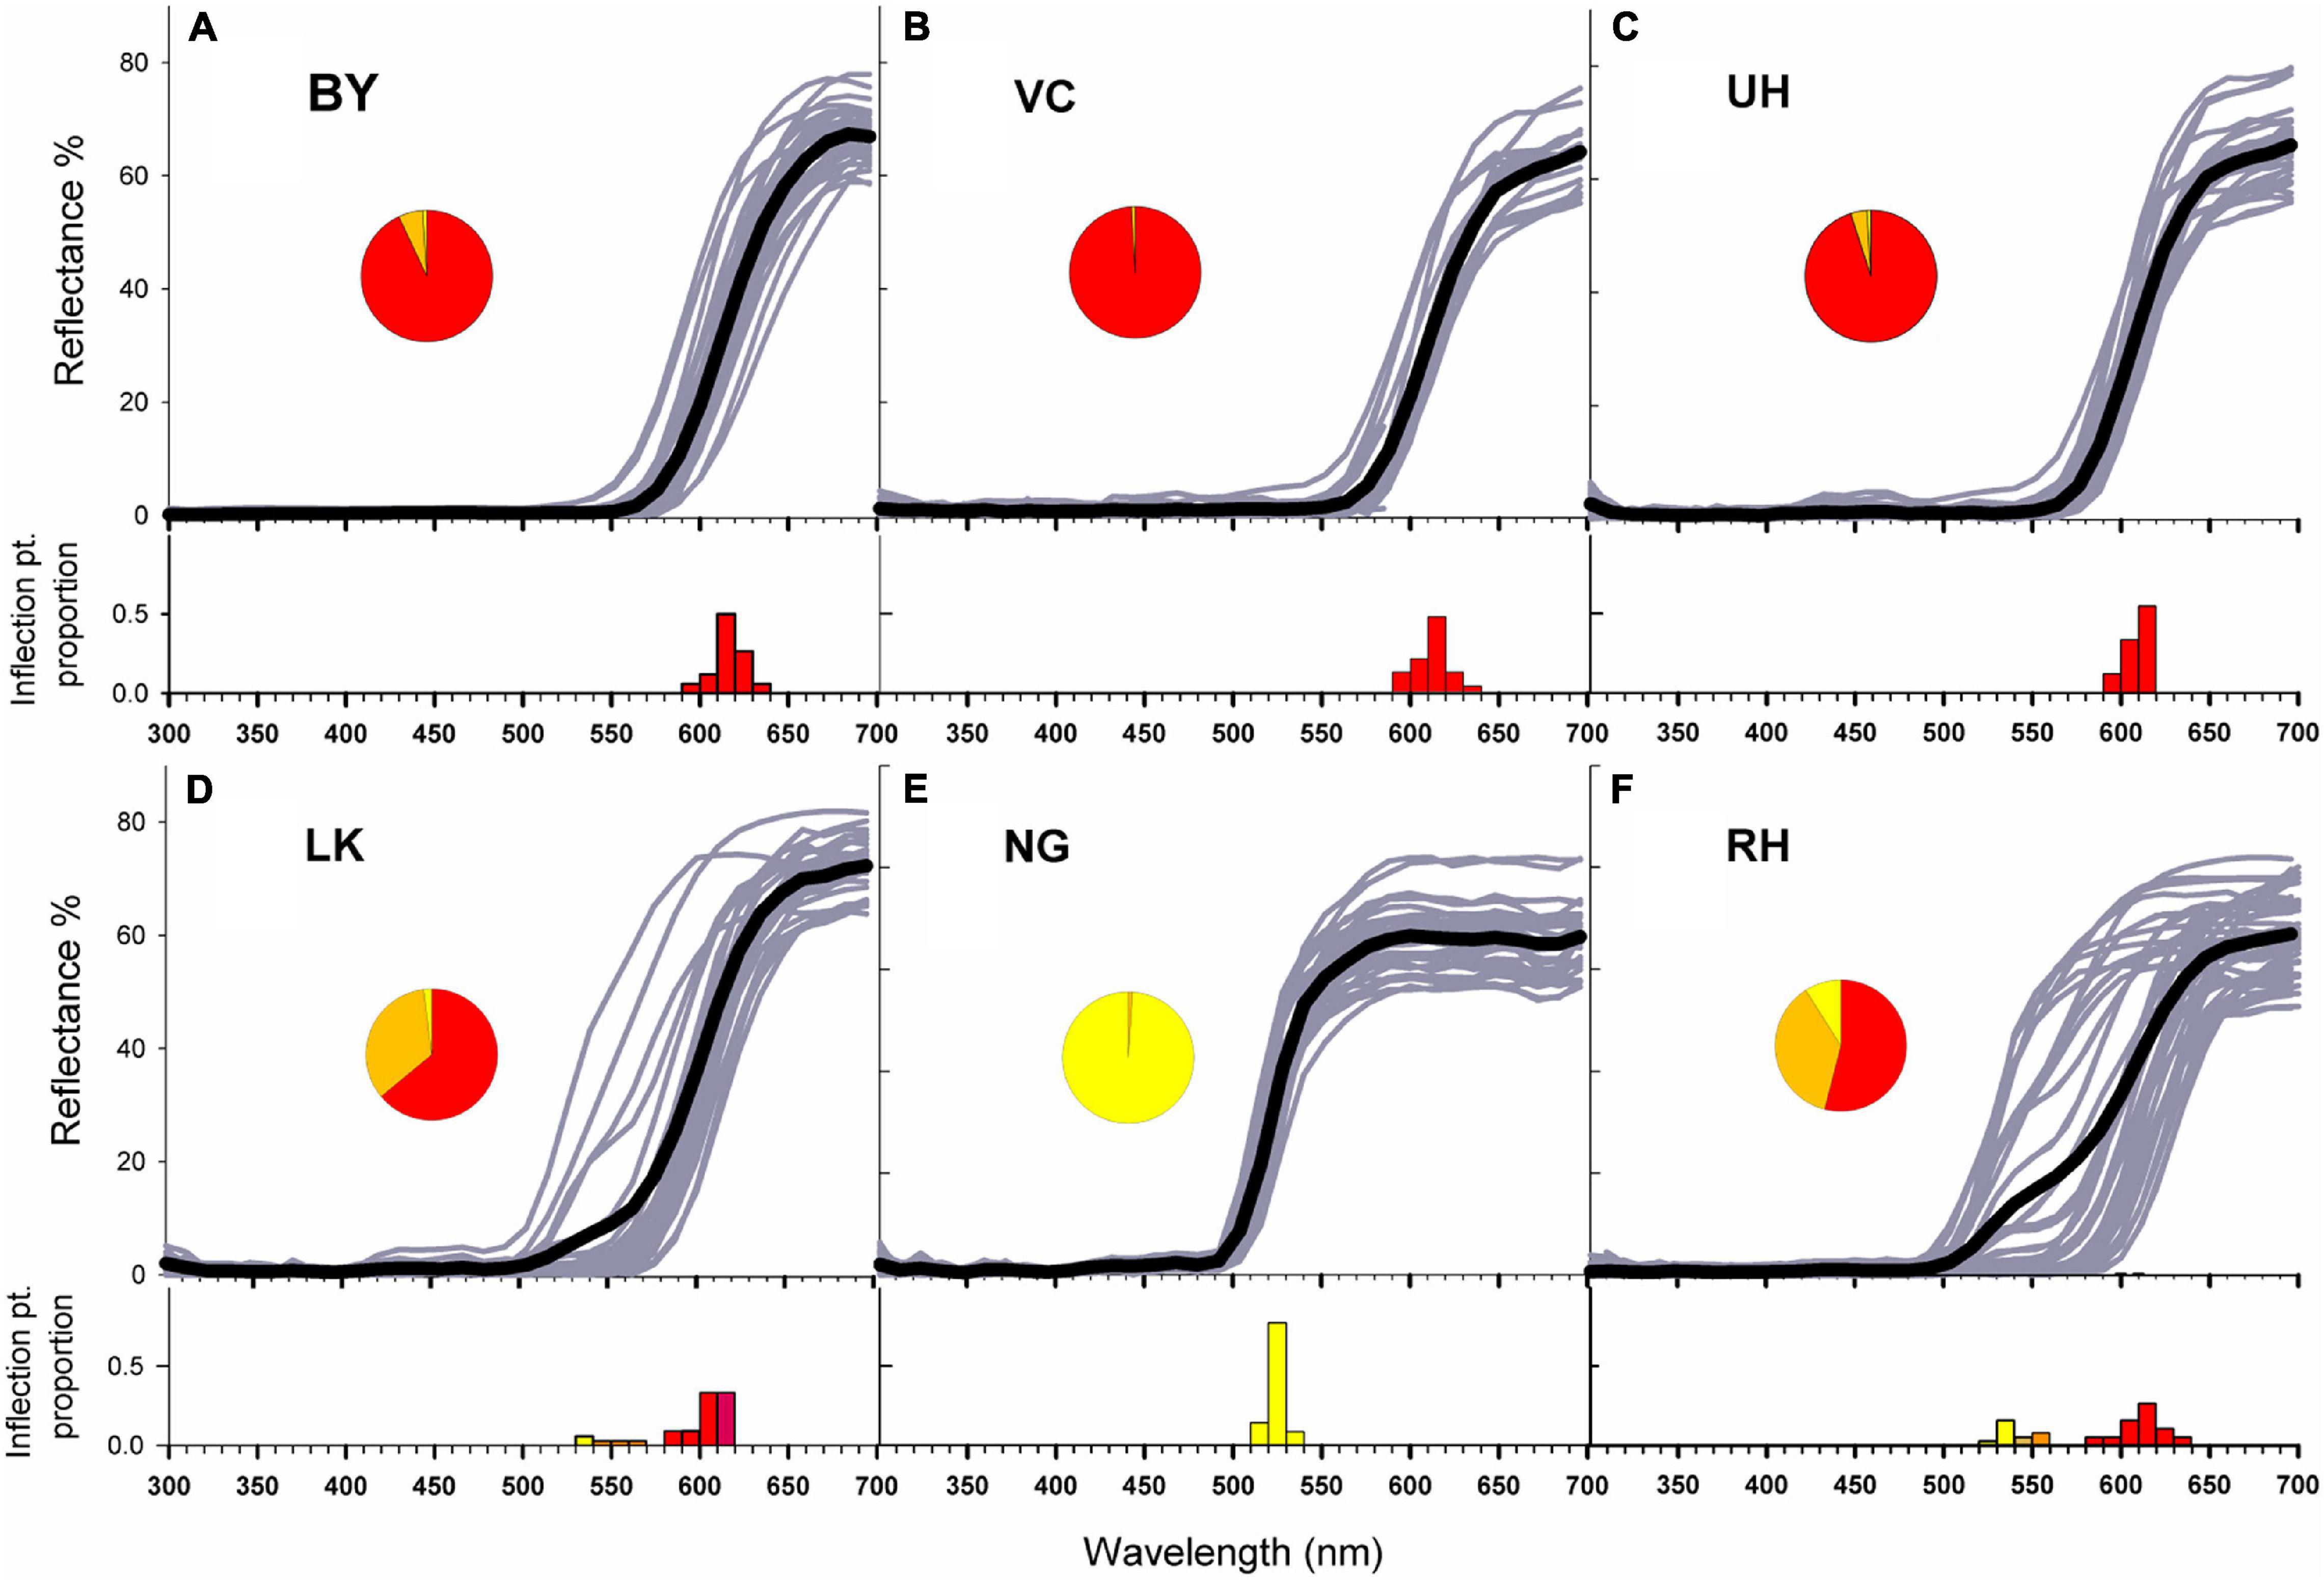
Figure 2. Reflectance spectra between wavelengths of 300 and 700 nm and proportion of inflection points in each 10 nm bin for Gerbera aurantiaca ray florets from the six study populations (A–F). Darker lines indicate population means. Pie charts show the proportions of yellow, orange and red capitula in each population.
The Influence of Abiotic Factors
Environmental conditions were similar across the distribution range of G. aurantiaca with climatic variables for the 23 population localities ranging from 14.0 to 17.6°C for mean annual temperature (MAT), 878-1057 mm for mean annual precipitation (MAP) (Supplementary Table 1). The proportion of clones with red capitula in populations was not significantly correlated with temperature (χ2 = 0.662, df = 22, P = 0.416) or precipitation (χ2 = 2.702, df = 22, P = 0.1).
Differences in soil chemistry between sites were small (pH ranged from 3.94 to 4.69, N from 0.12 to 0.6% and organic C content 2.5–6%) (Supplementary Table 4). Principal components of the edaphic variables were summarized into the first and second axes of the principal component analysis (PCA), which accounted for 64.9% of the total variation and were mainly explained by pH-acidity gradient (axis 1) and Org C/N gradient (axis 2) (Supplementary Figure 1 and Supplementary Table 5). The PCA biplot (Figure 3) shows an apparent pH-acidity gradient, and the two northernmost sites on the top left stand out because of their more weathered soils with higher Mg and lower than average organic carbon content. pH and Organic C can be used as largely independent surrogate variables to represent variation of other associated variables along these two typical soil chemistry gradients. We found no significant relationship between the proportion of red clones in a population and PCA Factor 1 (r2 = 0.037, P = 0.512), Factor 2 (r2 = 0.24, P = 0.596), Factor 3 (r2 = 0.008, P = 0.977) or Factor 4 (r2 = 0.05, P = 0.441) using linear regression. We further observed no spatial structure in the polymorphic RH population with different color morphs scattered randomly (Figure 4A) and often growing less than one meter from each other (Figure 4E).
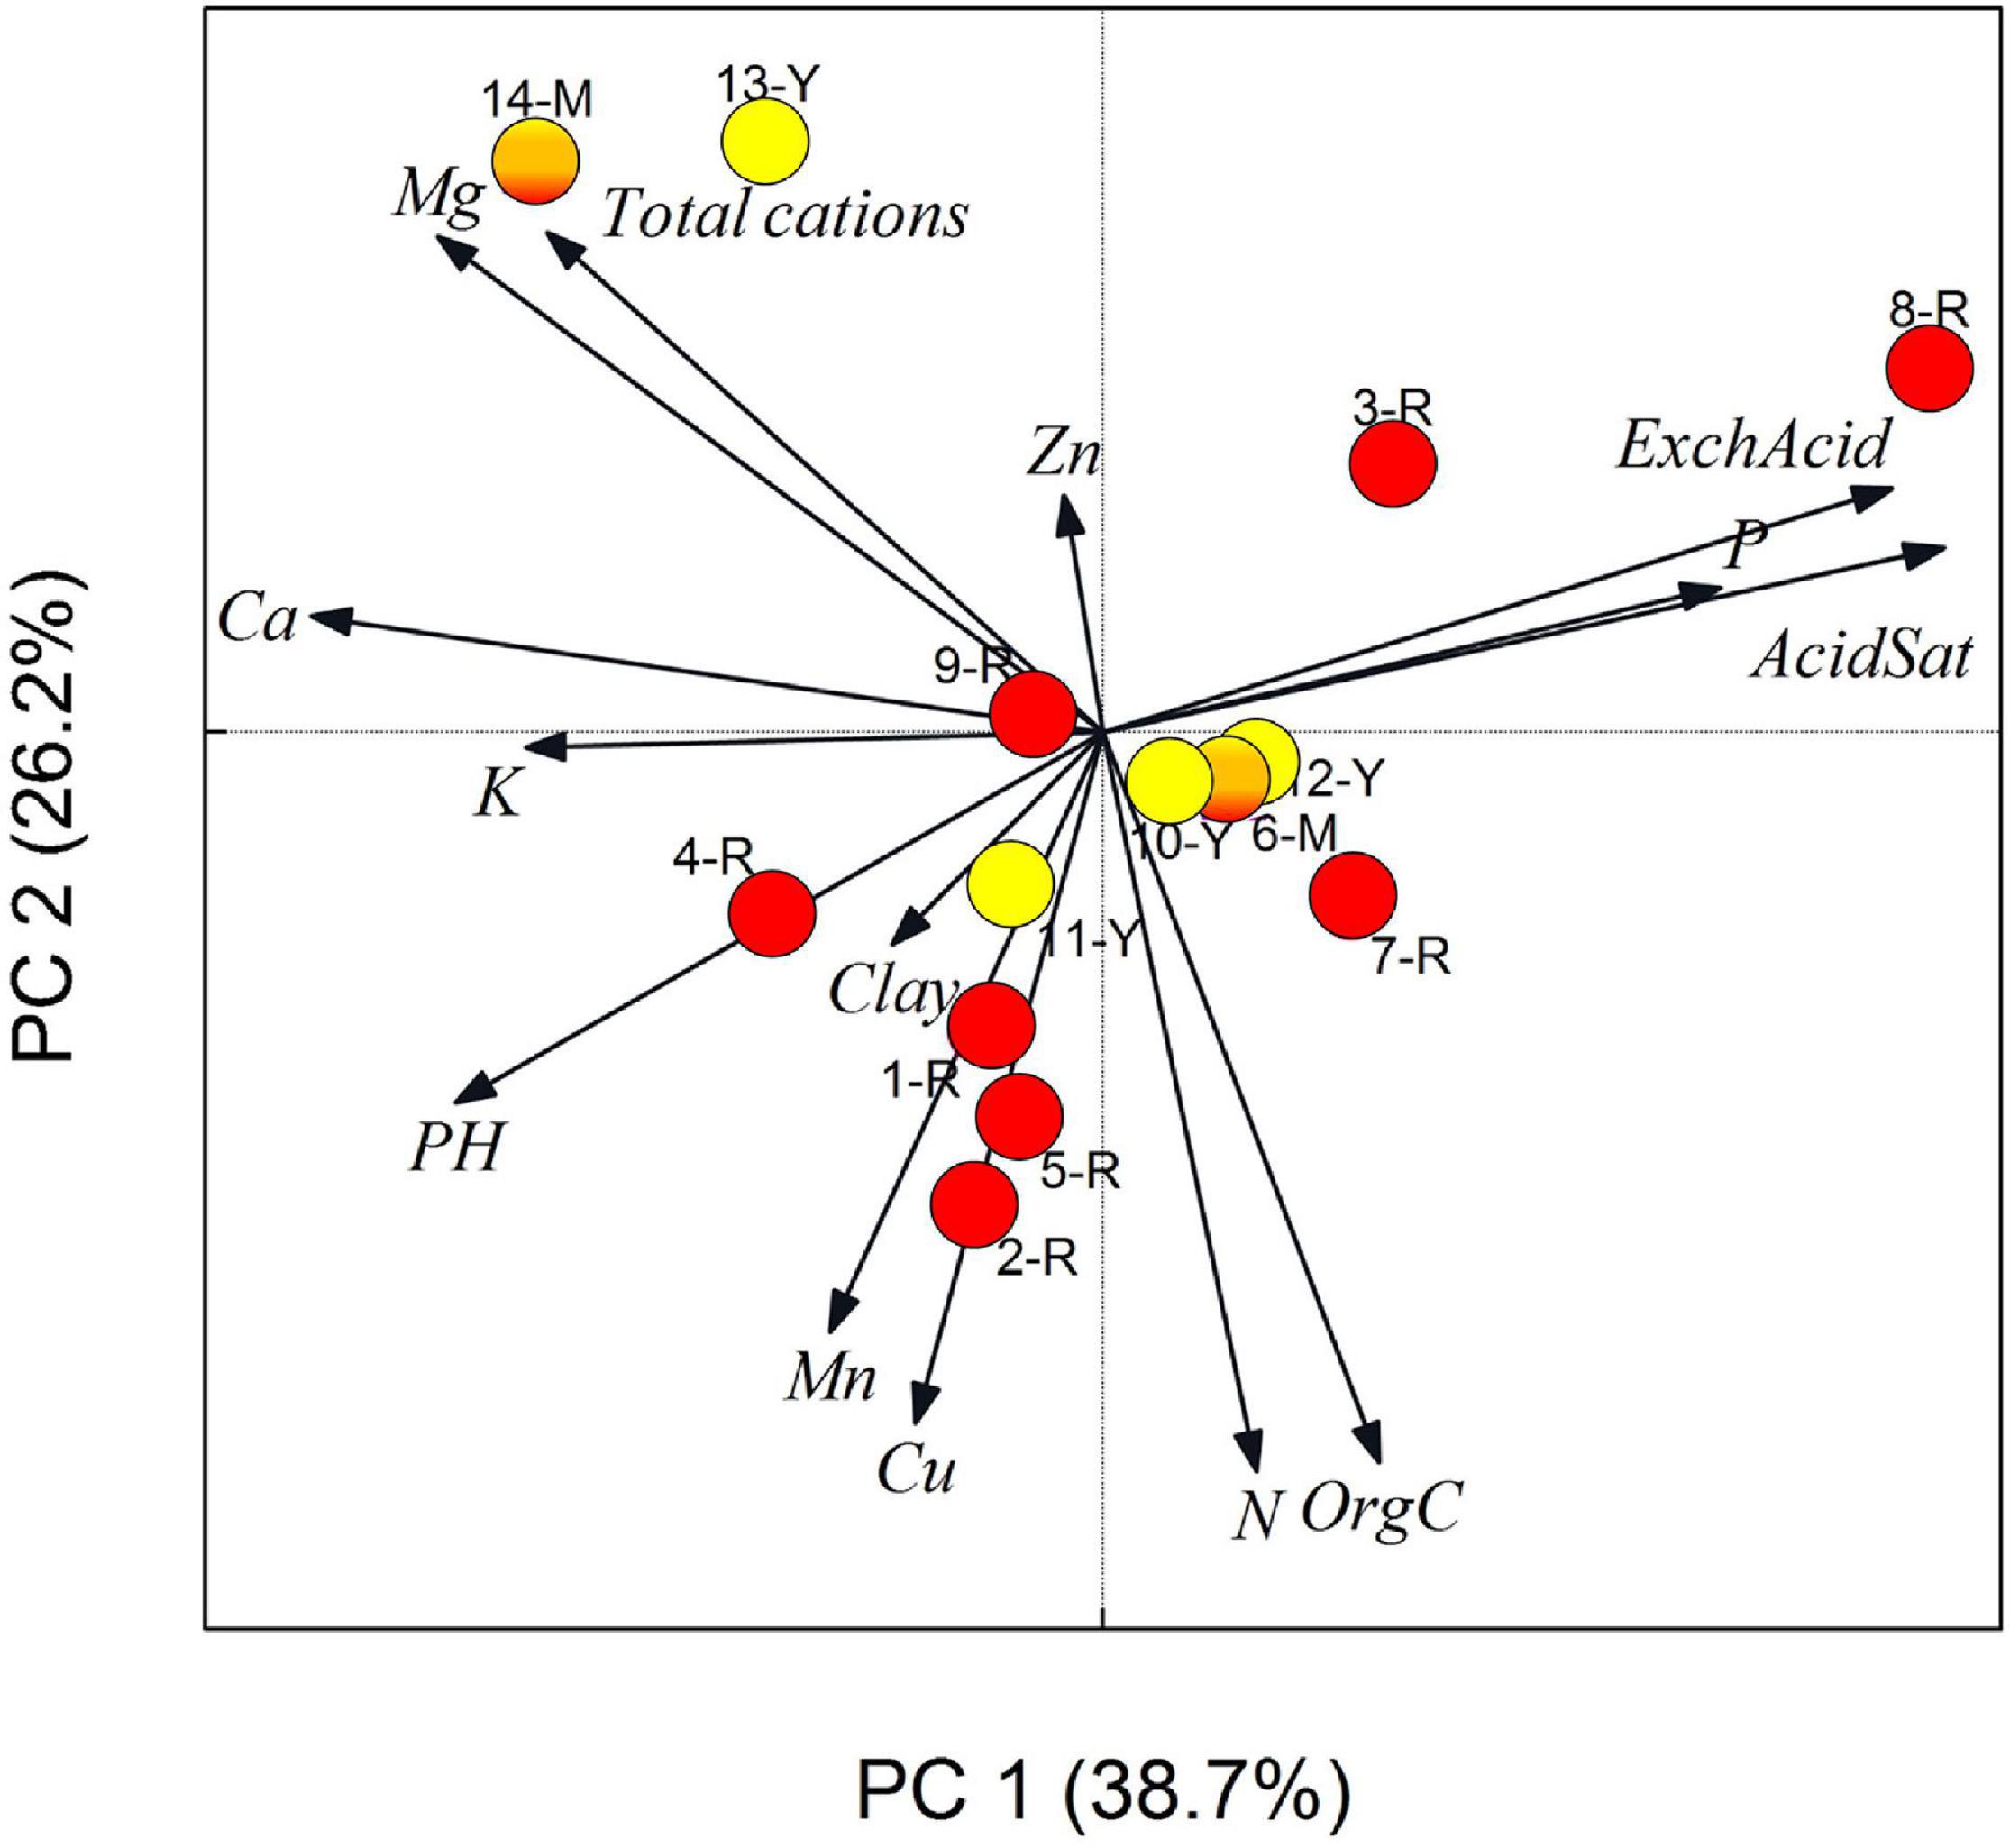
Figure 3. Principal Components Analysis biplot with vectors overlaid showing relationships of Gerbera aurantiaca populations and soil chemical variation across 14 sampling sites. Dominant capitulum color (red, mixed and yellow) of the populations are indicated by the circles (population codes and details of chemical analyses are listed in Supporting information Supplementary Table 4).
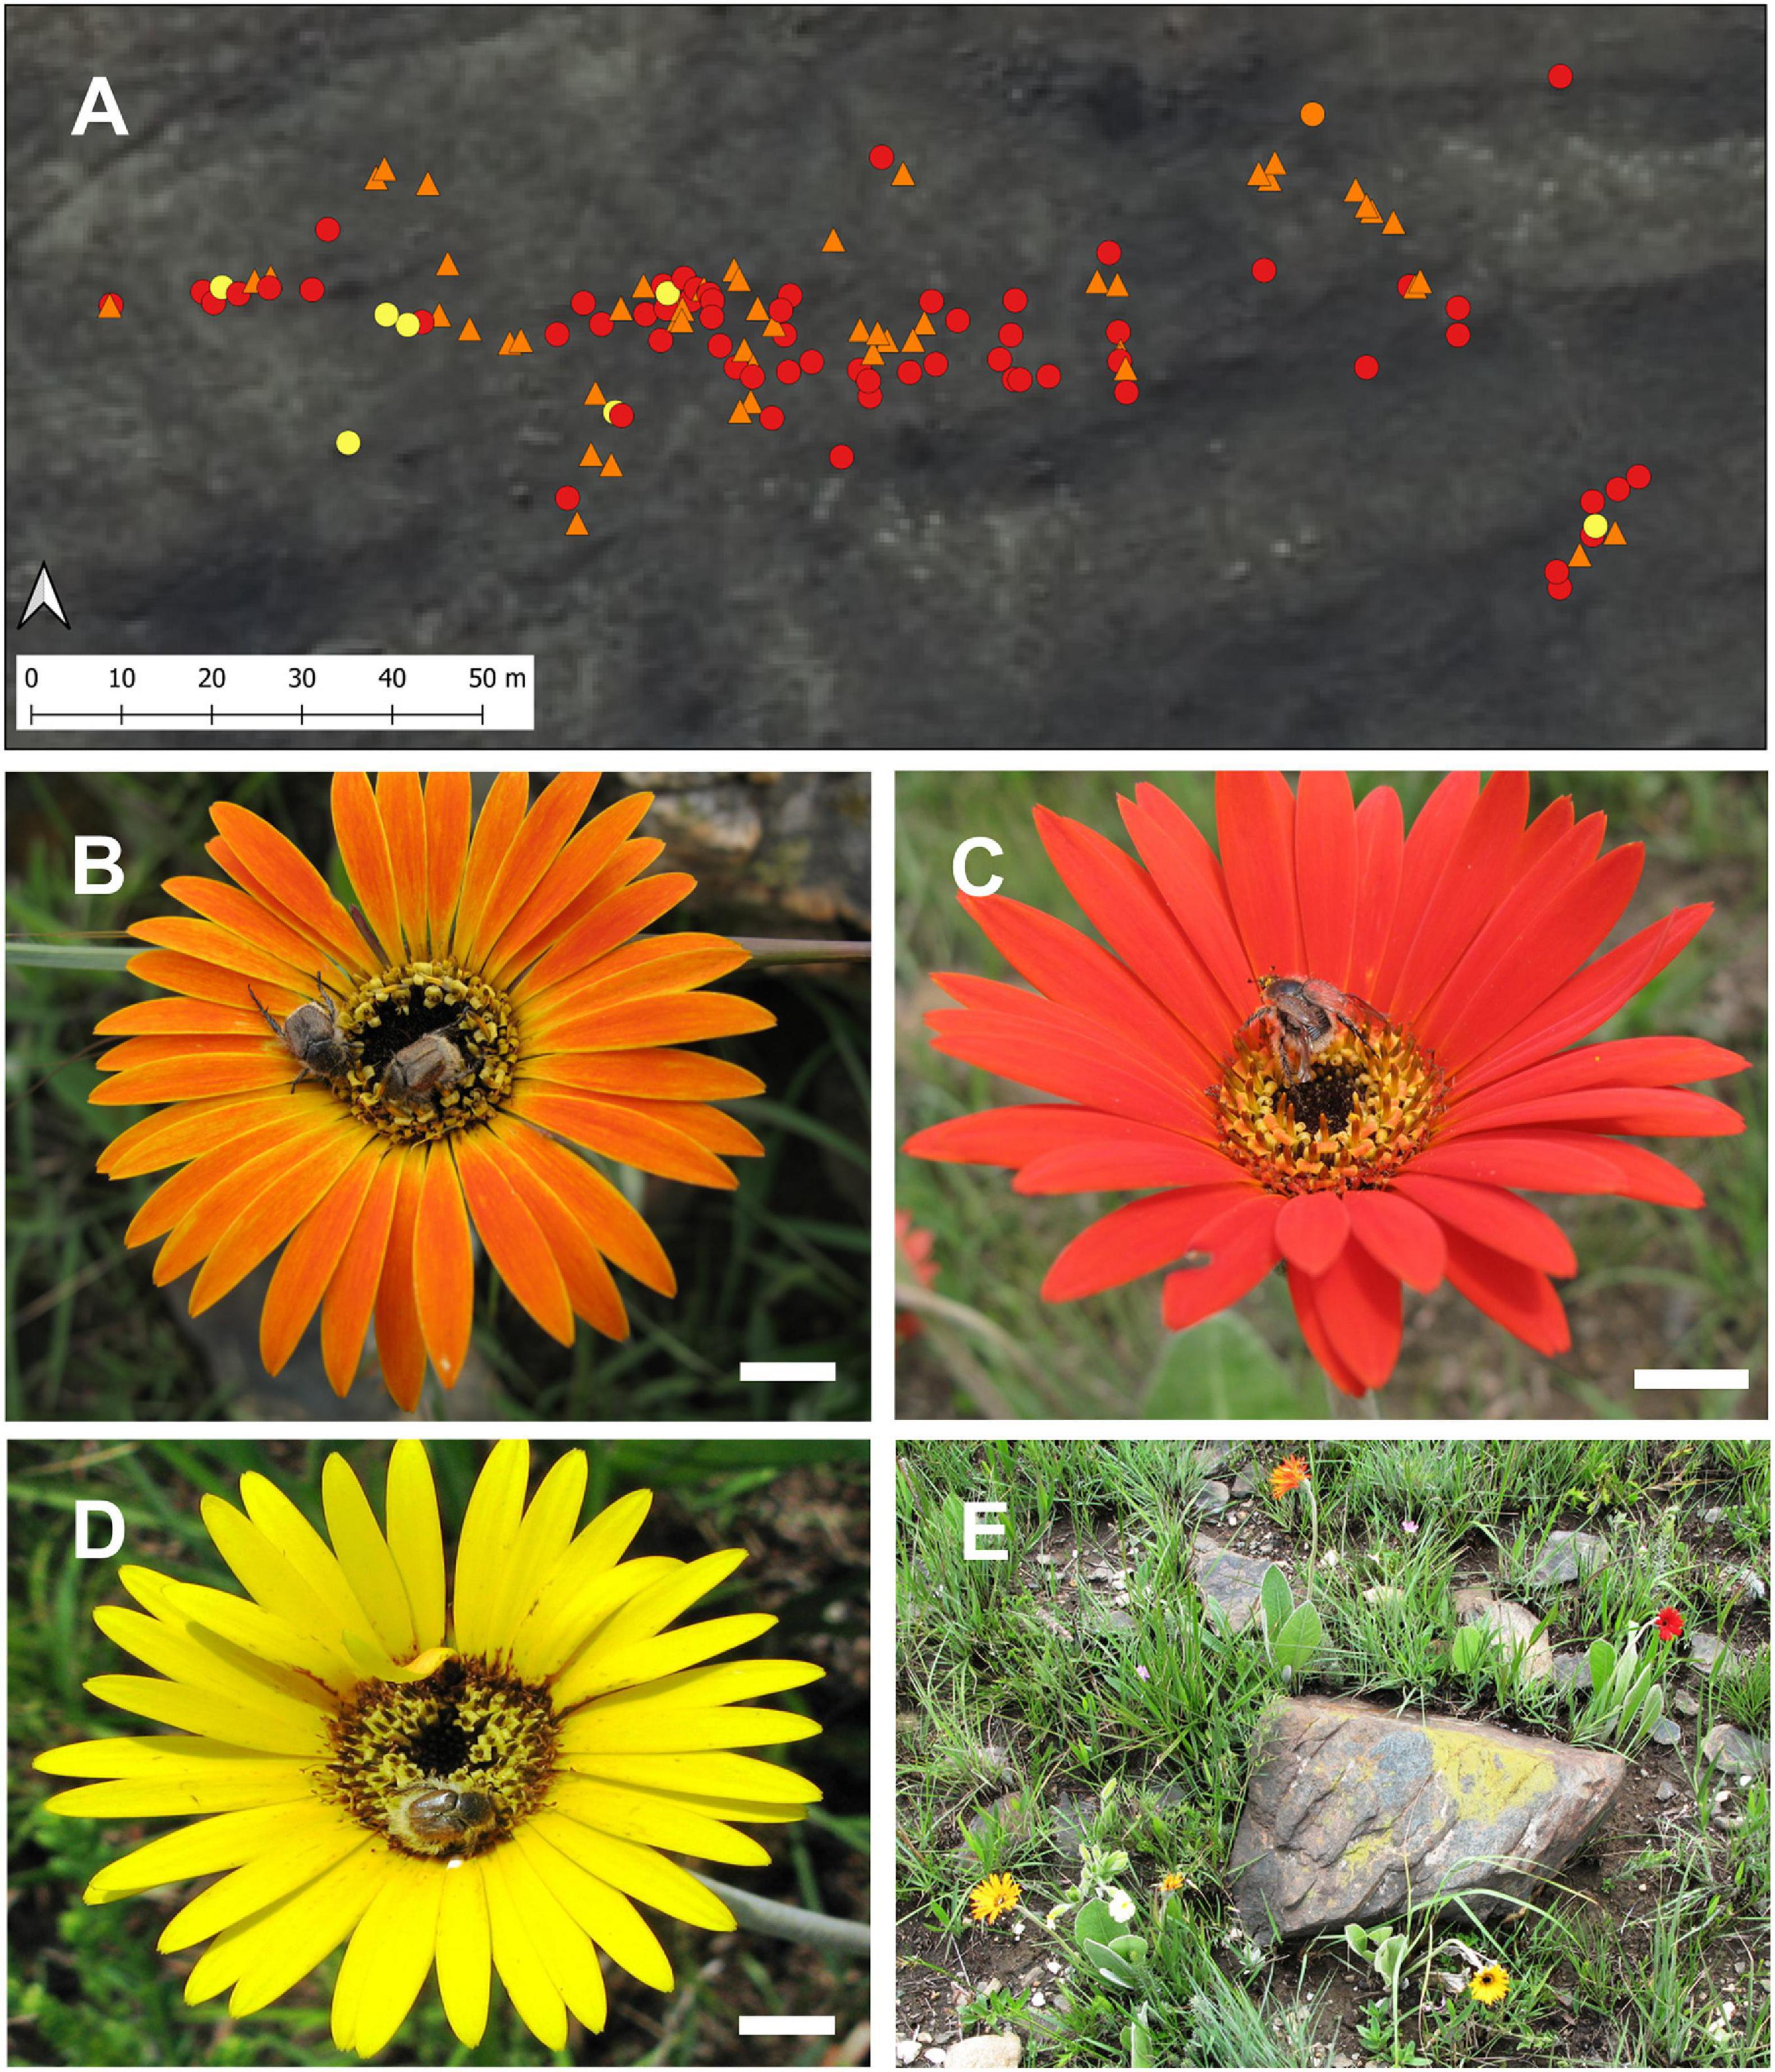
Figure 4. (A) Map showing gps positions of Gerbera aurantiaca capitulum color forms in the polymorphic RH population, (B–D) Eriesthis vulpina beetles visiting orange, red and yellow capitula (Scale bars = 1 cm), and (E) different color forms growing in close proximity in the RH population.
Common Garden Experiment
Both ramets and seed-raised plants retained the capitulum color of the parent populations when grown in a common garden over a 5-year period. Flowering ramets collected in the red-flowered BY (mean inflection point 616.0 ± 1.7 nm, N = 5) and yellow-flowered NG (mean inflection point 525.6 ± 1.8, N = 5) populations showed no change from their original ray floret morph color (χ2 = 3397.82, df = 1, P < 0.0001) with no significant change in morph color recorded over the 5-year observation period (χ2 = 1.319, df = 1, P = 0.517) and no significant interaction between population and year (χ2 = 1.530, df = 3, P = 0.465) (Figure 5A).
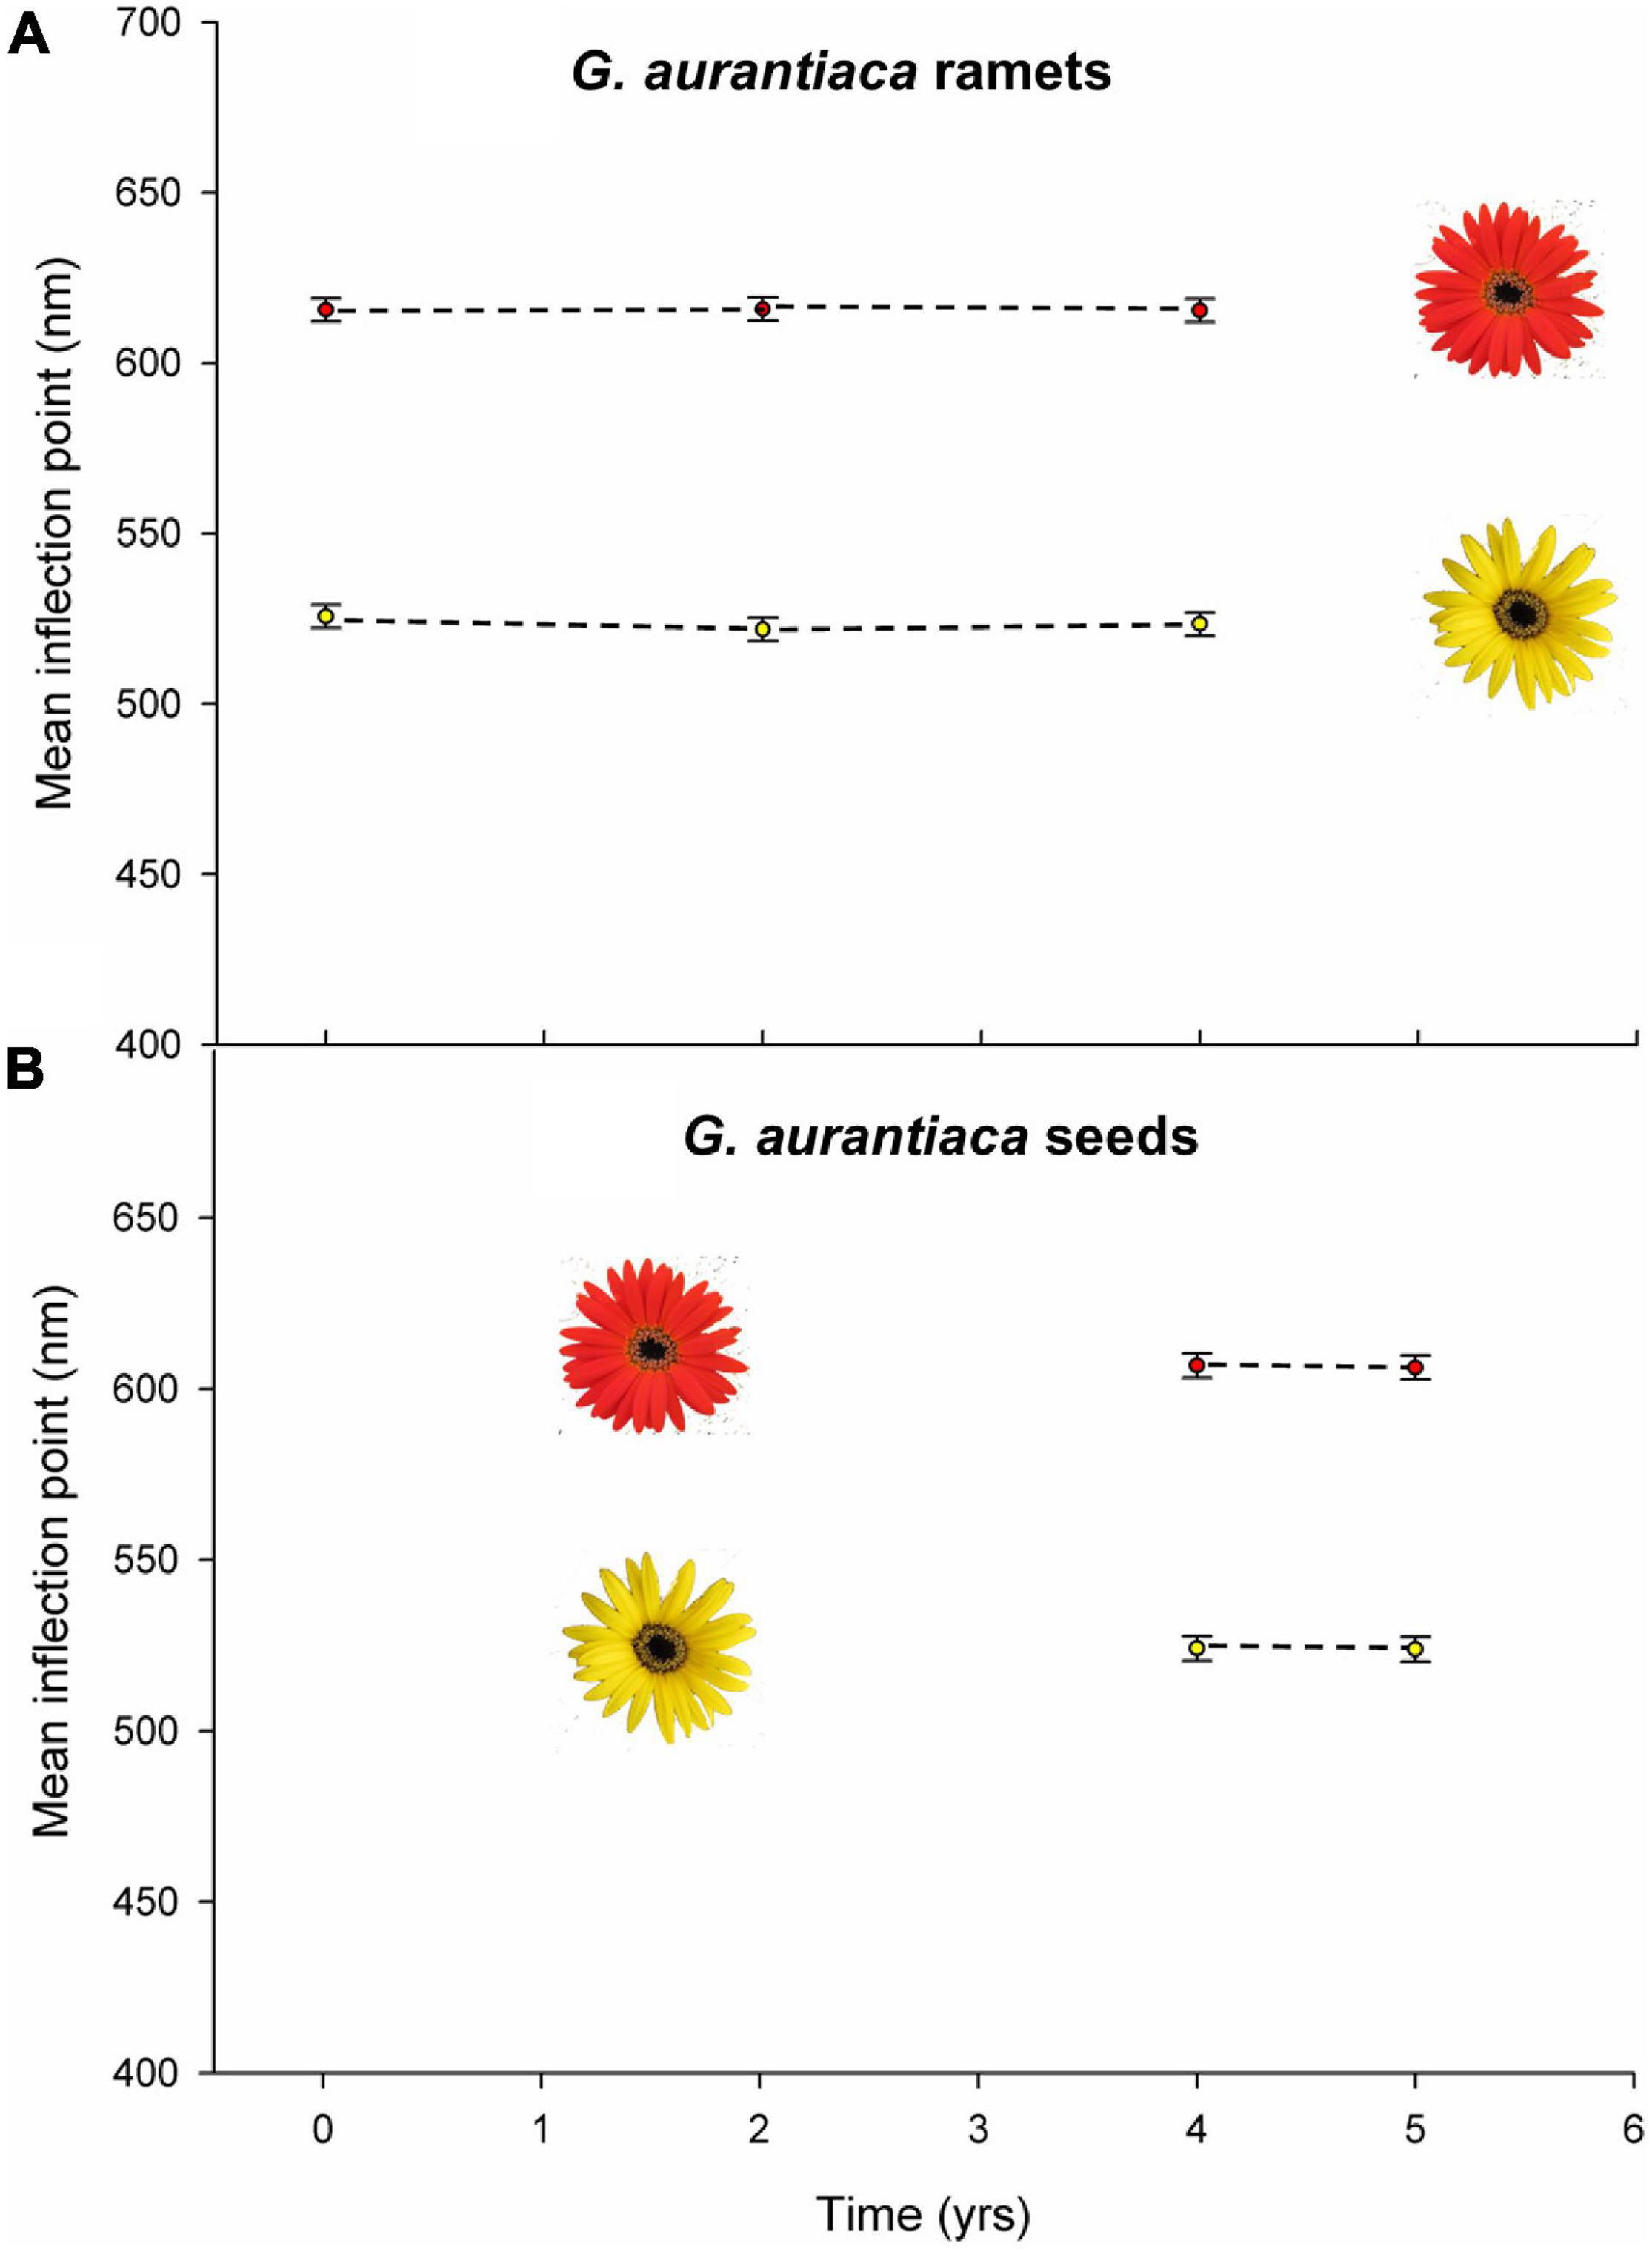
Figure 5. Mean inflection points of the ray florets of Gerbera aurantiaca plants cultivated in a common garden of (A) ramets from the BY and NG populations at collection and after 2 and 5 years, and (B) from seed collected from the LM and NG populations after 4 and 5 years. Vertical bars indicate 95% confidence intervals.
Seed-raised plants flowered 4 years after germination and displayed the predominant capitulum color of the source populations: LM (red with mean inflection point 606.80 ± 1.8 nm, N = 18) and NG (yellow with mean inflection point 523.4 ± 1.9 nm, N = 18). There was a significant difference between the mean inflection points of the two seed populations (χ2 = 2012.457, df = 1, P < 0.0001) but there was no significant effect of time (χ2 = 0.51, df = 1, P = 0.821) or interaction between seed population and year (χ2 = 0.003, df = 2, P = 0.957) (Figure 5B).
Color Choice Behavior of Insect Visitors
A total of 682 E. vulpina beetles, and 39 honeybees, as well as some insects from other taxonomic groups were caught in the red and yellow pan traps. At all populations where beetles were present (UH, LK, NG, and RH) significantly more individuals of E. vulpina were caught in yellow than red traps (Figure 6A and Supplementary Table 6). The highest number of beetles overall was trapped at the red-flowered UH population, followed by RH (flower color polymorphic), NG (yellow), and LK (predominantly red), while no individuals of E. vulpina were trapped at the two southernmost sites, BY and VC (red). We recorded significant effects of population (χ2 = 97.951, df = 5, P = 0.001), and of trap color (χ2 = 14.904, df = 1, P = 0.001) on the number of E. vulpina beetles caught, but the interaction between population and trap color was not significant (χ2 = 7.182, df = 6, P = 0.207) suggesting that there were no marked differences in beetle color preference between populations.
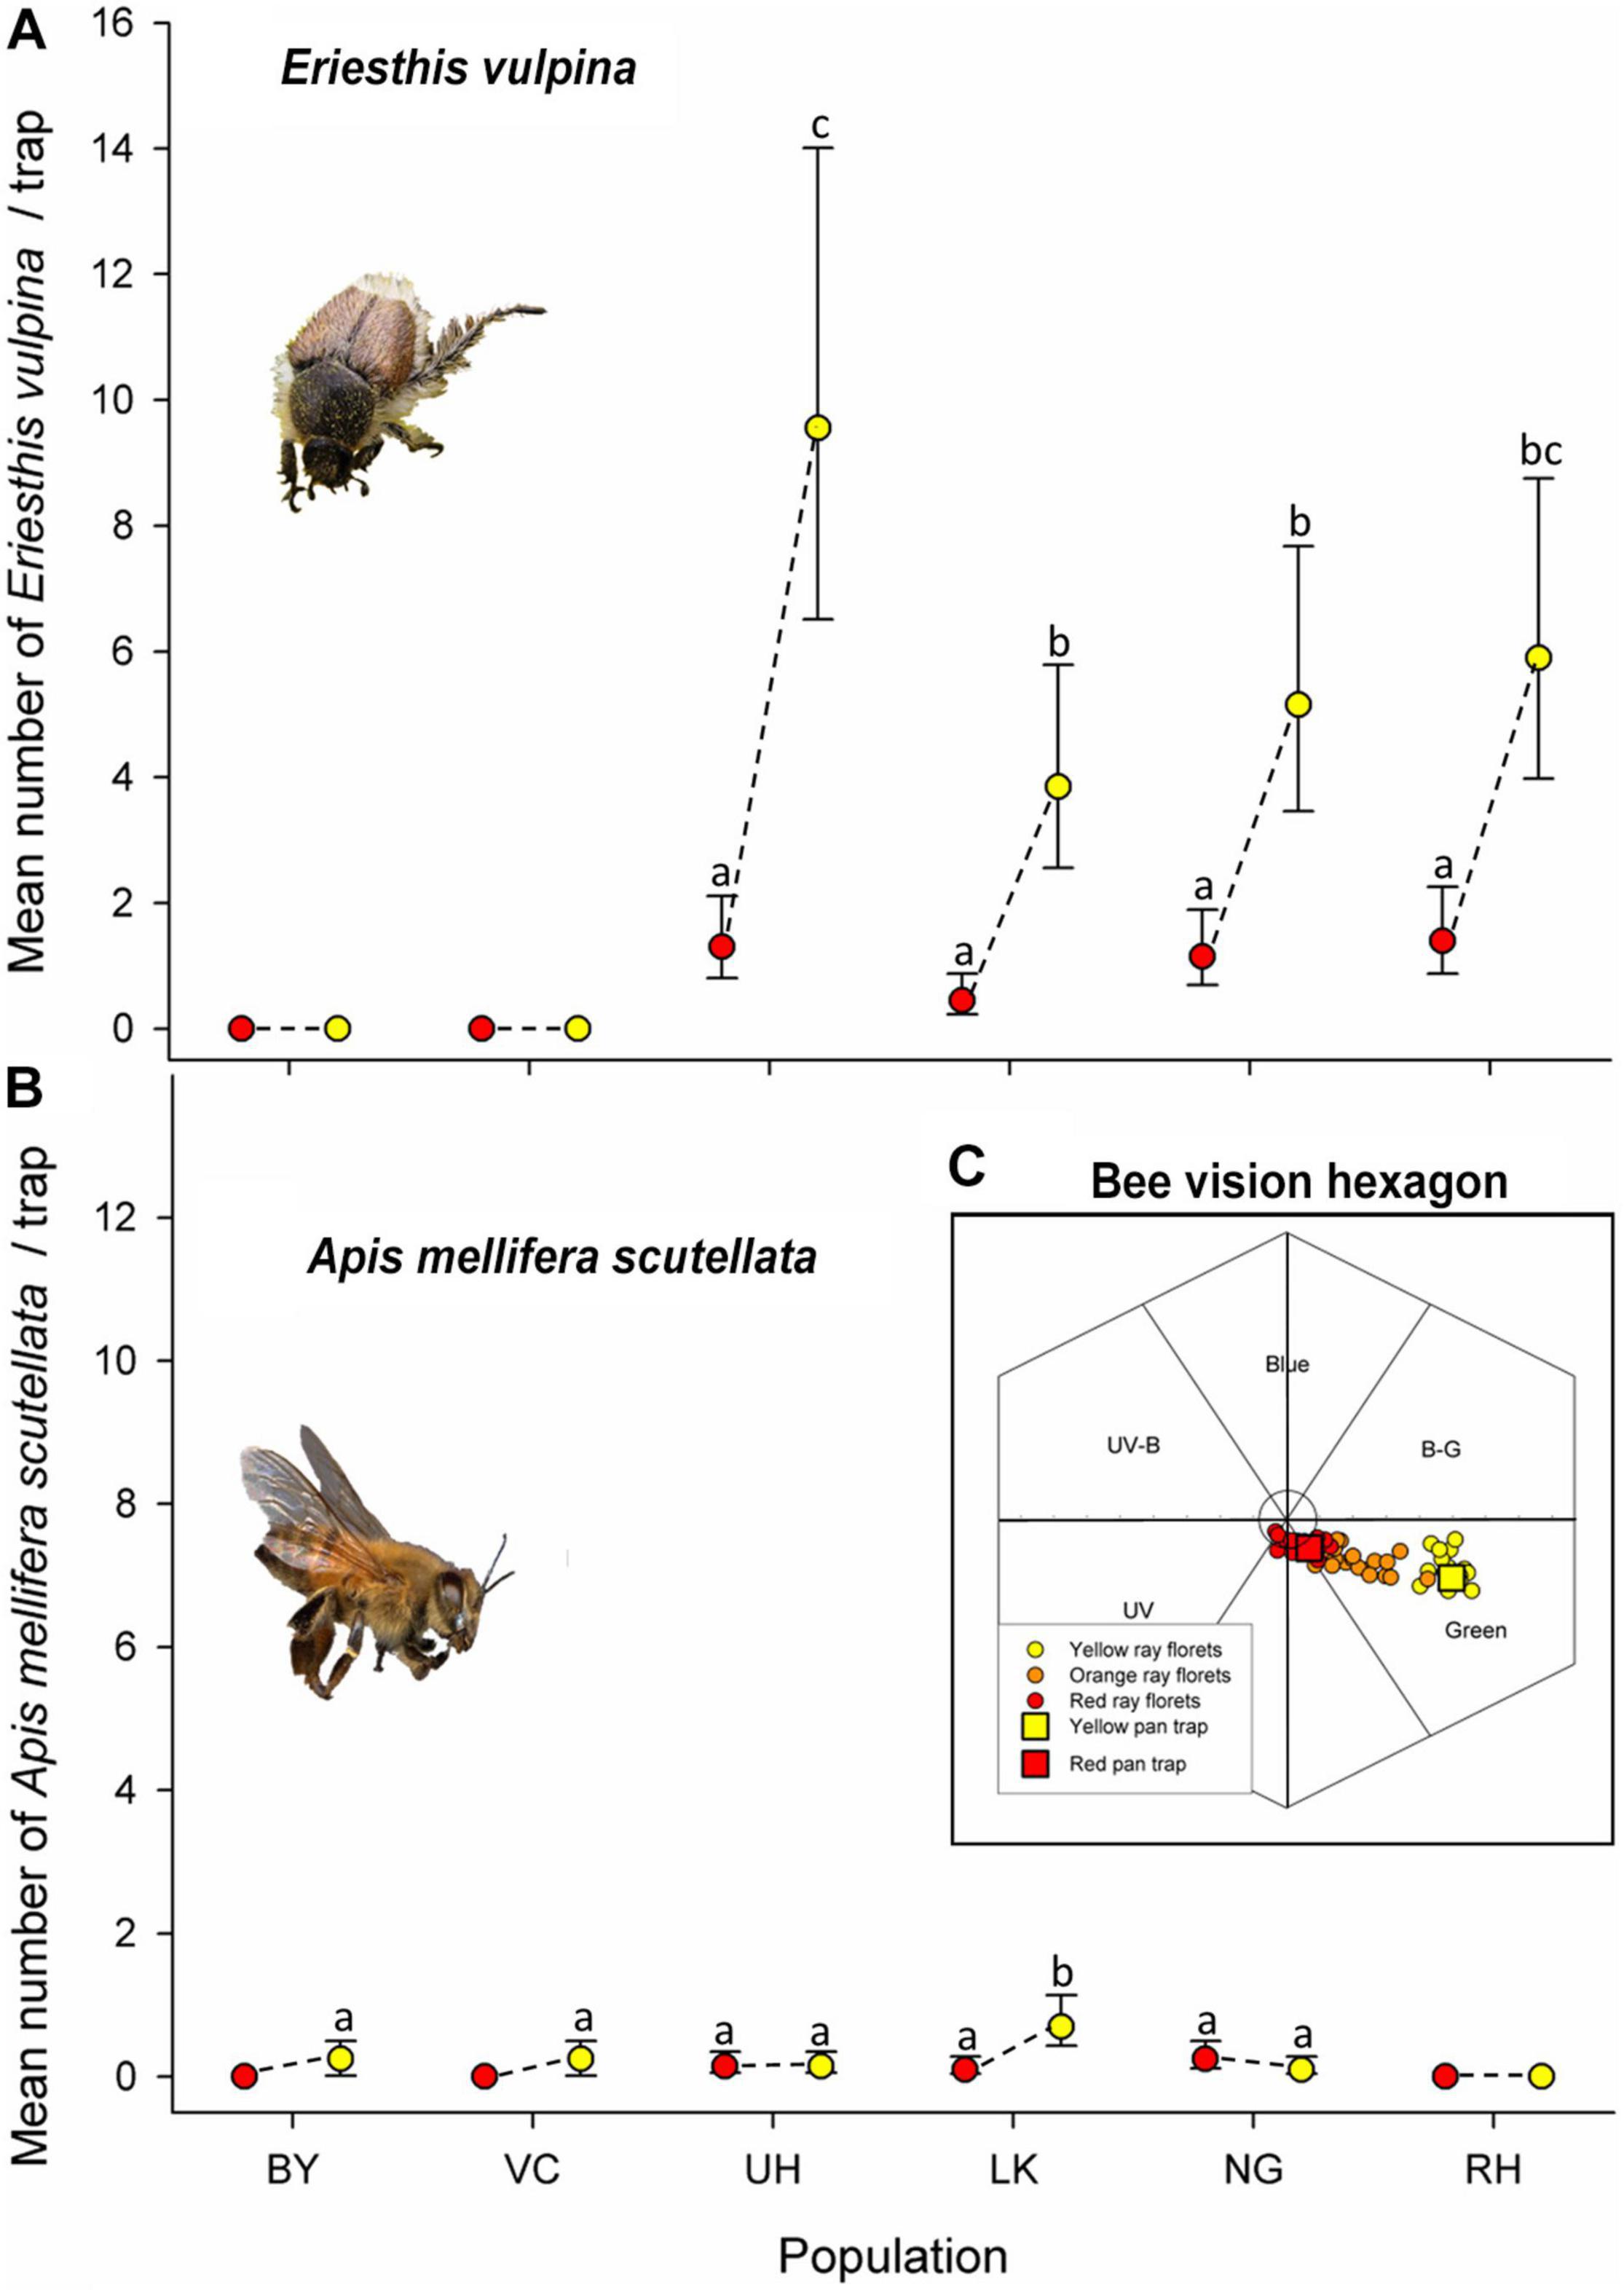
Figure 6. Mean numbers of hopliine scarab beetles and honeybees caught in yellow and red pan traps at the six study sites during an 8-h period. (A) Eriesthis vulpina (no individuals were trapped at the BY and VC sites) and (B) Apis mellifera scutellata, and (C) ray floret colors of the yellow, orange and red forms of Gerbera aurantiaca and red and yellow pan trap spectra as loci in the hymenopteran visual space hexagon. The six segments represent the six categories of bee color perception. Distance of the loci from the origin gives an indication of the ability of bees to perceive the color and distance between loci the ability to discriminate between the colors. Mean Euclidean distances from origin ± SD: yellow 0.52 ± 0.048 N = 16, 0.27 ± 0.11 N = 10 for orange and 0.107 ± 0.036 N = 20 for red. Vertical bars indicate 95% confidence intervals. Means sharing letters are not significantly different.
Very few honeybees were captured in pan traps, but despite this low statistical power we detected a slight significant effect of trap color (χ2 = 5.172, df = 1, P = 0.023), but not of population (χ2 = 9.464, df = 5, P = 0.092). There was a significant interaction between population and trap color (χ2 = 15.352, df = 6, P = 0.009) with more bees trapped in yellow than red traps at four of the populations (BY, VC, UH, and LK), equal numbers at NG and none trapped at RH although they were frequently observed on other plants at the site (Figure 6B and Supplementary Table 6).
When plotted in the model of hymenopteran color perception, loci of G. aurantiaca ray floret reflectance spectra were positioned primarily in the green and UV green segments of the hexagon with the florets of the red color forms clustered more closely to the origin of the hexagon than the yellow forms, suggesting that the yellow capitula are more visible to bees than the red. The loci of orange forms were intermediate between red and yellow in bee color space (Figure 6C). The spectral reflectances of the pan traps (Supplementary Figure 2) were similar to those of the red and yellow ray florets in terms of hymenopteran color perception (Figure 6C) and inflection points (red trap = 601 nm, floret = 608 nm; yellow trap = 519 nm, floret = 524).
Capitulum Visitation and Fruit Set in the Color Polymorphic Population
Analysis of the incidence of E. vulpina beetles present on orange, red and yellow colored capitula (Figures 4B–D) at the mixed color site (RH) during transect surveys in three separate years indicated that the beetles did not discriminate among color morphs, with no significant differences found between the proportions of orange, red and yellow capitula that were occupied by beetles (χ2 = 0.410, df = 2, P = 0.814). The overall proportion of capitula occupied by beetles varied significantly among years (χ2 = 24.90, df = 2, P < 0.0001) with a higher incidence of beetles on capitula in 2013 than in 2008 or 2011 (Figure 7A). There was no interaction between year and color morph (χ2 = 0.643, df = 4, P = 0.958), implying that responses to colors by beetles did not vary among years.
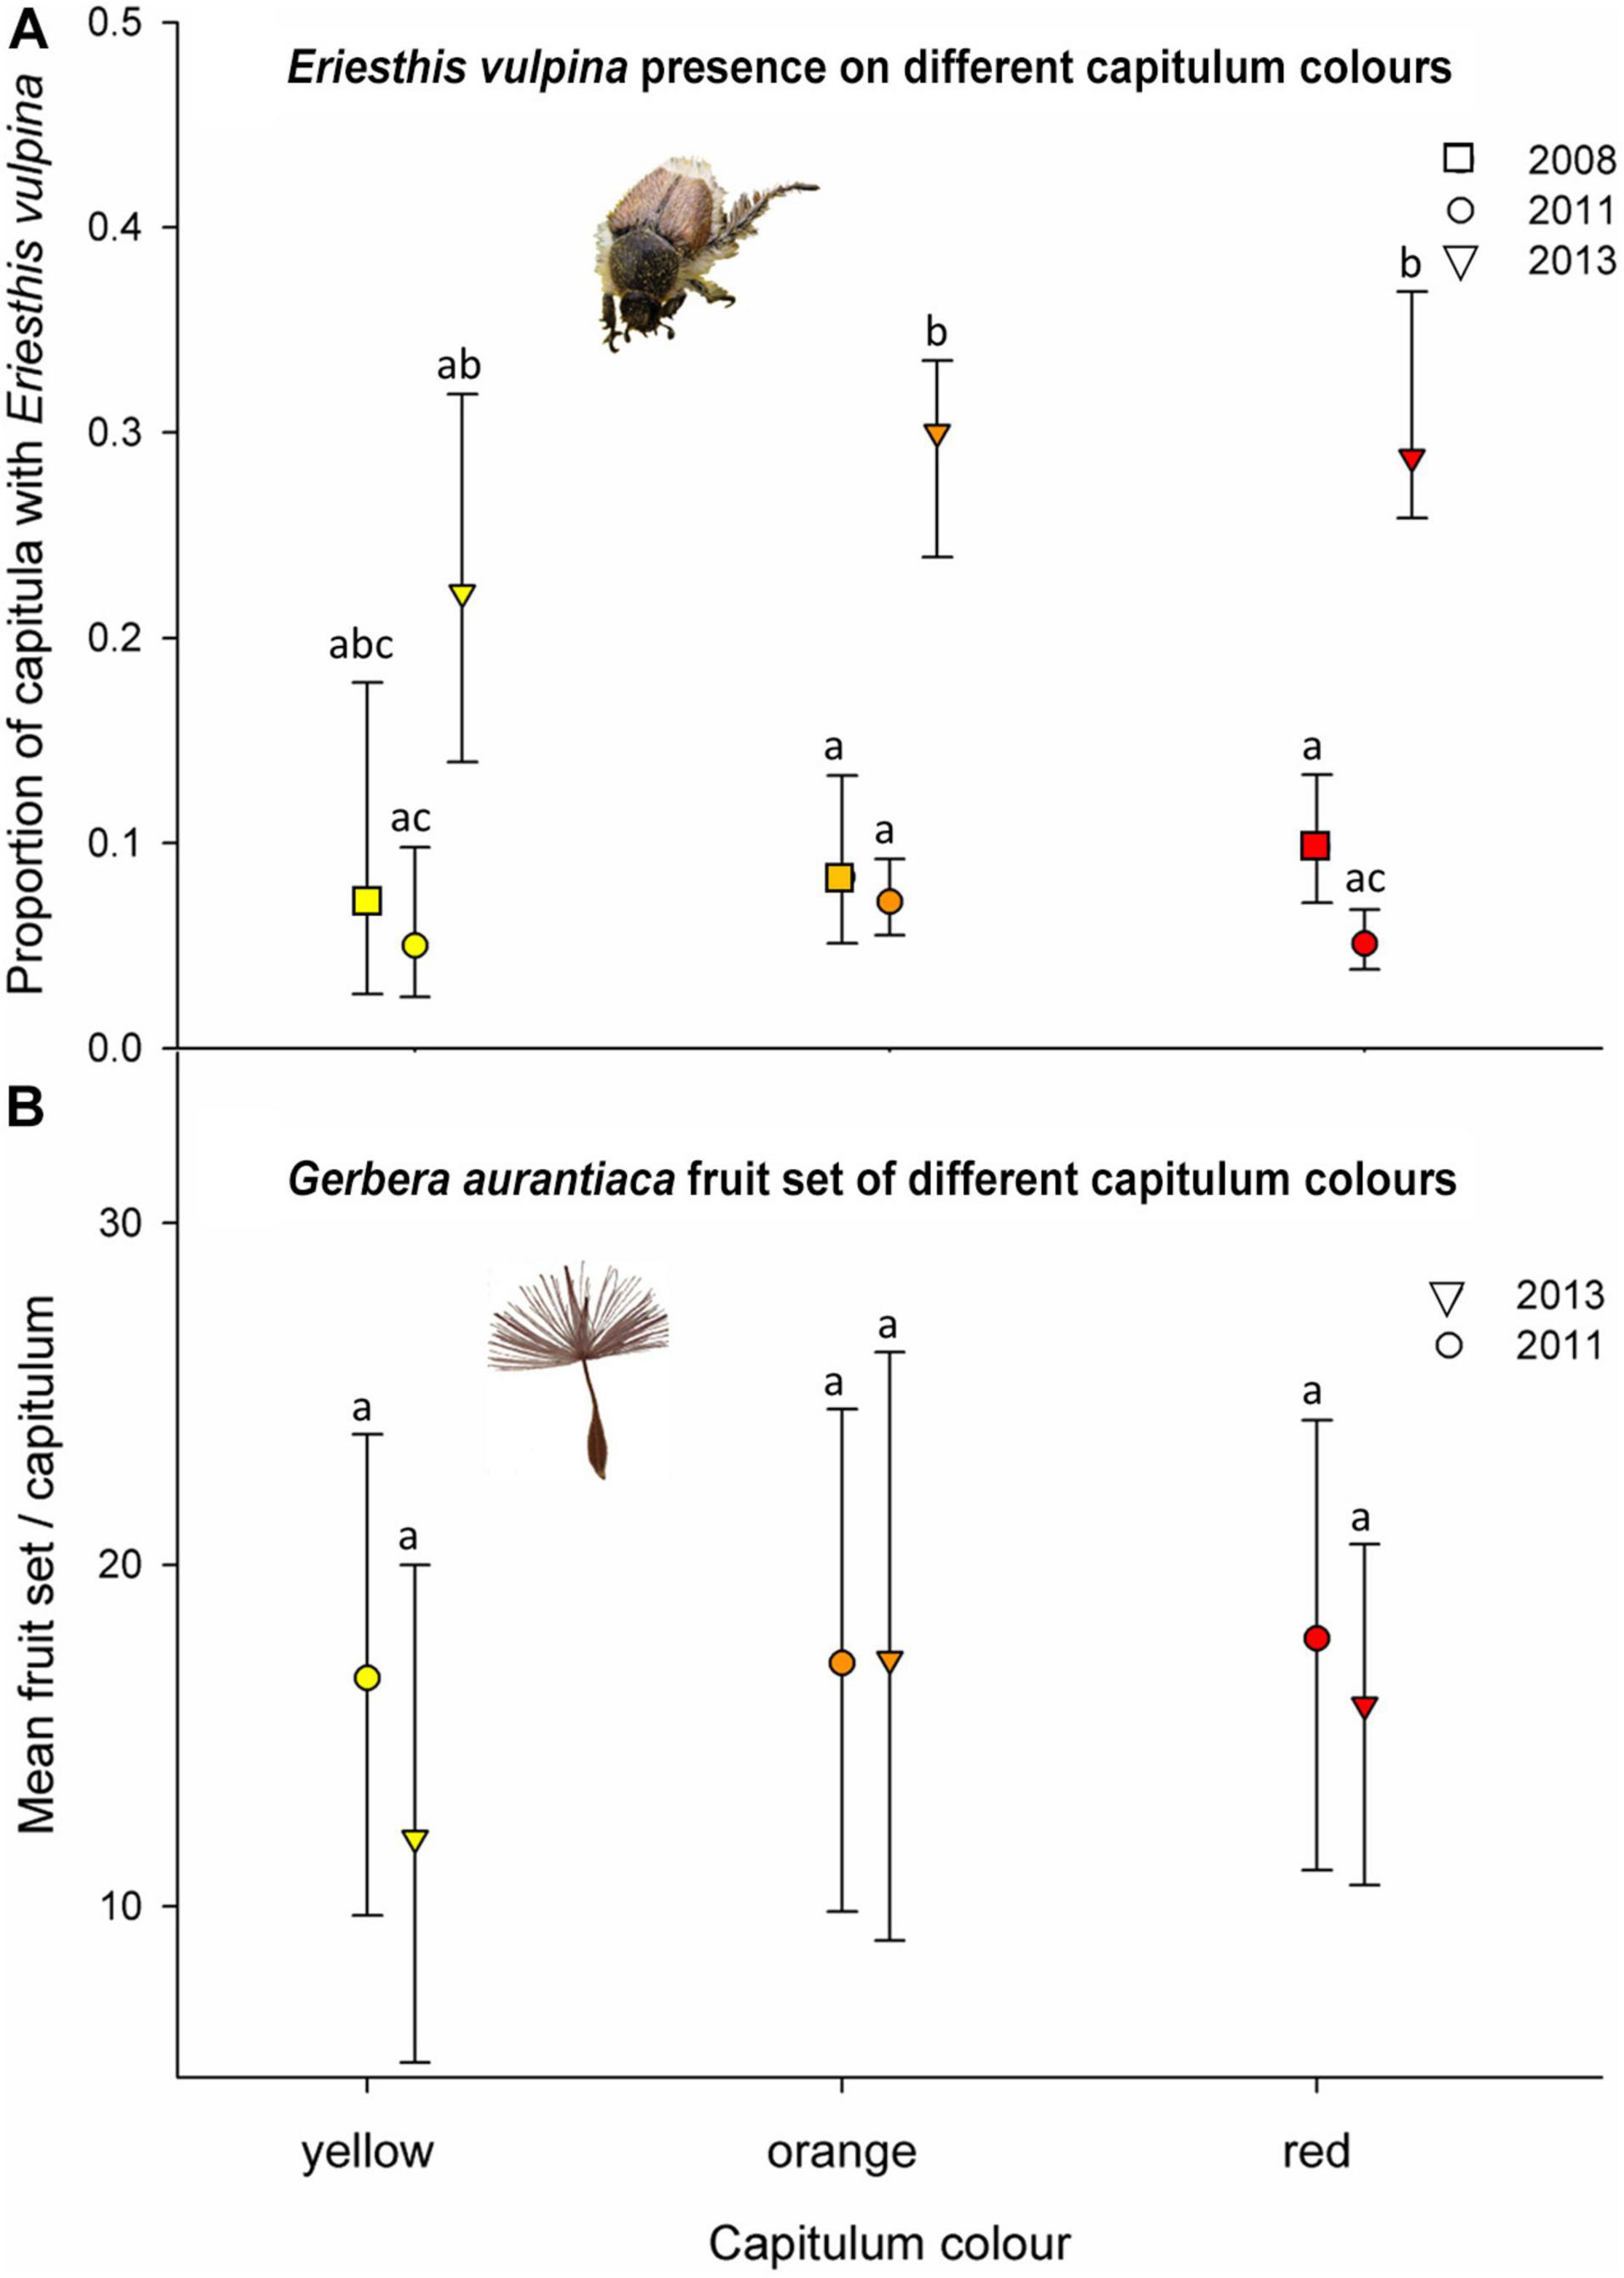
Figure 7. (A) In-situ hopliine scarab beetle (Eriesthis vulpina) capitulum color preference in the color polymorphic RH population: Proportion of yellow, orange and red Gerbera aurantiaca capitula with E. vulpina individuals present during 2008, 2011, and 2013 flowering seasons. (B) Mean fruit set per capitulum of the yellow, orange and red color forms at the RH population in 2011 and 2013. Vertical bars indicate 95% confidence intervals. Means sharing letters are not significantly different.
We did not detect any significant differences in mean fruit set among color morphs in 2011 or 2013 (χ2 = 0.349, df = 2, P = 0.840) or year (χ2 = 292, df = 1, P = 0.589). There was no significant interaction between year and color morph (χ2 = 0.216, df = 3, P = 0.898) (Figure 7B).
Discussion
This study reveals a pattern of geographical structure of variation in capitulum color of G. aurantiaca along the north-south axis of its range with most southern populations being predominantly red, the central cluster being predominantly yellow, and four populations, mainly in the north displaying a pattern of within population color polymorphism. Color variation in two polymorphic populations was continuous, but with inflection points clustering in two groups, as supported by the finite mixture analysis. We found no clear association between capitulum color and various ecogeographic and edaphic factors although a more detailed analysis of nitrogen in the forms utilized by plants should be carried out in future studies to confirm this. We recorded no spatial segregation of color morphs in the polymorphic RH population with plants of different inflorescence color growing intermixed in close proximity, suggesting that climate and soils do not influence floral color. Floral color was maintained over a 5-year period in a common garden experiment, both in ramet- and seed-grown plants, further indicating that the color polymorphism is not a response to soil or climatic variation (de Villemereuil et al., 2016). While the lack of a clear association with abiotic factors points to a biotic explanation for the evolutionary divergence in flower color among populations, the role of pollinators as drivers of the color change in G. aurantiaca is not entirely clear. Pollination studies have shown that a single hopliine scarab beetle species, E. vulpina, is responsible for the majority of all floral visits to G. aurantiaca (Johnson et al., 2004), unlike the color polymorphic Drosera cistiflora in the western Cape region of South Africa, where several different species of hopliine scarab beetles discriminate between different color forms in the same population (Johnson et al., 2020). Our study did not provide clear evidence that E. vulpina beetles prefer any particular capitulum color within a population as they were recorded visiting capitula in both the red and yellow–flowered populations, and they did not appear to discriminate between G. aurantiaca color morphs at the northern color polymorphic RH site. This was further supported by the lack of significant differences in fecundity of the three color morphs at the RH population, where capitula were almost exclusively visited by E. vulpina beetles.
Native honeybees are frequent visitors to the flowers of many plant species of the eastern South African grasslands (Hepburn and Radloff, 1995; Stanley et al., 2020) but there is some debate regarding their ability to easily detect red flowers (Chittka and Waser, 1997; Lunau et al., 2011). Although honeybees were observed visiting other flower species in the color polymorphic RH population and were frequently seen on yellow capitula in the monomorphic NG population, none were recorded on red G. aurantiaca capitula during the transect surveys. The relative importance of monkey beetles and honeybees as pollinators of yellow populations of G. aurantiaca is difficult to determine without further research into pollen deposition efficiency (King et al., 2013).
While E. vulpina preferred yellow over red in the color choice experiments using pan traps at all populations where it was present (including the predominantly red-flowered), approximately 25% of the total catch was from red traps. Based on this and the frequent presence of E. vulpina on red capitula it appears that red-colored flowers are easily detected by this beetle. Although beetles preferred yellow over red plastic bowls, this may reflect the particular spectral properties of the plastic bowls in this experiment. Attraction of hopliine scarab beetles in the Western Cape to red bowl-shaped flowers has been recorded in previous studies (Johnson and Midgley, 2001; Johnson et al., 2004; Van Kleunen et al., 2007), but these studies indicate that trap color choices do not necessarily reflect the flower colors favored by these beetles (Picker and Midgley, 1996; Mayer et al., 2006; Van Kleunen et al., 2007). We hesitate to conclude that beetles generally prefer yellow over red flower color as such a preference was not evident in our survey of beetles on capitula in polymorphic populations. This survey suggests that in natural polymorphic populations, red, orange and yellow capitula have equal probabilities of being visited by E. vulpina. This could also indicate that additional cues other than color, such as suitability of larger capitula for socializing, may be used by these beetles for recognition and choice of floral host plants (Dafni, 1997). We found no association between capitulum and ray floret size and flower color inflection points in the RH polymorphic population suggesting that capitulum color is not linked to morphological traits and thus unlikely to evolve through pleiotropic effects of morphological evolution. We did not use a vision model to determine how E. vulpina beetles may perceive the ray floret and pan trap colors as the spectral sensitivity of photoreceptors of this species is not known. Coleopteran vision has been less well studied than hymenopteran vision but recent studies suggest that their visual capability can extend into longer wavelengths than that of Hymenoptera (Martínez-Harms et al., 2012; Lebhardt and Desplan, 2017; Streinzer et al., 2019).
We caught relatively fewer honeybees than hopliine scarab beetles in the pan traps, but even our small sample suggested that bees showed a marked preference for yellow over red at most sites. When plotted in the bee color hexagon, the loci for red ray floret limbs of G. aurantiaca capitula and for the red pan traps used here are close to those for the vegetative background, and are therefore likely to be indistinct to honeybees, while the loci for yellow ray florets and for the yellow pan traps place further away from that of the background providing a heightened contrast and are therefore more visibly distinct to hymenopterans. This may explain why bees seldom visit the red color forms of G. aurantiaca but were frequently observed visiting capitula in the yellow NG population, although, curiously, not in the polymorphic RH population. The yellow-flowered population of G. aurantiaca may thus have a bimodal pollination system involving both beetles and honeybees.
Red flowers that are not bird pollinated are uncommon in these mistbelt grasslands and as far as we are aware there are no insect pollinators that specialize on visiting red flowers in the region other than the butterfly Aeropetes tulbaghia (Johnson et al., 2009) which is a nectar feeder and unlikely to visit G. aurantiaca. The hopliine scarab beetles which pollinate the G. aurantiaca flowers appear to be attracted to all color forms equally and in red-flowered populations where they are absent fruit set is extremely low (Johnson et al., 2004) making the dominance of red capitula in these southernmost populations enigmatic. One possible scenario is that the red form of G. aurantiaca was historically associated with a pollinator which selected for the red color, but is no longer present (Cooley et al., 2008; Hopkins and Rausher, 2012) and that the long-lived clonal growth form of G. aurantiaca would allow the red color form to persist long after the selective preference of the now absent specialist pollinator had disappeared. A second possibility, yet to be tested, is that pollen robbers such as honeybees have a net negative effect on plant fitness because of their efficient collection and transfer of pollen to their corbiculae without depositing it on appropriate stigmas and therefore causing pollen limitation (Hargreaves et al., 2010). It has been proposed that red flower color could be a strategy to avoid pollen robbing by bees (Lunau et al., 2011; Santamaría and Rodríguez-Gironés, 2015). In this case, the red color of some morphs may represent a compromise between attraction and defense, in that red capitula are clearly attractive to beetle pollinators while at the same time are relatively inconspicuous to pollen-robbing insects such as honeybees. While this strategy appears effective in the case of G. aurantiaca since honeybees were seldom observed visiting red flowers, the high fruit set in the yellow NG population where honeybees were frequent recorded suggests that they may contribute to fruit set. Experimental observations of the relative success of single visits on fruit set by honeybees and comparisons of the efficiency of pollen transfer by beetles vs. honeybees at this site may help to clarify this.
A further possibility to consider is that the color polymorphic populations in the northern part of the range may be the result of red and yellow forms meeting and interbreeding. Preliminary crosses indicate that the red and yellow color forms of G. aurantiaca breed true, with inter-red and inter-yellow crosses producing entirely red and yellow F1 offspring, respectively. Crosses between red and yellow forms (both yellow pollen onto red mothers and red pollen onto yellow mothers) produce almost entirely orange and yellow F1 offspring (IM Johnson, unpublished data). However, we are not aware of red-flowered populations in the northern part of the distribution range of G aurantiaca, which casts doubt on the idea that within-population color polymorphism reflects hybridization.
Since the capitulum color variation across the distribution range of G. aurantiaca described here does not appear be influenced by pollinator color preference or climatic and soil characteristics it provides an ideal system for testing whether there is a pattern of neutral evolution that reflects simple isolation by distance (Wright, 1943; Schemske and Bierzychudek, 2001, 2007). We are currently analyzing the population genetic structure across the geographic and color variation range using molecular markers to gain a better understanding of the genetic relationships among populations and color morphs.
In conclusion, we found that the geographic pattern of capitulum color distribution in G. aurantiaca populations does not appear to be associated with abiotic factors or pollinator color preferences. The idea that the divergence between red- and yellow-flowered population reflects a shift between beetle and bee populations is appealing, but we did not obtain clear evidence that hopliine scarab beetles favor red over orange or yellow inflorescences in the color polymorphic population. Further work needs to be conducted to explore the effects of capitulum color on interactions between G. aurantiaca and various antagonists, such as pollen thieves, herbivores and seed predators, as well as detailed genetic studies of within and between population structure in order to better understand the mechanisms driving color variation in this species.
Data Availability Statement
The original contributions presented in the study are included in the article/Supplementary Material, further inquiries can be directed to the corresponding author/s.
Author Contributions
This manuscript is based on a Ph.D. thesis by IMJ who collected the data and wrote up the results under the supervision of SDJ and TJE. All authors contributed to the article and approved the submitted version and participated in the design of the study.
Funding
This study was funded by the Botanical Society of South Africa and the National Research Foundation of South Africa (Grant 46372 to SDJ).
Conflict of Interest
The authors declare that the research was conducted in the absence of any commercial or financial relationships that could be construed as a potential conflict of interest.
Acknowledgments
We thank Ezemvelo KZN Wildlife and Mpumalanga Parks and Tourism for research permits (EKZNW 2554/2003; 3021/2005, 394/2010), Mondi (Ltd.) and SAPPI Forestry Companies, and private landowners for permission to work on their properties and John and Sandi Burrows for alerting us to the polymorphic population in Mpumalanga. The KwaZulu-Natal National Botanical Garden (South African National Biodiversity Institute) provided nursery facilities for the common garden experiment and Craig Morris (ARC) gave assistance with statistical analysis of soil variables. Three reviewers and the editor provided extremely insightful comments.
Supplementary Material
The Supplementary Material for this article can be found online at: https://www.frontiersin.org/articles/10.3389/fevo.2021.676520/full#supplementary-material
Supplementary Figure 1 | Scree plot showing eigenvalues of principal components for edaphic variables of 14 G. aurantiaca population.
Supplementary Figure 2 | Reflectance spectra of red and yellow pan traps.
Supplementary Table 1 | Location, geographical and climatic conditions of G. aurantiaca populations across their distributional range.
Supplementary Table 2 | Mean inflection points of Gerbera aurantiaca ray florets from the six study populations.
Supplementary Table 3 | Floral morphological traits measurements (inflection points, capitulum diameter and ray floret length) from the color polymorphic RH population of Gerbera aurantiaca.
Supplementary Table 4 | Soil chemical properties for 14 sites across the geographical range of Gerbera aurantiaca.
Supplementary Table 5a | Total variance of explained soil variable components.
Supplementary Table 5b | Component matrix for G. aurantiaca soil variables.
Supplementary Table 5c | Regression factor scores for soils PCA of 14 G. aurantiaca populations.
Supplementary Table 6 | Pan trap catches: numbers of Eriesthis vulpina and Apis mellifera individuals caught in red and yellow pan traps.
References
Arista, M., Talavera, M., Berjano, R., and Ortiz, P. L. (2013). Abiotic factors may explain the geographical distribution of flower colour morphs and the maintenance of colour polymorphism in the scarlet pimpernel. J. Ecol. 101, 1613–1622. doi: 10.1111/1365-2745.12151
Arnold, S., Faruq, S., Savolainen, V., MacOwen, P., and Chittka, L. (2010). FReD: The floral reflectance database — A web portal for analyses of flower colour. PLoS One 5:e14287. doi: 10.1371/journal.pone.0014287
Bernhardt, P. (2000). Convergent evolution and adaptive radiation of beetle-pollinated angiosperms. Plant Syst. Evol. 222, 293–320. doi: 10.1007/978-3-7091-6306-1_16
Bohm, B. A., and Stuessy, T. F. (2001). Flavonoids of the Sunflower Family (Asteraceae). New York: Springer.
Braak, C. J. F. T., and Smilauer, P. (2002). CANOCO: Reference Manual and CanoDraw for Windows User’s Guide: Software for Canonical Community Ordination (version 4.5).
Bradshaw, H. D., and Schemske, D. W. (2003). Allele substitution at a flower colour locus produces a pollinator shift in monkeyflowers. Nature 426, 176–178. doi: 10.1038/nature02106
Campbell, D. R., Bischoff, M., Lord, J. M., and Robertson, A. W. (2010). Flower color influences insect visitation in alpine New Zealand. Ecology 91, 2638–2649. doi: 10.1890/09-0941.1
Carlson, J. E., and Holsinger, K. E. (2013). Direct and indirect selection on floral pigmentation by pollinators and seed predators in a color polymorphic South African shrub. Oecologia 171, 905–919. doi: 10.1007/s00442-012-2453-2
Chittka, L., and Menzel, R. (1992). The evolutionary adaptation of flower colours and insect pollinators colour vision. J. Comp. Physiol. A 171, 171–181.
Chittka, L., and Raine, N. E. (2006). Recognition of flowers by pollinators. Curr. Opin. Plant Biol. 9, 428–435. doi: 10.1016/j.pbi.2006.05.002
Chittka, L., and Waser, N. M. (1997). Why red flowers are not invisible to bees. Israel J. Plant Sci. 45, 169–183. doi: 10.1080/07929978.1997.10676682
Coberly, C., and Rauscher, M. D. (2008). Pleiotropic effects of an allele producing white flowers in Ipomea purpurea. Evolution 62, 1076–1085. doi: 10.1111/j.1558-5646.2008.00355.x
Cooley, A. M., Carvallo, G., and Willis, J. H. (2008). Is floral diversification associated with pollinator divergence? Flower shape, flower colour and pollinator preference in Chilean Mimulus. Ann. Bot. 101, 641–650. doi: 10.1093/aob/mcn014
Dafni, A. (1997). The response of Amphicoma spp. (Coleoptera; Glaphyridae) beetles to red models differing in area, shape and symmetry. Israel J. Plant Sci. 45, 247–254. doi: 10.1080/07929978.1997.10676688
Dafni, A., Bernhardt, P., Schmida, A., Ivri, Y., Greenbaum, S., O’Toole, C., et al. (1990). Red bowl-shaped flowers: convergence for beetle pollination in the Mediterranean region. Israel J. Bot. 39, 81–92.
Dafni, A., Tzohari, H., Ben-Shlomo, R., Vereecken, N. J., and Ne’eman, G. (2020). Flower colour polymorphism, pollination modes, breeding system and gene flow in Anemone coronaria. Plants 9, 1–18. doi: 10.1093/oxfordjournals.aob.a084448
Dalrymple, R., Kemp, D., Flores-Moreno, H., Laffan, S., White, T., Hemmings, F., et al. (2020). Macroecological patterns in flower colour are shaped by both biotic and abiotic factors. New Phytol. 228, 1972–1985. doi: 10.1111/nph.16737
de Villemereuil, P., Gaggiotti, O., Mouterde, M., and Till-Bottraud, I. (2016). Common garden experiments in the genomic era: new perspectives and opportunities. Heredity 116, 249–254. doi: 10.1038/hdy.2015.93
Dorin, A., Shrestha, M., Herrmann, M., Burd, M., and Dyer, S. G. (2020). Automated calculation of spectral-reflectance marker-points to enable analysis of plant colour-signalling to pollinators. MethodsX 7:100827. doi: 10.1016/j.mex.2020.100827
Dyer, A. G., Boyd-Gerny, S., McLoughlin, S., Rosa, M. G. P., Simonov, V., and Wong, B. B. (2012). Parallel evolution of angiosperm colour signals: common evolutionary pressures linked to hymenopteran vision. Proc. R. Soc. B 279, 3606–3615. doi: 10.1098/rspb.2012.0827
Edh, K., Widén, B., and Ceplitis, A. (2007). Nuclear and chloroplast microsatellites reveal extreme population differentiation and limited gene flow in the Aegean endemic Brassica cretica (Brassicaceae). Mol. Ecol. 16, 4972–4983. doi: 10.1111/j.1365-294x.2007.03585.x
Fenster, C. B., Scott Armbruster, W., Wilson, P., Dudash, M. R., and Thomson, J. D. (2004). Pollination syndromes and floral specialization. Ann. Rev. Ecol. Evol. Syst. 35, 375–403.
Fey, M. (2010). Soils of South Africa. Their distribution, properties, classification, genesis, use and environmental significance. Cape Town: Cambridge University Press.
Goldblatt, P., and Manning, J. C. (2011). Hopliine beetles (Scarabaeidae: Rutelinae: Hopliini), specialized pollinators of the southern African flora. Curtis’s Bot. Magazine 28, 238–259. doi: 10.1111/j.1467-8748.2011.01752.x
Hannan, G. L. (1981). Flower color polymorphism and pollination biology of Platystemon californicus Benth. (Papaveraceae). Am. J. Bot. 68, 233–243. doi: 10.1002/j.1537-2197.1981.tb12383.x
Hargreaves, A. L., Harder, L. D., and Johnson, S. D. (2010). Native pollen thieves reduce the reproductive success of a hermaphroditic plant, Aloe maculata. Ecology 91, 1693–1703. doi: 10.1890/09-0792.1
Hepburn, H. R., and Radloff, S. E. (1995). First approximation to a phenology of the honeybees (Apis mellifera) and flora of Africa. Oecologia 101, 265–273. doi: 10.1007/bf00328811
Hijmans, R. J., Cameron, E. E., Parra, J. L., Jones, P. G., and Jarvis, A. (2005). Very high resolution interpolated climate surfaces for global land areAS. Int. J. Climatol. 25, 1965–1978. doi: 10.1002/joc.1276
Hoballah, M. E., Gubitz, T., Stuurman, J., Broger, L., Barone, M., Mandel, T., et al. (2007). Single gene–mediated shift in pollinator attraction in Petunia. Plant Cell 19, 779–790. doi: 10.1105/tpc.106.048694
Hopkins, R., and Rausher, M. D. (2012). Pollinator-mediated selection on flower color allele drives reinforcement. Science 335, 1090–1092. doi: 10.1126/science.1215198
Horovitz, A. (1976). Edaphic factors and flower colour distribution in the Anemoneae (Ranunculaceae). Plant Syst. Evol. 126, 239–242. doi: 10.1007/bf00983363
Johnson, I. M., Edwards, T. J., and Condy, G. (2005). Gerbera aurantiaca. Flowering Plants of Africa 59, 134–139.
Johnson, S. D. (2006). “Pollinator-driven speciation in plants,” in Ecology and evolution of flowers, ed. L. D. B. Harder (Oxford: Oxford University Press), 295–306.
Johnson, S. D., and Andersson, S. (2002). A simple field method for manipulating ultraviolet reflectance of flowers. Can. J. Bot. 80, 1325–1328. doi: 10.1139/b02-116
Johnson, S. D., Collin, C. L., Wissman, H. J., Halvarsson, E., and Agren, J. (2004). Factors contributing to variation in seed production among remnant populations of the endangered daisy Gerbera aurantiaca. Biotropica 36, 148–155. doi: 10.1646/q1569
Johnson, S. D., Harris, L. F., and Procheş, Ş. (2009). Pollination and breeding systems of selected wildflowers in a southern African grassland community. South Afr. J. Bot. 75, 630–645. doi: 10.1016/j.sajb.2009.07.011
Johnson, S. D., and Midgley, J. J. (2001). Pollination by monkey beetles (Scarabaeidae: Hopliini): do colour and dark centres of flowers influence alighting behaviour? Environ. Entomol. 30, 861–866. doi: 10.1603/0046-225x-30.5.861
Johnson, S. D., von Witt, C. G., and Anderson, B. (2020). Floral color variation in Drosera cistiflora is associated with switches in beetle pollinator assemblages. Front. Plant Sci. 11:606259. doi: 10.3389/fpls.2020.606259
King, C., Ballantyne, G., and Willmer, P. (2013). Why flower visitation is a poor proxy for pollination: measuring single-visit pollen deposition, with implications for pollination networks and conservation. Methods Ecol. Evol. 4, 811–818. doi: 10.1111/2041-210x.12074
Koski, M. H., and Ashman, T.-L. (2016). Macroevolutionary patterns of ultraviolet floral pigmentation explained by geography and associated bioclimatic factors. New Phytol. 211, 708–718. doi: 10.1111/nph.13921
Lebhardt, F., and Desplan, C. (2017). Retinal perception and ecological significance of color vision in insects. Curr. Opin. Insect Sci. 2017:24.
Leong, J. M., and Thorp, R. W. (1999). Colour-coded sampling: the pan trap colour preferences of oligolectic and nonoligolectic bees associated with a vernal pool plant. Ecol. Entomol. 24, 329–335. doi: 10.1046/j.1365-2311.1999.00196.x
Lunau, K., Papiorek, S., Eltz, T., and Sazima, M. (2011). Avoidance of achromatic colours by bees provides a private niche for hummingbirds. J. Exper. Biol. 214, 1607–1612. doi: 10.1242/jeb.052688
Maechler, M. (2016). diptest: Hartigan’s Dip Test Statistic for Unimodality. R package version 0.75-7.
Manson, A., and Roberts, V. (2000). Analytical methods used by the soil fertility and analytical services section. KwaZulu-Natal: Dept Agriculture & Rural Development.
Martínez-Harms, J., Vorobyev, M., Schorn, J., Shmida, A., Keasar, T., Homberg, U., et al. (2012). Evidence of red sensitive photoreceptors in Pygopleurus israelitus (Glaphyridae: Coleoptera) and its implications for beetle pollination in the southeast Mediterranean. J. Comp. Physiol. A Neuroethol. Sens. Neural. Behav. Physiol. 198, 451–463. doi: 10.1007/s00359-012-0722-5
Mayer, C., Soka, G., and Picker, M. (2006). The importance of monkey beetle (Scarabaeidae: Hopliini) pollination for Aizoaceae and Asteraceae in grazed and ungrazed areas at Paulshoek, Succulent Karoo, South Africa. J. Insect Conserv. 10, 323–333. doi: 10.1007/s10841-006-9006-0
Menzel, R., and Shmida, A. (1993). The ecology of flower colours and the natural colour vision of insect pollinators: The Israeli flora as a study case. Biol. Rev. 68, 81–120. doi: 10.1111/j.1469-185x.1993.tb00732.x
Mogford, D. J. (1974). Flower colour polymorphism in Cirsium palustre. 2. Pollination. Heredity 33, 257–263. doi: 10.1038/hdy.1974.91
Newman, E., Anderson, B., and Johnson, S. D. (2012). Flower colour adaptation in a mimetic orchid. Proc. R. Soc. Lond. B 279, 2309–2313. doi: 10.1098/rspb.2011.2375
Paine, K. C., White, T. E., and Whitney, K. D. (2019). Intraspecific floral color variation as perceived by pollinators and non-pollinators: evidence for pollinator-imposed constraints? Evol. Ecol. 33, 461–479. doi: 10.1007/s10682-019-09991-2
Peitsch, D., Fietz, A., Hertel, H., de Souza, J., Ventura, D. F., and Menzel, R. (1992). The spectral input systems of hymenopteran insects and their receptor-based colour vision. J. Comp. Physiol. A 170, 23–40. doi: 10.1007/bf00190398
Picker, M., and Midgley, J. J. (1996). Pollination by monkey beetles (Coleoptera: Scarabaeidae: Hopliini): flower and colour preferences. Afr. Entomol. 4, 7–14.
Raimondo, D., Von Staden, L., Foden, W., Victor, J. E., Helme, N. A., Turner, R. C., et al. (2009). Red list of South African plants 2009. Pretoria: South African National Biodiversity Institute.
Raine, N. E., and Chittka, L. (2007). The adaptive significance of sensory bias in a foraging context: floral colour preferences in the bumblebee Bombus terrestris. PLoS One 2:e556. doi: 10.1371/journal.pone.0000556
Rajakaruna, N., and Bohm, B. (1999). The edaphic factor and patterns of variation in Lasthenia californica (Asteraceae). Am. J. Bot. 86, 1576–1596. doi: 10.2307/2656795
Rauscher, B. J. (2008). Evolutionary transitions in flower color. Int. J. Plant Sci. 169, 7–21. doi: 10.1086/523358
Renoult, J. P., Blüthgen, N., Binkenstein, J. N. C., Weiner, M., Werner, M., and Schaefer, H. M. (2014). The relative importance of color signaling for plant generalization in pollination networks. Oikos 124, 347–354. doi: 10.1111/oik.01361
Reverté, S., Retana, J., Gómez, J. M., and Bosch, J. (2016). Pollinators show flower colour preferences but flowers with similar colours do not attract similar pollinators. Ann. Bot. 118, 249–257. doi: 10.1093/aob/mcw103
Santamaría, L., and Rodríguez-Gironés, M. A. (2015). Are flowers red in teeth and claw? Exploitation barriers and the antagonist nature of mutualisms. Evol. Ecol. 29, 311–322. doi: 10.1007/s10682-015-9757-8
Sapir, Y., Gallagher, M., and Senden, E. (2021). What maintains flower colour variation within populations? Trends Ecol. Evol. 36, 507–519. doi: 10.1016/j.tree.2021.01.011
Schemske, D. W., and Bierzychudek, P. (2001). Perspective: Evolution of flower color in the desert annual Linanthus parryae: Wright revisited. Evolution 55, 1269–1281. doi: 10.1554/0014-3820(2001)055[1269:peofci]2.0.co;2
Schemske, D. W., and Bierzychudek, P. (2007). Spatial differentiation for flower colour in the desert annual Linanthus parryae: was wright right? Evolution 61, 2528–2543. doi: 10.1111/j.1558-5646.2007.00219.x
Schiestl, F. P., and Johnson, S. D. (2013). Pollinator-mediated evolution of floral signals. Trends Ecol. Evol. 28, 307–315. doi: 10.1016/j.tree.2013.01.019
Scrucca, L., Fop, M., Murphy, T. B., and Raftery, A. E. (2016). mclust 5: Clustering, classification and density estimation using gaussian finite mixture models. R J. 8, 289–317. doi: 10.32614/rj-2016-021
Shrestha, M., Garcia, J. E., Chua, J. H. J., Howard, S. H., Tscheulin, T., Dorin, A., et al. (2019). Fluorescent pan traps affect the capture rate of insect orders in different ways. Insects 10:40. doi: 10.3390/insects10020040
Smith, D. S., Ané, C., and Baum, D. A. (2008). The role of pollinator shifts in the floral diversification of Iochroma (Solanaceae). Evolution 62, 793–806. doi: 10.1111/j.1558-5646.2008.00327.x
Stanley, D. A., Msweli, S. M., and Johnson, S. D. (2020). Native honeybees as flower visitors and pollinators in wild plant communities in a biodiversity hotspot. Ecosphere 11, 1–12.
Stebbins, G. L. (1970). Adaptive radiation of reproductive characteristics in angiosperms, I: Pollination mechanisms. Ann. Rev. Ecol. Syst. 1, 307–326. doi: 10.1146/annurev.es.01.110170.001515
Strauss, S. Y., and Whittall, J. B. (2006). “Non-pollinator agents of selection on floral traits,” in Ecology and Evolution of Flowers, ed. L. D. B. Harder (New York, NY: Oxford University Press).
Streinzer, M., Roth, N., Paulus, H. F., and Spaethe, J. (2019). Color preference and spatial distribution of glaphyrid beetles suggest a key role in the maintenance of the color polymorphism in the peacock anemone (Anemone pavonina, Ranunculaceae) in Northern Greece. J. Compar. Physiol. 205, 735–743. doi: 10.1007/s00359-019-01360-2
Tripp, E. A., and Manos, P. S. (2008). Is floral specialization an evolutionary dead-end? Pollination system transitions in Ruellia (Acanthaceae). Evolution 62, 1712–1737. doi: 10.1111/j.1558-5646.2008.00398.x
Tyrach, A., and Horn, W. (1997). Inheritance of flower colour and flavonoid pigments in Gerbera. Plant Breed. 116, 377–381. doi: 10.1111/j.1439-0523.1997.tb01015.x
Vaidya, P., McDurmon, A., Mattoon, E., Keefe, M., Carley, L., Lee, C., et al. (2018). Ecological causes and consequences of flower color polymorphism in a self-pollinating plant (Boechera stricta). New Phytol. 218, 380–392. doi: 10.1111/nph.14998
Valadon, L., and Mummery, R. (1967). Carotenoids of certain Compositae flowers. Phytochemistry 6, 983–988. doi: 10.1016/s0031-9422(00)86050-1
Van Kleunen, M., Nanni, I., Donaldson, J. S., and Manning, J. C. (2007). The role of beetle marks and flower colour on visitation by monkey beetles (Hopliini) in the greater Cape floral region, South Africa. Ann. Bot. 100, 1483–1489. doi: 10.1093/aob/mcm256
Wang, H., Talavera, M., Min, Y., Flaven, E., and Imbert, E. (2016). Neutral processes contribute to patterns of spatial variation for flower colour in the Mediterranean Iris lutescens (Iridaceae). Ann. Bot. 117:mcw036.
Whitehead, M. R., Gaskett, A. C., and Johnson, S. D. (2018). Floral community predicts pollinators’ color preference: implications for Batesian floral mimicry. Behav. Ecol. 30, 213–222. doi: 10.1093/beheco/ary138
Keywords: common garden, pollinator color preference, abiotic factors, beetle pollination, flower color polymorphism, honeybees
Citation: Johnson IM, Edwards TJ and Johnson SD (2021) Geographical Variation in Flower Color in the Grassland Daisy Gerbera aurantiaca: Testing for Associations With Pollinators and Abiotic Factors. Front. Ecol. Evol. 9:676520. doi: 10.3389/fevo.2021.676520
Received: 05 March 2021; Accepted: 14 May 2021;
Published: 28 June 2021.
Edited by:
Casper J. Van Der Kooi, University of Groningen, NetherlandsReviewed by:
Kelsey Jaye Ruth Paularena Byers, John Innes Centre, United KingdomMontserrat Arista, Seville University, Spain
Yuval Sapir, Tel Aviv University, Israel
Copyright © 2021 Johnson, Edwards and Johnson. This is an open-access article distributed under the terms of the Creative Commons Attribution License (CC BY). The use, distribution or reproduction in other forums is permitted, provided the original author(s) and the copyright owner(s) are credited and that the original publication in this journal is cited, in accordance with accepted academic practice. No use, distribution or reproduction is permitted which does not comply with these terms.
*Correspondence: Isabel M. Johnson, isabelmarionjohnson@gmail.com