Phylogeny and Biogeography of Carnivorous Plant Family Nepenthaceae With Reference to the Indian Pitcher Plant Nepenthes Khasiana Reveals an Indian Subcontinent Origin of Nepenthes Colonization in South East Asia During the Miocene Epoch
 Devendra K. Biswal
 Manish Debnath
 Ruchishree Konhar
 Sureni Yanthan2
  Pramod Tandon
- 1Bioinformatics Centre, North-Eastern Hill University, Shillong, India
- 2Department of Botany, North-Eastern Hill University, Shillong, India
- 3Biotech Park, Lucknow, India
Carnivorous plants popularly known as green predators have long fascinated scientists and general public alike owing to their fascinating trapping mechanisms. Botanical carnivory has evolved independently in five angiosperm orders. In spite of these independent origins, a remarkable convergence of morphological and physiological mechanisms is observed amongst carnivorous plants when it comes to prey capture, assimilation and digestion of animal proteins. The family Nepenthaceae, a monotypic family of the order Caryophyllales exhibits the phenomenon of convergence in morphological traits which makes it difficult to address phylogenetic issues. Using comparative analysis of molecular markers from the nuclear, mitochondrial and plastid DNA the monophyly of the Nepenthaceae family is tested. Sequences from the Indian Nepenthes khasiana, Drosera peltata, and Drosera burmannii from the Northeastern state of Meghalaya representing the two important carnivorous families in the order Caryophyllales were determined and analyzed using Bayesian and Maximum Likelihood methods. This study examines a genus level analysis by integrating different molecular matrices to existing fossil data on carnivorous plants in a RelTime tree environment for assessing divergence times of the extant Nepenthes species with a focus on its evolutionary origin. Our study has enabled age estimations as well as ancestral area reconstruction to illuminate Nepenthaceae phylogeny and biogeographic history. Divergence time estimates revealed that N. khasiana has an intermediary position between some vestige Western Nepenthes outliers and rest of the taxa by sharing some of the ancient derived traits. Our molecular data speculates Nepenthes evolution to have occurred in the Northern Tethys from the European Eocene (held by fossil pollen records) and a Gondwanaland origin with separation of the Indian plate from Madagascar. Bio-molecular marker data hints at diversification of the family Nepenthaceae from its sister clade Ancistrocladaceae-Dioncophyllaceae in the Early Eocene. These three families had a monophyletic origin of botanical carnivory by getting diversified from Droseraceae in the Late Cretaceous. Colonization of Nepenthes species occurred in South East Asia from an ancient Indian stock (N. khasiana) during 8.16–15 Mya.
Introduction
Often being regarded as botanical peculiarities, carnivorous plants are excellent model systems for understanding a myriad of ecological and evolutionary questions pertaining to emergence of botanical carnivory. The advent of botanical carnivory in these plants is an exciting area of research and unlike other angiosperms, carnivorous plants, do not have any single common ancestor, which is, otherwise, an usual case in an ecologically defined group of organisms. Conversely, botanical carnivory arose in four major angiospermic lineages and in five different orders: Poales, Caryophyllales, Oxalidales, Ericales, and Lamiales (Cronquist, 1988). Majority of these carnivorous plant species are found in Caryophyllales and Lamiales. Despite having multiple independent origins, the carnivorous plants share remarkable semblance in both morphological and physiological features across different lineages of carnivorous taxa (Ellison and Gotelli, 2001, 2009; Ellison et al., 2003).
It was Charles Darwin who paved the way for modern research on botanical carnivory. He applied homology concepts to explain evolutionary and functional convergence across unrelated carnivorous plant taxa and determined their assimilatory power to digest animal proteins for supplementing the requisite nutrition uptake (Ellison and Gotelli, 2009). Variations in the parameters that account for the morphological features associated with capture of animals and assimilation of animal proteins characterize a diversity of specialized forms viz. fly paper, pitcher traps, snap traps and suctioning bladders. Based on these criteria and molecular phylogenetic studies, nearly 600 insectivorous plant species are presently recognized in 12 families and 5 orders of flowering plants. Thus, carnivorous plants provide an opportunity to explore and quantify macro evolutionary patterns and processes across different angiospermic lineages (Albert et al., 1992).
Nepenthaceae, a monotypic family in the order Caryophyllales comprising the genus Nepenthes with approximately 120 species and characterized by their hallmark modified leaf pitfall traps are scattered throughout the Old World tropics. Nepenthes species are usually endemic to certain areas and have a very restricted distribution in hot and humid lowland areas. Pitcher plants exhibit high variation within species and population, thereby, rendering inadequacy of characters from the vegetative part for use in taxonomy and species delimitation (Jebb and Cheek, 1997; Cheek and Jebb, 2001).
Nepenthes khasiana Hook. f. is the only native Indian species amongst insectivorous pitcher plants, which is endemic to Meghalaya, distributed along West and South Garo Hills, West and East Khasi Hills and Jaintia Hills of Meghalaya (Mao and Kharbuli, 2002). Probably it is the only species of the genus Nepenthes occurring naturally outside the tropics (Verma et al., 2014). The natives of Meghalaya have a long association with this plant. The local Khasi people call it “Tiew-rakot” meaning “demon-flower” or “devouring plant.” N. khasiana acts as an important ethno-medicinal plant. Locals of Khasi and Jaintia hills use fluid of the unopened pitcher in treating various skin diseases. Other treatment includes cholera, stomach troubles, diabetes, urinary troubles and blockages (Kumar et al., 1980; Kharkongor and Joseph, 1981). Due to its unique carnivorous and attractive pitchers N. khasiana shows a high economic value and has been classified as “Endangered” in the Appendix-I of Convention on International Trade in Endangered Species of Wild Fauna and Flora (CITES) and Negative List of Exports of the Government of India (Ziemer, 2010).
Different hypotheses have been put forward to explain Nepenthes disjunct distribution patterns. Danser (1928) interpreted Nepenthes to be an ancient Gondwanan element having a southern hemisphere origin. Also known as the out-of-Africa hypothesis, Nepenthes originated in the mainland of Africa when it was separated from the Indian plate and reached Asia with a Gondwanian break-up (separation of India from Madagascar) in the late Cretaceous (65 MYA). The Indian sub-continent further drifted northwards during the Tertiary and so did the species belonging to Nepenthes, leaving behind a few taxa in Madagascar and the Seychelles. In the process, the Malay Archipelago was occupied and colonized. Contrary to this view, Raven and Axelrod (1974) proposed that Nepenthes evolved in the Indo-Malayan Archipelago central to the present day diversity and probably the center of origin. This hypothesis relied on migration via long-distance dispersal (seed dispersal via easterly winds and Indian ocean currents) but suffered setbacks delimited by the dioecious nature of Nepenthes that limits migration. Krutzsch (1985, 1988) postulated on the basis of fossil pollens from the European Eocene, accounting Nepenthes to be an element of the Tethys (northern humid evergreen flora). Nepenthes spread to Southeast Asia from the Northern Tethyan and the European remnants died out in the middle Miocene due to adverse climatic changes. Meimberg et al. (2001) undertook a molecular and cladistic approach for studying the family Nepenthaceae that explained the disappearance of its prototypes, migration process and gradual diversification of the genus Nepenthes on the islands of Borneo and Sumatra, Sulawesi and New Guinea, finally resulting in the recent disjunct distribution of Nepenthes.
These competing biogeographic hypotheses can be explained in more detail with an advanced molecular approach and usage of current evolutionary biology tools in unraveling the phylogenetic relationships within the family Nepenthaceae. Though previous studies by Meimberg et al. (2001, 2006) shed some light on this monotypic family in the order Caryophyllales, not much work has been done with modern day computational tools to validate their findings and previous hypotheses. In line with these various studies, the present work was aimed at reconstructing the phylogenetic position and biogeographic patterns of Nepenthaceae family by representing the only species Nepenthes khasiana, endemic to Meghalaya (North-East India) based on molecular phylogenetic approach utilizing nucleotide sequence data from rDNA, cpDNA, and mtDNA. Ours is the first study to include concatenated matrices of different markers to estimate molecular divergence times and ancestral ranges to infer the biogeographic history of this enigmatic plant clade along with RNA secondary structure tree diagrams. Results from our study may also help to explain the biogeography of other similarly distributed groups among carnivorous plant families in different orders and lineages.
Materials and Methods
Survey was made and insectivorous plants were collected from different regions of Meghalaya, according to their present availability. The collected plants include Nepenthes khasiana and two species of Drosera viz. D. burmanii and D. peltata. Table 1 shows the place of collection and GPS reading. Identification of the insectivorous plants was carried out at the Botanical Survey of India (BSI), Eastern circle, Shillong, Meghalaya. Herbariums were prepared and submitted in BSI and Department of Botany, North-Eastern Hill University, Shillong. Specimen voucher numbers (NEHU) and accession numbers (BSI) are listed in Table 2. Taxon sampling (Table 3) from all the above-mentioned plants taking suitable markers from the nuclear (ITS), chloroplast (matK, rps4, atpB, rbcL) and mitochondrial (coxI) regions were carried out. We also collected GenBank data that included all these markers from representative species belonging to the genus Nepenthes, Drosera, Aldrovanda, Ancistrocladus, Dioncophyllum, and Triphyophyllum spanning across the Order Caryophyllales and Ericales along with geographical distribution information (Table 4). Species from Roridula and Sarracenia were included for the taxon gap analysis. For Bayesian and phylogeographic studies, we included only ITS and matK sequences from the carnivorous plant families Nepenthaceae, Droseraceae, Drosophyllaceae, Dioncophyllaceae and the non-carnivorous plant family Ancistrocladaceae from previous studies.
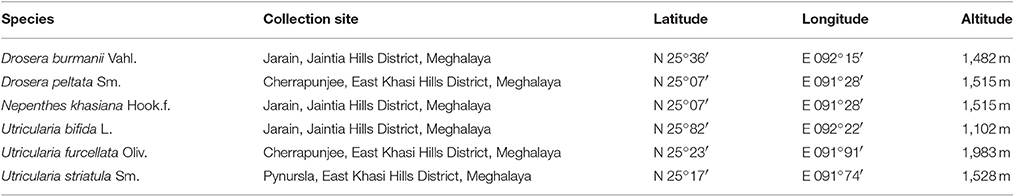
Table 1. List of insectivorous plants with place of collection and GPS reading.
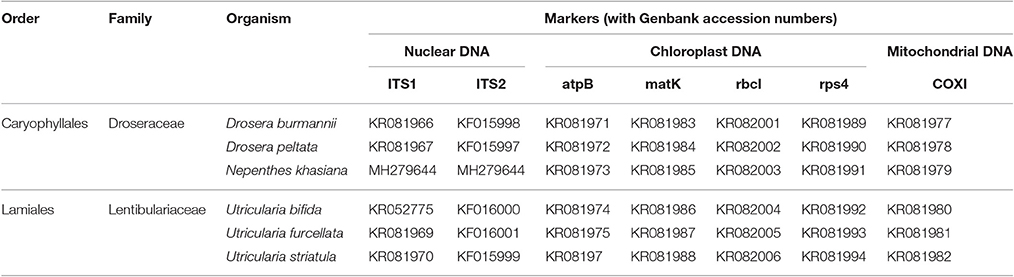
Table 2. Genbank accessions of nuclear, chloroplast and mitochondrial DNA markers for the carnivorous plant samples undertaken in the study from Meghalaya, India.
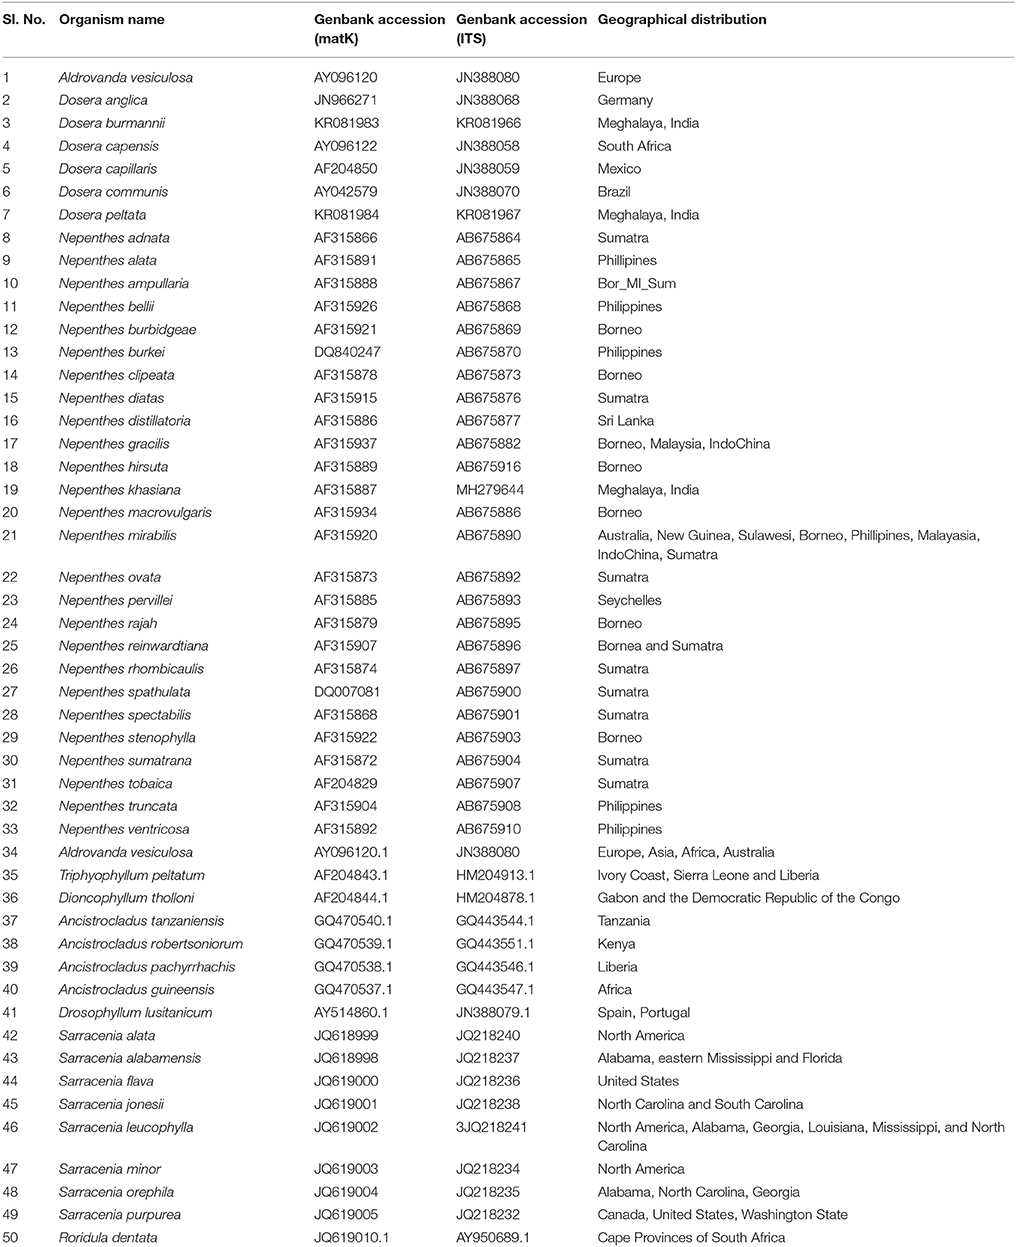
Table 3. List of matK and ITS GenBank accessions for representative species belonging to Nepenthaceae, Droseraceae, Sarraceniaceae, and Roridulaceae carnivorous plant families used in this study along with geographical distribution.
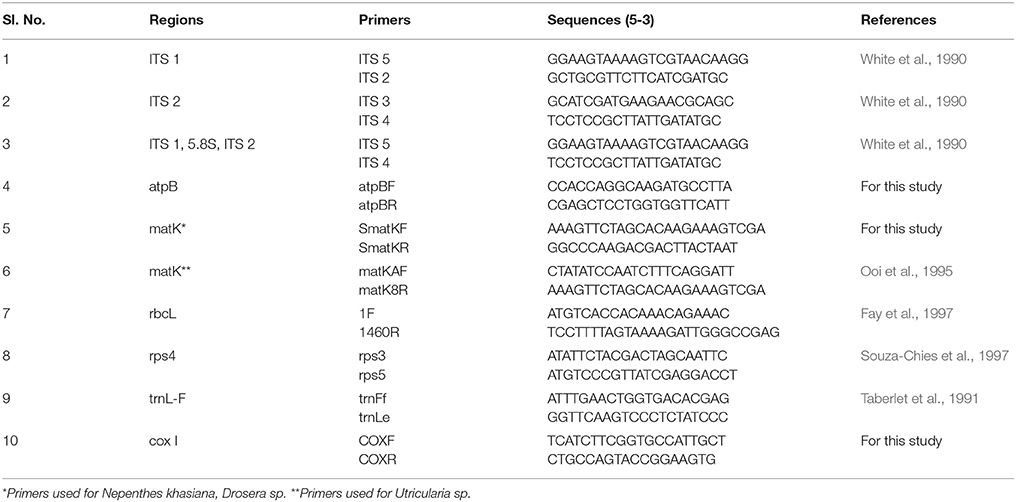
Table 4. Primer details used in this study.
Plant Material and DNA Isolation, Quality Check of Isolated DNA, Amplification and Sequencing
Young fresh leaves from the insectivorous plants (Drosera and Nepenthes species) were washed under a stream of water to remove dead insects and plant debris. The surface of the leaves was sensitized with a cotton swab to activate the release of hydrolytic enzymes. Leaves were thoroughly rinsed under running water to wash off the mucilage. Subsequently the leaves were gently blotted into a paper and then 1g of leaves were ground in liquid nitrogen. Further it was incubated for 1 h at 60° C in a 10 mL extraction buffer (1.4M sodium chloride (NaCl); 100 mM Tris hydrochloride (HCl); 20mM ehtylene diamine tetraacetic acid (EDTA); 2% cetyltrimethyl ammonium bromide, CTAB), followed by 30 min and 2 h incubation steps at 37°C with RNase A (0.4 mg) and proteinase K (0.4 mg), respectively. DNA was extracted with a ratio of phenol: chlorophorm: isoamylic acid (25: 24: 1) and chlorophorm: isoamylic acid (24: 1) and precipitated with isopropanol. The pellet was washed with ethanol (70%), dried, dissolved in 50 μL of water and cleaned with a QIAquick PCR purification kit (QIAGEN, Clifton Hill, Victoria, Australia,) and stored at −20°C. The chosen markers were subjected to PCR for amplification with desired forward and reverse primer pairs as listed in Table 4. Amplification for the target regions were carried out using the thermal cycle Applied Biosystems Gene-Amp PCR System 2700. A QIAquick PCR purification kit (QIAGEN) was used for cleansing the PCR mixtures as per the manufacturer's instructions. Sequencing was conducted at Macrogen. Inc., Korea using the primers listed in Table 4.
Phylogenetic Analysis—Maximum Likelihood
Nucleotide sequences representing Nepenthaceae, Droseraceae, Drosophyllaceae, Dioncophyllaceae and the non-carnivorous plant family Ancistrocladaceae, were first aligned using MUSCLE (Edgar, 2004) and ClustalX (Larkin et al., 2007) and then manually refined by eye. The alignments for each of the markers (mtDNA, cpDNA, and rDNA) were concatenated using MESQUITE V3.03 (Maddison and Maddison, 2016). Additionally for taxon gap analysis we included species from the carnivorous plant families Sarraceniaceae and Roridulaceae. ML bootstrap percentages were estimated from 1000 rapid bootstrapping pseudo-replicates and Bayesian posterior probabilities were obtained from BEAST (Drummond and Rambaut, 2007). The combined dataset was partitioned by locus and analyzed using the General Time Reversible (GTR) model. Rate heterogeneity was modeled by assuming that some sites are invariable and that the rate of evolution at other sites approximates a discrete gamma distribution [GTR+I+Γ]). It was pre-determined to be the best fitting model based on a likelihood ratio test for the concatenated data, as well as for each of the individual partitions. ML and Bayes trees were inferred from concatenated dataset of ITS and matK regions only, as data from other markers for the three genomic regions (mtDNA, cpDNA, rDNA) were not sufficiently available in public domains. For ITS and matK dataset the evolutionary history was inferred by using the ML method based on the Tamura-Nei model (Tamura and Nei, 1993). Sequence information for the aligned dataset pertaining to total number of sites (excluding sites with gaps / missing data), sites with alignment gaps or missing data, invariable (monomorphic) sites, G+C content, parsimony informative sites, number of haplotypes (h), haplotype gene diversity (Hd), Nucleotide diversity per site (Pi), average number of nucleotide differences (k) were computed. The bootstrap consensus tree inferred from 500 replicates (Felsenstein, 1985) is taken to represent the evolutionary history of the taxa analyzed. Branches corresponding to partitions reproduced in less than 55% bootstrap replicates were collapsed and the percentage of replicate trees in which the associated taxa clustered together in the bootstrap test (500 replicates) are shown next to the branches. Initial tree(s) for the heuristic search were obtained automatically by applying Neighbor-Join and BioNJ algorithms to a matrix of pairwise distances estimated using the Maximum Composite Likelihood (MCL) approach, and then selecting the topology with superior log likelihood value. Evolutionary analyses were conducted in MEGA 7 (Kumar et al., 2016). The ML tree was further used in divergence time analysis.
Phylogenetic Analysis—Bayesian Inference
The concatenated dataset from the previous analysis (in nexus format) was further analyzed with MrBayes v.3.1.2 (Ronquist and Huelsenbeck, 2003). Two parallel Bayesian analyses with four chains each and partitioned by DNA region were run for 50 million generations. Tree construction was carried out using general time reversible substitution model (GTR) with substitution rates estimated by MrBayes. Metropolis-Coupled Markov Chain Monte Carlo (MCMCMC) sampling was performed with two incrementally heated chains that were combinatorially run for 100,000 generations. Coalescence of substitution rate and rate model parameters were also examined. Average standard deviation of split frequencies was carried out and generations were added until the standard deviation value was below 0.01. Posterior Probabilities indicated clade support. A cladogram with the posterior probabilities for each split and a phylogram with mean branch lengths was generated and subsequently read by FigTree v1.3.1 (http://tree.bio.ed.ac.uk/software/figtree/). The node labels were color coded with a consensus 50 major rule based on percent probabilities.
TaxonGap Analysis
A visualization analysis tool, TaxonGap 2.4.1 (Slabbinck et al., 2008), was used to illustrate the sequence divergences within and between species of the candidate markers from the cp, mt and rDNA regions representing the four carnivorous plant families (Nepenthaceae, Droseraceae, Sarraceniaceae, and Roridulaceae).
Secondary Structure Tree Diagrams for Comparative Visual Display
A novel way of representing secondary structures for ease of manual inspection was carried out via “rnaplot (RNA2ndStruct)” function in Matlab R2012a with specified format values, “Tree Diagram” for ITS2 sequences representing the four carnivorous families mentioned in previous sections.
Phylogeographic Inference Using Ancestral Area Reconstruction
For biogeographic inference Bayesian Binary MCMC (BBM) and Statistical Dispersal-Vicariance Analysis (S-DIVA) methods were employed in which biogeographic reconstructions were averaged over a sample of highly probable Bayesian trees (Yu et al., 2015).
Fossil Data Calibration and Divergence Time Estimation
A Timetree was generated using the RelTime method (Tamura et al., 2012). Divergence times for all branching points in the user-supplied topology for estimating phylogenetic history and divergence times of Nepenthaceae were calculated using the Maximum Likelihood me based on the Tamura-Nei model (Tamura and Nei, 1993). We combined the rDNA (ITS) and cp (matK) datasets. We implemented a relaxed molecular clock (uncorrelated lognormal) (Drummond et al., 2006). A fossil for Sarracenia is previously reported (Li, 2005). Earlier studies on 21 fossil constraints (series of secondary age constraints) from an angiosperm-wide analysis (Bell et al., 2010; Ellison et al., 2012) have also thrown light on evolutionary age of Caryophyllales. Based on these studies and fossil data information on Droseraceae and Aldrovanda, the following constraints were applied with a normal prior distribution that spanned the full range of nodal age estimates: the most recent common ancestor (MRCA) of Droseraceae (divergence between Drosera and Aldrovanda species) was set with a minimum and maximum divergence time to 38 and 55 respectively; and the MRCA of Drosera species was set to 22-5 MYA. Drosophyllum lusitanicum species were taken as outgroup for the ML timetree.
Results and Discussion
Phylogenetic Analysis
Our aligned matK and ITS datasets included 1,564 and 979 characters, respectively. Within Caryophyllales the four different carnivorous families—Nepenthaceae, Dioncophyllaceae, Droseraceae, Drosophyllaceae and one non-carnivorous family Ancistrocladaceae are clearly rooted with monophyletic groupings with very high support (100 percent bootstrap support values; 1.0 Bayesian posterior probability) (Figure 1). A common ancestor, presumably one with flypaper traps, links the families Nepenthaceae, Ancistrocladaceae, and Dioncophyllaceae in a large clade to the family Droseraceae. The tree topology was analyzed by using the ML method based on the Tamura-Nei model. The log likelihood of the tree is (−7261.35). The tree is drawn to scale, with branch lengths measured in the number of substitutions per site. The analysis involved 41 nucleotide sequences. All positions containing gaps and missing data were eliminated. There were a total of 1,389 positions in the final dataset. The same tree was incorporated into the RelTime tree analysis (Figure 2). The ML and Bayes phylogenies were largely congruent while N. khasiana (the only native species identified in the Indian sub-continent) and N. pervillei came out to be the primitive one, as they were placed basal to the overall topology of Nepenthes species. The Bayesian tree was drawn and color-coded with percentage probability of node values (Figure 1). Corresponding to the tree topology there were basal polytomies viz. the N. distillatoria, endemic to Sri Lanka, N. pervillei from Seychelles, N. truncata from Philippines and N. ampullaria from Malayan Archipelago. A separate distinct branch is indicated by N. khasiana, endemic to North-east India (Meghalaya). Sister group to N. khasiana with all other Nepenthes taxa that are predominantly distributed on the islands of the Malay Archipelago in a range from Malaysia to New Guinea extending as Far East as northern Australia and New Caledonia can be seen (Figure 1). These internal clades represent three main evolutionary lineages, each well supported by high probability values.
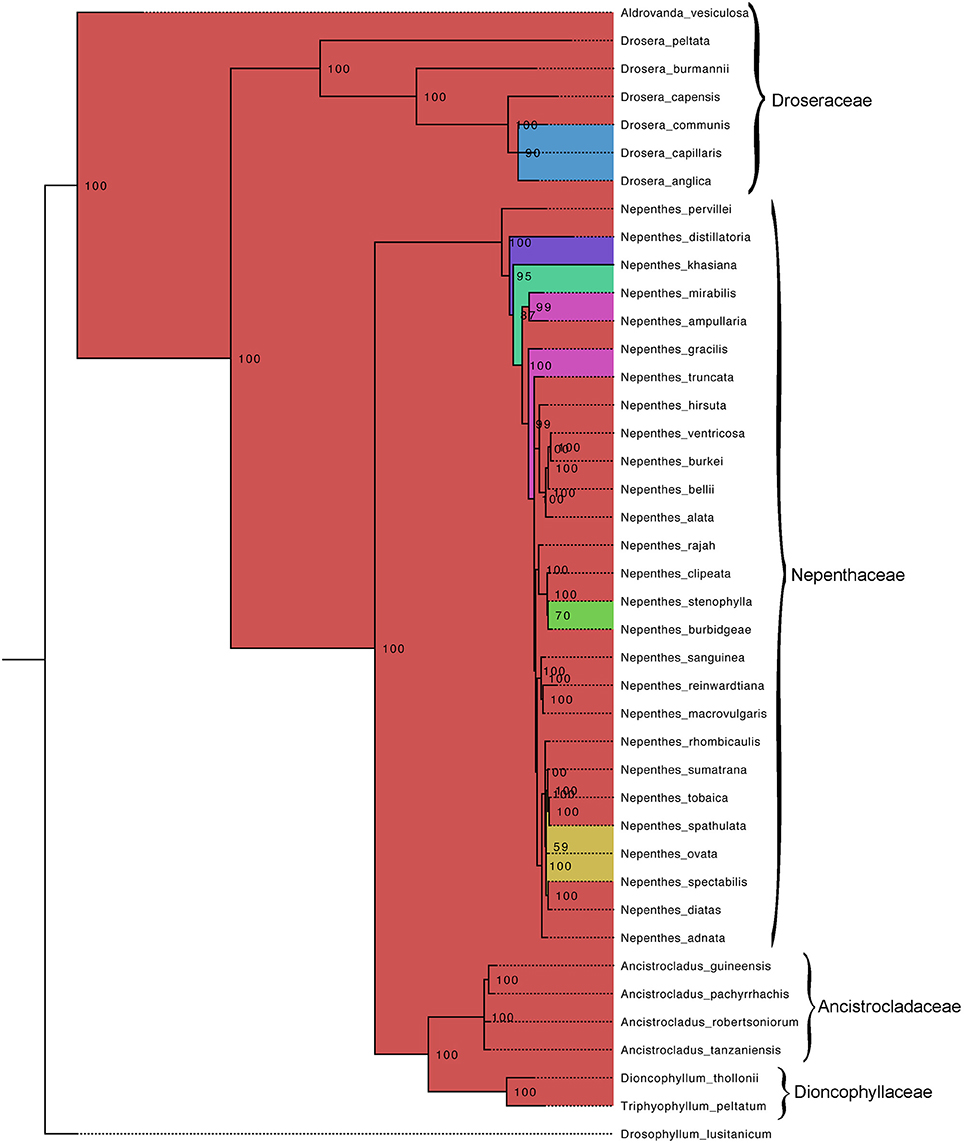
Figure 1. Bayesian phylogenies of Nepenthaceae, Droseraceae, Drosophyllaceae, Dioncophyllaceae, and Ancistrocladaceae based on concatenated plastid markers. Phylogenetic analysis are based on plastid (ITS and matK) sequence data with posterior probabilities > 0.85. Bayesian phylogeny reconstruction obtained by posterior probabilities (BPP) for the nodes in the ML tree. GTR evolutionary model was implemented in MrBayes 3.2 with four chains during 100,000 generations and trees were sampled every 100 generations.
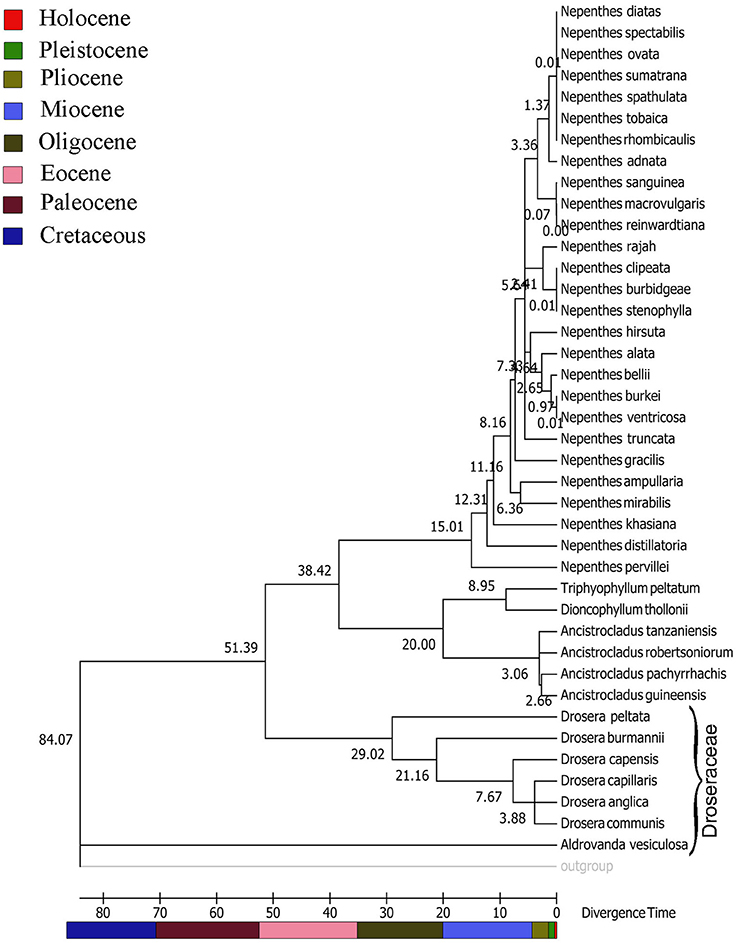
Figure 2. Rel TimeTree chronogram for the combined dataset of matK and ITS showing divergence time estimation of Nepenthaceae from Droseraceae and evolution of the extant Nepenthes species. Divergence times for all branching points in the user-supplied calibrated topology were calculated using the Maximum Likelihood method based on the Tamura-Nei model. A discrete Gamma distribution was used to model evolutionary rate differences among sites (5 categories (+G, parameter = 2.0910)). The rate variation model allowed for some sites to be evolutionarily invariable ([+I], 0.0000% sites). Numbers at nodes are median ages in million of years (MYA) with two internal calibration points Evolutionary analyses were conducted in MEGA7.
TaxonGap Analysis
Suitability of a DNA barcode marker is judged by the intra- and inter-specific sequence divergence amongst the markers chosen for study. Comparisons of the six marker candidates (ITS, matK, rbcL, atpB, rps4, and coxI) for species representing the families Nepenthaceae, Droseraceae, Sarraceniaceae, and Roridulaceae were performed. Sarracenia and Roridula species were taken as outgroups. The results are summarized in Figure 3. For each species, sequence similarity of each gene within the same species was high; therefore, the relevant intra-specific variation (shown as gray bars) was low. For the matK and ITS regions, the inter-specific variations were very similar, and are apparently higher than those for other marker regions. There was a clear gap between the maximum intra-specific variations and the minimum inter-specific variations in Nepenthes and Drosera species. From the TaxonGap analysis it emerges that ITS, matK, rbcL, and atpB are reliable markers that can be further investigated for barcode analysis with potential species discriminatory power in carnivorous group of plants. CoxI emerges to be a poor candidate when it comes to barcoding and species identification in plants.
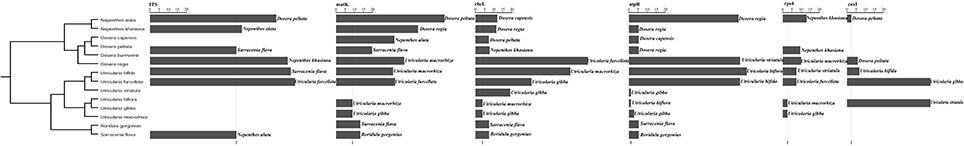
Figure 3. Comparisons of intra- and inter-specific variations among ITS, CoxI, matK, rbcL, rps4, and atpB genes of the carnivorous plant families Nepenthaceae, Droseraceae, Sarraceniaceae, and Roridulaceae. The gray and black bars represent the intra- and inter-specific variations, respectively. The thin, black lines indicate the smallest inter-specific variation. Names next to the dark bars indicate the closest species to that listed on the left.
Secondary Structure Tree Diagrams
Tree diagrams represented a rooted tree, where leaf nodes correspond to unpaired residues and internal nodes (except the root) correspond to base pairs. They exhibited the branching pattern with blue colored dots joined with each other as paired regions and red colored dots as leaves depicting unpaired regions. These diagrams gave an explicit picture of ITS2 secondary structures for a visual comparison of representative species belonging to the four carnivorous plant families (Figures 4A–C).
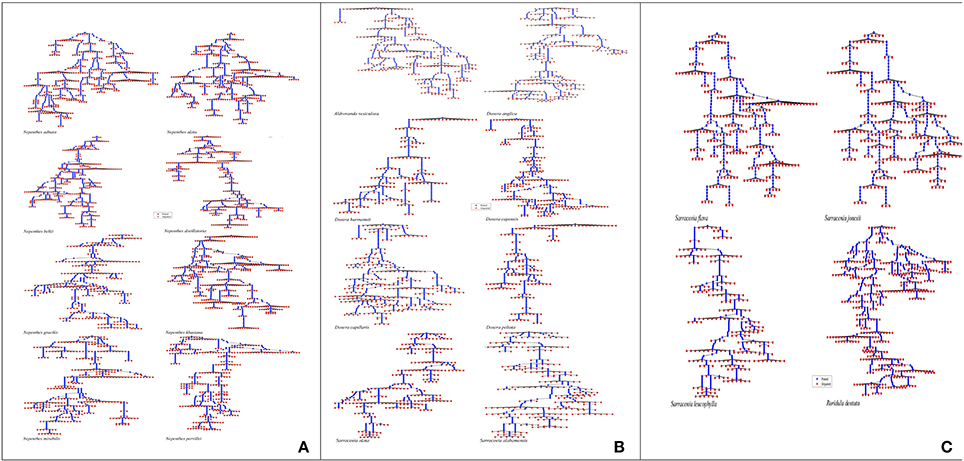
Figure 4. ITS2 secondary structure tree diagrams of species representing carnivorous plant families Nepenthaceae (A), Droseraceae (B), Sarraceniaceae and Roridulaceae (C) generated in RNA plot MATLAB environment.
Molecular Divergence Time Estimates
Our Timetree age divergence estimates (Figures 1, 2) indicate that the family Nepenthaceae diversified from its sister families Ancistrocladaceae-Dioncophyllaceae in the Early Eocene (~38.42) Million years ago (Mya). The three families Nepenthaceae, Ancistrocladaceae and Dioncophyllaceae diversified from Droseraceae in the Order Nepenthales suggesting a monophyletic origin of botanical carnivory in the Late Cretaceous (~84.07) Mya. The present day Nepenthes species diversified in the Miocene and early Miocene (15-5) Mya. Species rich Malesian clades evolved during the early Miocene (6-4) Mya (Figure 2).
Ancestral Area Reconstruction
It could be inferred from the ancestral area reconstructions that Nepenthes khasiana from Meghalaya, N. distillatoria from Srilanka and N. pervillei from Seychelles are isolated species but geographically serve as intermediate link between the western species and the Indo-Malayan taxa (Figure 5). The transitional position of N. khasiana from Northeast India with respect to its morphological features shows closer affinity to species in the Indo-Malayan taxa well supported by the sister group relationships with the subclades of Asian stem-group. Nepenthaceae probably originated in Asia and Africa with species in the crown-group widespread in the Malayan Archipelago. The most recent common ancestor of N. khasiana (Meghalaya) and N. distillatoria (Sri Lanka) was likely present in Africa. Our molecular data studies indicate colonization of Nepenthes species in South East Asia from the Indian subcontinent. The relict N. khasiana, endemic to Northeast India marks this migration to the Malay Peninsula. Subsequent processes of colonization started in the Indo-China and the Indo-Malayan Archipelago where three major lineages can be outlined. Initially the Malay Peninsula and the main land of Indo-China were probably occupied. Subsequent colonization in Sumatra from the Malay Peninsula marked a process of pompom radiation of Nepenthes species that we see today. If we assume this as the center of diversity, taxa were dispersed along the Sumatran track to Borneo where a similar process of divergence took place. Islands of the Malay Archipelago arose gradually during the Tertiary, making it much easier for the Nepenthes diversity to expand in the mainland than the islands accounting for the wide range distribution of some taxa (N. ampullaria, N. gracilis, N. mirabilis). Studies indicate spread of N. mirabilis to the Philippines, Sulawesi, Borneo, New Guinea and northern Australia especially at times of low sea level in the Quaternary (Figures 2, 5).
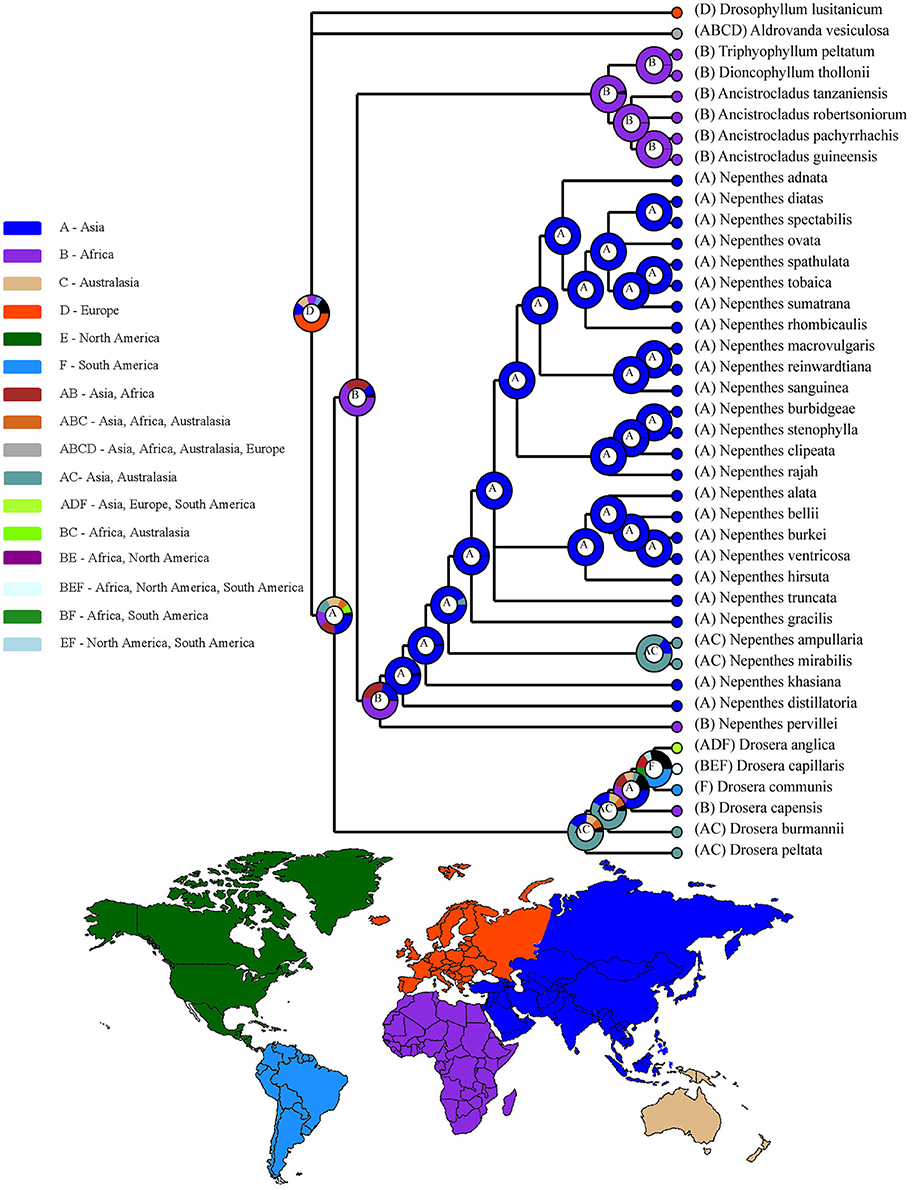
Figure 5. Ancestral area reconstruction along with distribution world map of species belonging to Nepenthaceae, Droseraceae, Drosophyllaceae, Dioncophyllaceae, and Ancistrocladaceae using RASP (S-DIVA and BBM). Alternative ancestral ranges of nodes (with frequency of occurrence) are shown in pie chart form. Bootstrap support values/Bayesian credibility values (PP) (50 % and higher) are indicated near the pie chart in the Bayesian tree. Color key to possible ancestral ranges at different nodes represent other ancestral ranges. Biogeographical regions: A, Asia; B, Africa; C, Australasia; D, Europe; E, North America; F, South America; AB, Asia-Africa; ABC, Asia-Africa-Australasia; ABCD, Asia-Africa-Australasia-Europe.
Evolution of Nepenthes and its spectacular pitchers is no less than a fairytale that has undergone a remarkable journey in the geological time scale to reach the present day diversity. Danser (1928) was probably the first one to study Nepenthes species throwing light on interrelationships of the numerous described species (summarized in Jebb and Cheek, 1997), which merits further extensive research. Molecular marker studies have confirmed a basal position of the western species (from Madagascar to Sri Lanka and Northeast India Khasi Hills), monophyly of a group of New Guinean species and of a clade containing the moderately derived species (Regiae, Borneo, Philippines, Sulawesi, New Guinea). Nepenthes colonized Southeast Asia from an ancient Indian stock and subsequently moved to Indo-China and the Malay Archipelago (Meimberg et al., 2001).
Our phylogenetic analysis of cp and nu genes is an extension of the work initiated by Meimberg et al. (2001, 2006) which lacked computational work on ancestral area reconstruction and age estimation of the monotypic family Nepenthaceae though they have discussed the biogeographic features of the Nepenthaceae family in detail. Our work corroborates most of their findings with a fully resolved phylogeny that supports the monophyletic nature of carnivorous plant families Nepenthaceae and Droseraceae in the order Caryophyllales. The biogeographic analyses reveal that the evolution of botanical carnivory in the order Nepenthales would have occurred in the Northern Tethys which is supported by fossil pollen records from the European Eocene and a Gondwanaland origin at a time when the Indian plate was alienated from Madagascar. Our estimates of divergence times within and among clades (Figure 5) also provide support for the vicariance hypothesis in previous studies explaining the biogeographic history of the family.
Conclusions
Although the question of Nepenthes origin still remains a mystery, our results congrued with the findings of Meimberg et al. (2001, 2006). The colonization of SE Asia started from the Indian subcontinent and migrated to the Malay Peninsula marked by the relict N. khasiana, which is endemic to Northeast India (Meghalaya). Three major heredities can be outlined for the Nepenthes immigrants in the Indo-China and the Indo-Malayan Archipelago and their subsequent colonization. In a first step, the Malay Peninsula and the mainland of Indo-China were occupied. Subsequently, Sumatra was colonized and Nepenthes further radiated from this center of diversity along the Sumatran track to Borneo where an analogous process of diversification took place. Another lineage migrated from the Malay Peninsula via Thailand to Vietnam and Cambodia. Our studies estimated all these activities to have occurred somewhat around 60–70 MYA during the Eocene and late Paleocene epochs, with the divergence of Ancistrocladaceae-Dioncophyllaceae-Nepenthaceae from Droseraceae in the late Cretaceous. On the evolutionary scale the divergence of Nepenthaceae into a monotypic family from Ancistrocladaceae-Dioncophyllaceae clade would have occurred during middle Eocene subsequently giving rise to the recently evolved extant Nepenthes species in the Miocene epoch.
Author Contributions
DB, PT, and SY: designed the study; DB, SY, and PT: specimen collection and taxon sampling; SY: performed the experiments; DB, MD, and RK: performed phylogenetic and bioinformatics analysis; DB and RK: wrote the paper; DB, RK and PT: reviewed, corrected, and approved the final version of the manuscript.
Funding
The research work was carried out in a DBT, Govt. of India sponsored project Bioinformatics Centre bearing sanction no. BT/BI/04/035/98. The funding authority had no role in study and design of the research work.
Conflict of Interest Statement
The authors declare that the research was conducted in the absence of any commercial or financial relationships that could be construed as a potential conflict of interest.
Acknowledgments
We acknowledge the funding from Department of Biotechnology, Govt. of India for carrying out this research work.
References
Albert, V. A., Williams, S. E., and Chase, M. W. (1992). Carnivorous plants: phylogeny and structural evolution. Science 257, 1491–1495. doi: 10.1126/science.1523408
Bell, C. D., Soltis, D. E., and Soltis, P. S. (2010). The age and diversification of the angiosperms re-revisited. Am. J. Bot. 97, 1296–1303. doi: 10.3732/ajb.0900346
Cheek, M., and Jebb, M. (2001). Flora Malesiana. Series I. Seed Plants, Vol. 15. Nepenthaceae. Leiden: Nationaal Herbarium Nederland.
Cronquist, A. (1988). The Evolution and Classification of Flowering Plants. New York, NY: New York Botanical Garden.
Danser, B. H. (1928). The Nepenthaceae of the Netherlands Indies. Contributions a l'etude de la flore des Indes Neerlandaises X. V. Bull. Jardin Bot. Buitenzorg 3, 249–435.
Drummond, A. J., Ho, S. Y. W., Phillips, M. J., and Rambaut, A. (2006). Relaxed phylogenetics and dating with confidence. PLoS Biol. 4:e88. doi: 10.1371/journal.pbio.0040088
Drummond, A. J., and Rambaut, A. (2007). BEAST: Bayesian evolutionary analysis by sampling trees. BMC Evol. Biol. 7:214. doi: 10.1186/1471-2148-7-214
Edgar, R. C. (2004). MUSCLE: a multiple sequence alignment method with reduced time and space complexity. BMC Bioinformatics 5:113. doi: 10.1186/1471-2105-5-113
Ellison, A. M., Butler, E. D., Hicks, E. J., Naczi, R. F., Calie, P. J., Bell, C. D., et al. (2012). Phylogeny and biogeography of the carnivorous plant family Sarraceniaceae. PLoS ONE 7:e39291. doi: 10.1371/journal.pone.0039291
Ellison, A. M., and Gotelli, N. J. (2001). Evolutionary ecology of carnivorous plants. Trends Ecol. Evol. 16, 623–629. doi: 10.1016/S0169-5347(01)02269-8
Ellison, A. M., and Gotelli, N. J. (2009). Energetics and the evolution of carnivorous plants–Darwin's 'most wonderful plants in the world'. J. Exp. Bot. 60, 19–42. doi: 10.1093/jxb/ern179
Ellison, A. M., Gotelli, N. J., Brewer, J. S., Cochran-Stafira, L., Kneitel, J., Miller, T. E., et al. (2003). The evolutionary ecology of carnivorous plants. Adv. Ecol. Res. 33, 1–74. doi: 10.1016/S0065-2504(03)33009-0
Fay, M. F., Cameron, K. M., Prance, G. T., Dolores Lledó, M., and Chase, M. W. (1997). Familial realtionships of Rhabdodendron (Rhabdodendraceae): plastid rbcL sequences indicate a caryophyllid placement. Kew Bull 52, 923–932. doi: 10.2307/4117819
Felsenstein, J. (1985). Confidence limits on phylogenies: an approach using the bootstrap. Evolution 39, 783–791. doi: 10.1111/j.1558-5646.1985.tb00420.x
Jebb, M., and Cheek, M. (1997). A skeletal revision of nepenthes (Nepenthaceae). Blumea-Biodiversity Evol. Biogeogr. Plants 42, 1–106.
Kharkongor, P., and Joseph, J. (1981). “Folklore medico-botany of rural Khasi and Jaintia tribes in Meghalaya,” in Glimpses of Indian Ethnobotany, ed S. K. Jain (New Delhi: Oxford; IBH), 124–136.
Krutzsch, W. (1988). Palaeogeography and historical phytogeography (palaeochorology) in the Neophyticum. Plant Syst. Evol. 162, 5–61. doi: 10.1007/BF00936909
Kumar, S., Stecher, G., and Tamura, K. (2016). MEGA7: molecular evolutionary genetics analysis version 7.0 for bigger datasets. Mol. Biol. Evol. 33, 1870–1874. doi: 10.1093/molbev/msw054
Kumar, Y. K., Haridasan, S., and Rao, R. R. (1980). Ethnobotanical notes on certain medicinal plants among some garo people around balphakram sanctury in Meghalaya. Bull. Bot. Surv. India 22, 161–165.
Larkin, M. A., Blackshields, G., Brown, N. P., Chenna, R., McGettigan, P. A., McWilliam, H., et al. (2007). Clustal, W., and Clustal X version 2.0. Bioinformatics 23, 2947–2948. doi: 10.1093/bioinformatics/btm404
Li, H. (2005). Early cretaceous sarraceniacean-like pitcher plants from China. Acta Botanica Gallica 152, 227–234. doi: 10.1080/12538078.2005.10515473
Maddison, W. P., and Maddison, D. R. (2016). Mesquite: A Modular System for Evolutionary Analysis. Version 2.75. Available online at: http://mesquiteproject.org
Mao, A. A., and Kharbuli, P. (2002). Distribution and status of Nepenthes khasiana Hook. f. a rare endemic pitcher plant of Meghalaya, India. Phytotaxonomy 2, 77–83.
Meimberg, H., Thalhammer, S., Brachmann, A., and Heubl, G. (2006). Comparative analysis of a translocated copy of the trnK intron in carnivorous family 38 Nepenthaceae. Mol. Phylogenet. Evol. 39, 478–490. doi: 10.1016/j.ympev.2005.11.023
Meimberg, H., Wistuba, A., Dittrich, P., and Heubl, G. (2001). Molecular phylogeny of Nepenthaceae based on cladistic analysis of plastid trnK intron sequence data. Plant Biol. 3, 164–175. doi: 10.1055/s-2001-12897
Ooi, K. A., Endo, Y., Yokoyama, J., and Murakami, N. (1995). Useful primer designs to amplify DNA fragments of the plastid gene matK from angiosperm plants. J. Jpn. Bot. 70, 328–331.
Raven, P. H., and Axelrod, D. I. (1974). Angiosperm biogeography and past continental movements. Ann. Miss. Bot. Gard. 61, 539–673. doi: 10.2307/2395021
Ronquist, F., and Huelsenbeck, J. P. (2003). MRBAYES 3: bayesian phylogenetic inference under mixed models. Bioinformatics 19, 1572–1574. doi: 10.1093/bioinformatics/btg180
Slabbinck, B., Dawyndt, P., Martens, M., De Vos, P., and De Baets, B. (2008). TaxonGap: a visualization tool for intra-and inter-species variation among individual biomarkers. Bioinformatics 24, 866–867. doi: 10.1093/bioinformatics/btn031
Souza-Chies, T. T., Bittar, G., Nadot, S., Carter, L., Besin, E., and Lejeune, B. (1997). Phylogenetic analysis of Iridaceae with parsimony and distance methods using the plastid gene rps4. Plant Syst. Evol. 204, 109–123. doi: 10.1007/BF00982535
Taberlet, P., Gielly, L., Pautou, G., and Bouvet, J. (1991). Universal primers for amplification of three noncoding regions of chloroplast DNA. Plant Mol. Biol. 17, 1105–1109. doi: 10.1007/BF00037152
Tamura, K., Battistuzzi, F. U., Billing-Ross, P., Murillo, O., Filipski, A., and Kumar, S. (2012). Estimating divergence times in large molecular phylogenies. Proc. Nat. Acad. Sci. U.S.A. 109, 19333–19338. doi: 10.1073/pnas.1213199109
Tamura, K., and Nei, M. (1993). Estimation of the number of nucleotide substitutions in the control region of mitochondrial DNA in humans and chimpanzees. Mol. Biol. Evol. 10, 512–526.
Verma, P. K., Schlauer, J., Rawat, K. K., and Giri, K. (2014). Status of insectivorous plants in northeast India. Carnivorous Plant Newsl. 43, 49–58.
White, T. J., Bruns, T., Lee, S., and Taylor, J. (1990). “Amplification and direct sequencing of fungal ribosomal RNA genes for phylogenetics,” in PCR Protocols: A Guide to Methods and Applications, eds M. A. Innis, D. H. Gelfand, J. J. Shinsky, and T. J. White (London: Academic Press), 315–322.
Keywords: Nepenthes khasiana, ancestral area reconstruction, tree diagrams, taxon gap, biogeography
Citation: Biswal DK, Debnath M, Konhar R, Yanthan S and Tandon P (2018) Phylogeny and Biogeography of Carnivorous Plant Family Nepenthaceae With Reference to the Indian Pitcher Plant Nepenthes Khasiana Reveals an Indian Subcontinent Origin of Nepenthes Colonization in South East Asia During the Miocene Epoch. Front. Ecol. Evol. 6:108. doi: 10.3389/fevo.2018.00108
Received: 05 July 2017; Accepted: 04 July 2018;
Published: 02 August 2018.
Edited by:
Badri Padhukasahasram, Illumina, United StatesReviewed by:
José Arturo de Nova Vázquez, Universidad Autónoma de San Luis Potosí, MexicoMarcelo R. S. Briones, Federal University of São Paulo, Brazil
Copyright © 2018 Biswal, Debnath, Konhar, Yanthan and Tandon. This is an open-access article distributed under the terms of the Creative Commons Attribution License (CC BY). The use, distribution or reproduction in other forums is permitted, provided the original author(s) and the copyright owner(s) are credited and that the original publication in this journal is cited, in accordance with accepted academic practice. No use, distribution or reproduction is permitted which does not comply with these terms.
*Correspondence: Devendra K. Biswal, devbioinfo@gmail.com
Pramod Tandon, profptandon@gmail.com