Mapping biodiversity with DNA: sectors analyzed so far
Monday, January 28th, 2008
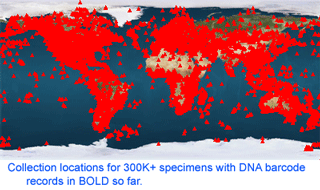 As of 28 january 2008, there are 341,825 barcode records from 35,798 species in the Barcode of Life Database (BOLD) www.barcodinglife.org . What sectors of biodiversity have been analyzed so far? Here I follow the daily updated pages publicly available through “DNA Taxonomy Browser” link on BOLD home page. One can click downward through the taxonomic hierarchy from phyla to species, with a cogent summary at each level showing barcode records so far, contributing institutions and countries, and collection locations. The summary map shows remarkably good coverage of most terrestrial and coastal regions, and representation of nearly all countries. The open oceans are sparsely sampled so far, and remain an exciting terra incognita for biological exploration, including with DNA barcoding. The global totals of 342K records/36K species work out to about 10 barcodes/species, and the average number of barcodes/species is similar at least down to the class level for most groups I looked at, suggesting a target of roughly 10 specimens per species is being achieved.
The densest records so far are from Phylum Arthropoda (244,297), particularly insects (230,838), and of these mostly Lepidoptera (moths and butterflies) (169,145); and Phylum Chordata (74,720), particularly mammals (27,186), fish (26,752), and birds (12,770). There is broad sampling of other groups, including records from 376 animal orders in 80 classes representing 25 phyla. In addition, there are a few thousand records from fungi (3 phyla, 8 classes) plants (mostly red algae; 3 phyla, 8 classes), and protists (7 phyla, 11 classes), the latter of which DNA barcoding is likely to reveal as an enormous, deeply diverse group.
The first paper proposing DNA barcoding was published in February 2003. The results displayed today on BOLD Taxonomy Browser demonstrate amazing progress in a short time, thanks to the inspiration and hard work of many!
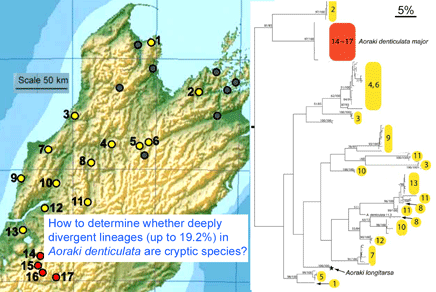
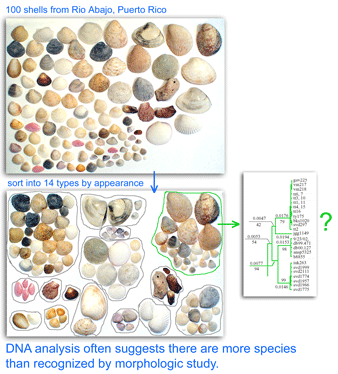 One result is that it has been difficult to compare patterns of diversification between different branches in the Tree. One might ask, how finely and how evenly divided is biodiversity? Are the differences among and within mosquito species (3,400 species), for example, similar to the differences among and within fruit flies (6,200 species) or birds (10,000 species)? Broad application of DNA analysis is beginning to provide some insights. To enable these sorts of comparisons, a standardized locus is needed, as unique genes can solve local branching patterns, but do not allow easy comparisons between branches.
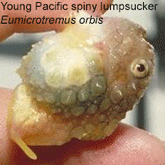 Lumpsuckers are globular, scaleless marine fish with bony tubercles on head and body, and a ventral sucking disc, derived from specialized pelvic fins, which allows them to adhere to environmental substrates. The genus Eumicrotremus comprises 16 species distributed in the Arctic and northern Atlantic and Pacific oceans; the commonest and most widespread in the north Atlantic is the Spiny lumpsucker E. spinosus, which was first described by Fabricius in 1776. A new subspecies E. s. eggvinii was described in 1956, based on a single specimen, and this was later elevated to species level “on the basis of wrinkled skin, numerous dermal warts and a large sucking disk, in addition to the low number of bony tubercles.”
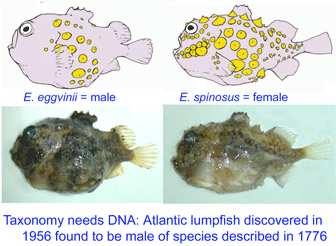 In August 2007