
Ahh yes, December – time for eggnog, pepernoten, and Strava’s year end report. But yes, of course, I’ll once again point out that the report technically only covers data from Oct 1st, 2018 to Sept 30th, 2019. I think for Christmas this year I’m going to send Strava a calendar to explain how years work. Probably this one, as I can’t find anything more perfect. Oh snap, except this one – it’s amazing! Wait, there’s a calendar of sloths? Still, despite Strava apparently having a imerologiophobia, the report is full of actual sports tech information – including devices, bikes, and shoes.
(I really will send Strava a calendar, further suggestions welcome in the comments.)
And in fact, I think this may be one of Strava’s best reports yet. Up till now they’ve always held back on some tidbits of data. For example – they never talked about how specific brands fared, always hesitant to upset the partnership apple cart. But maybe now they’re realizing that the people they need not upset are their users. Happy users will give more revenue.
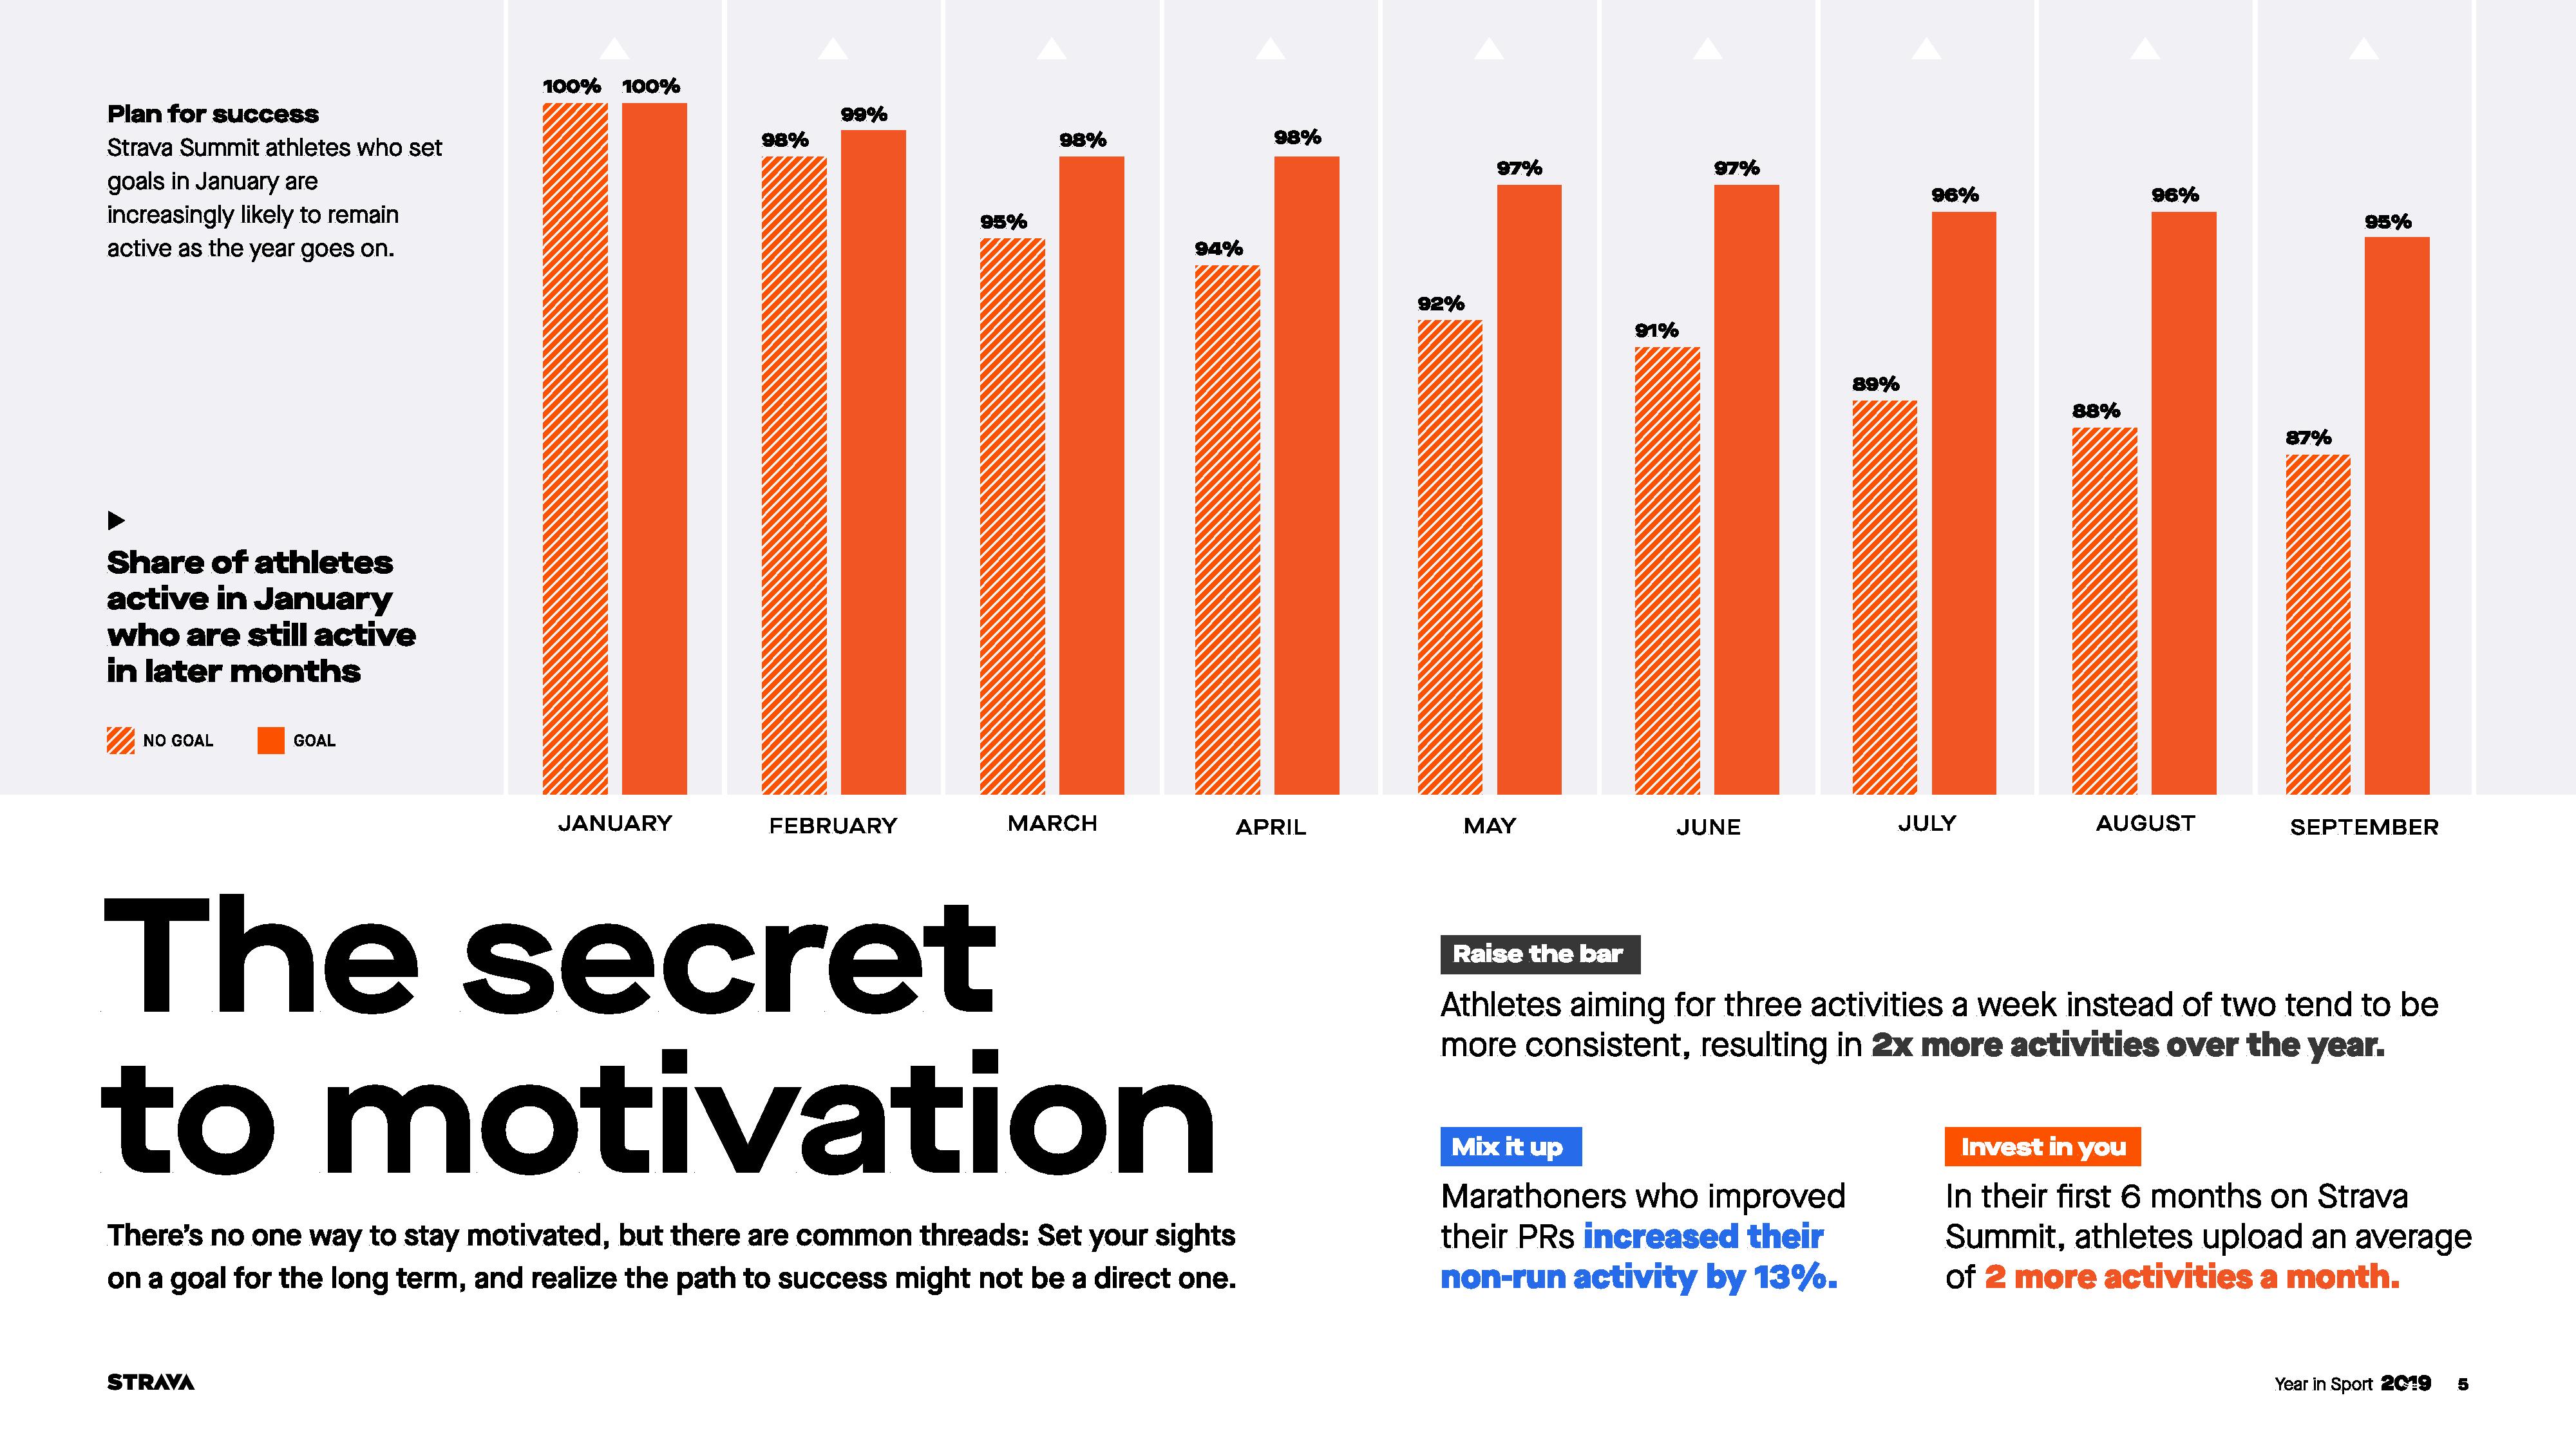
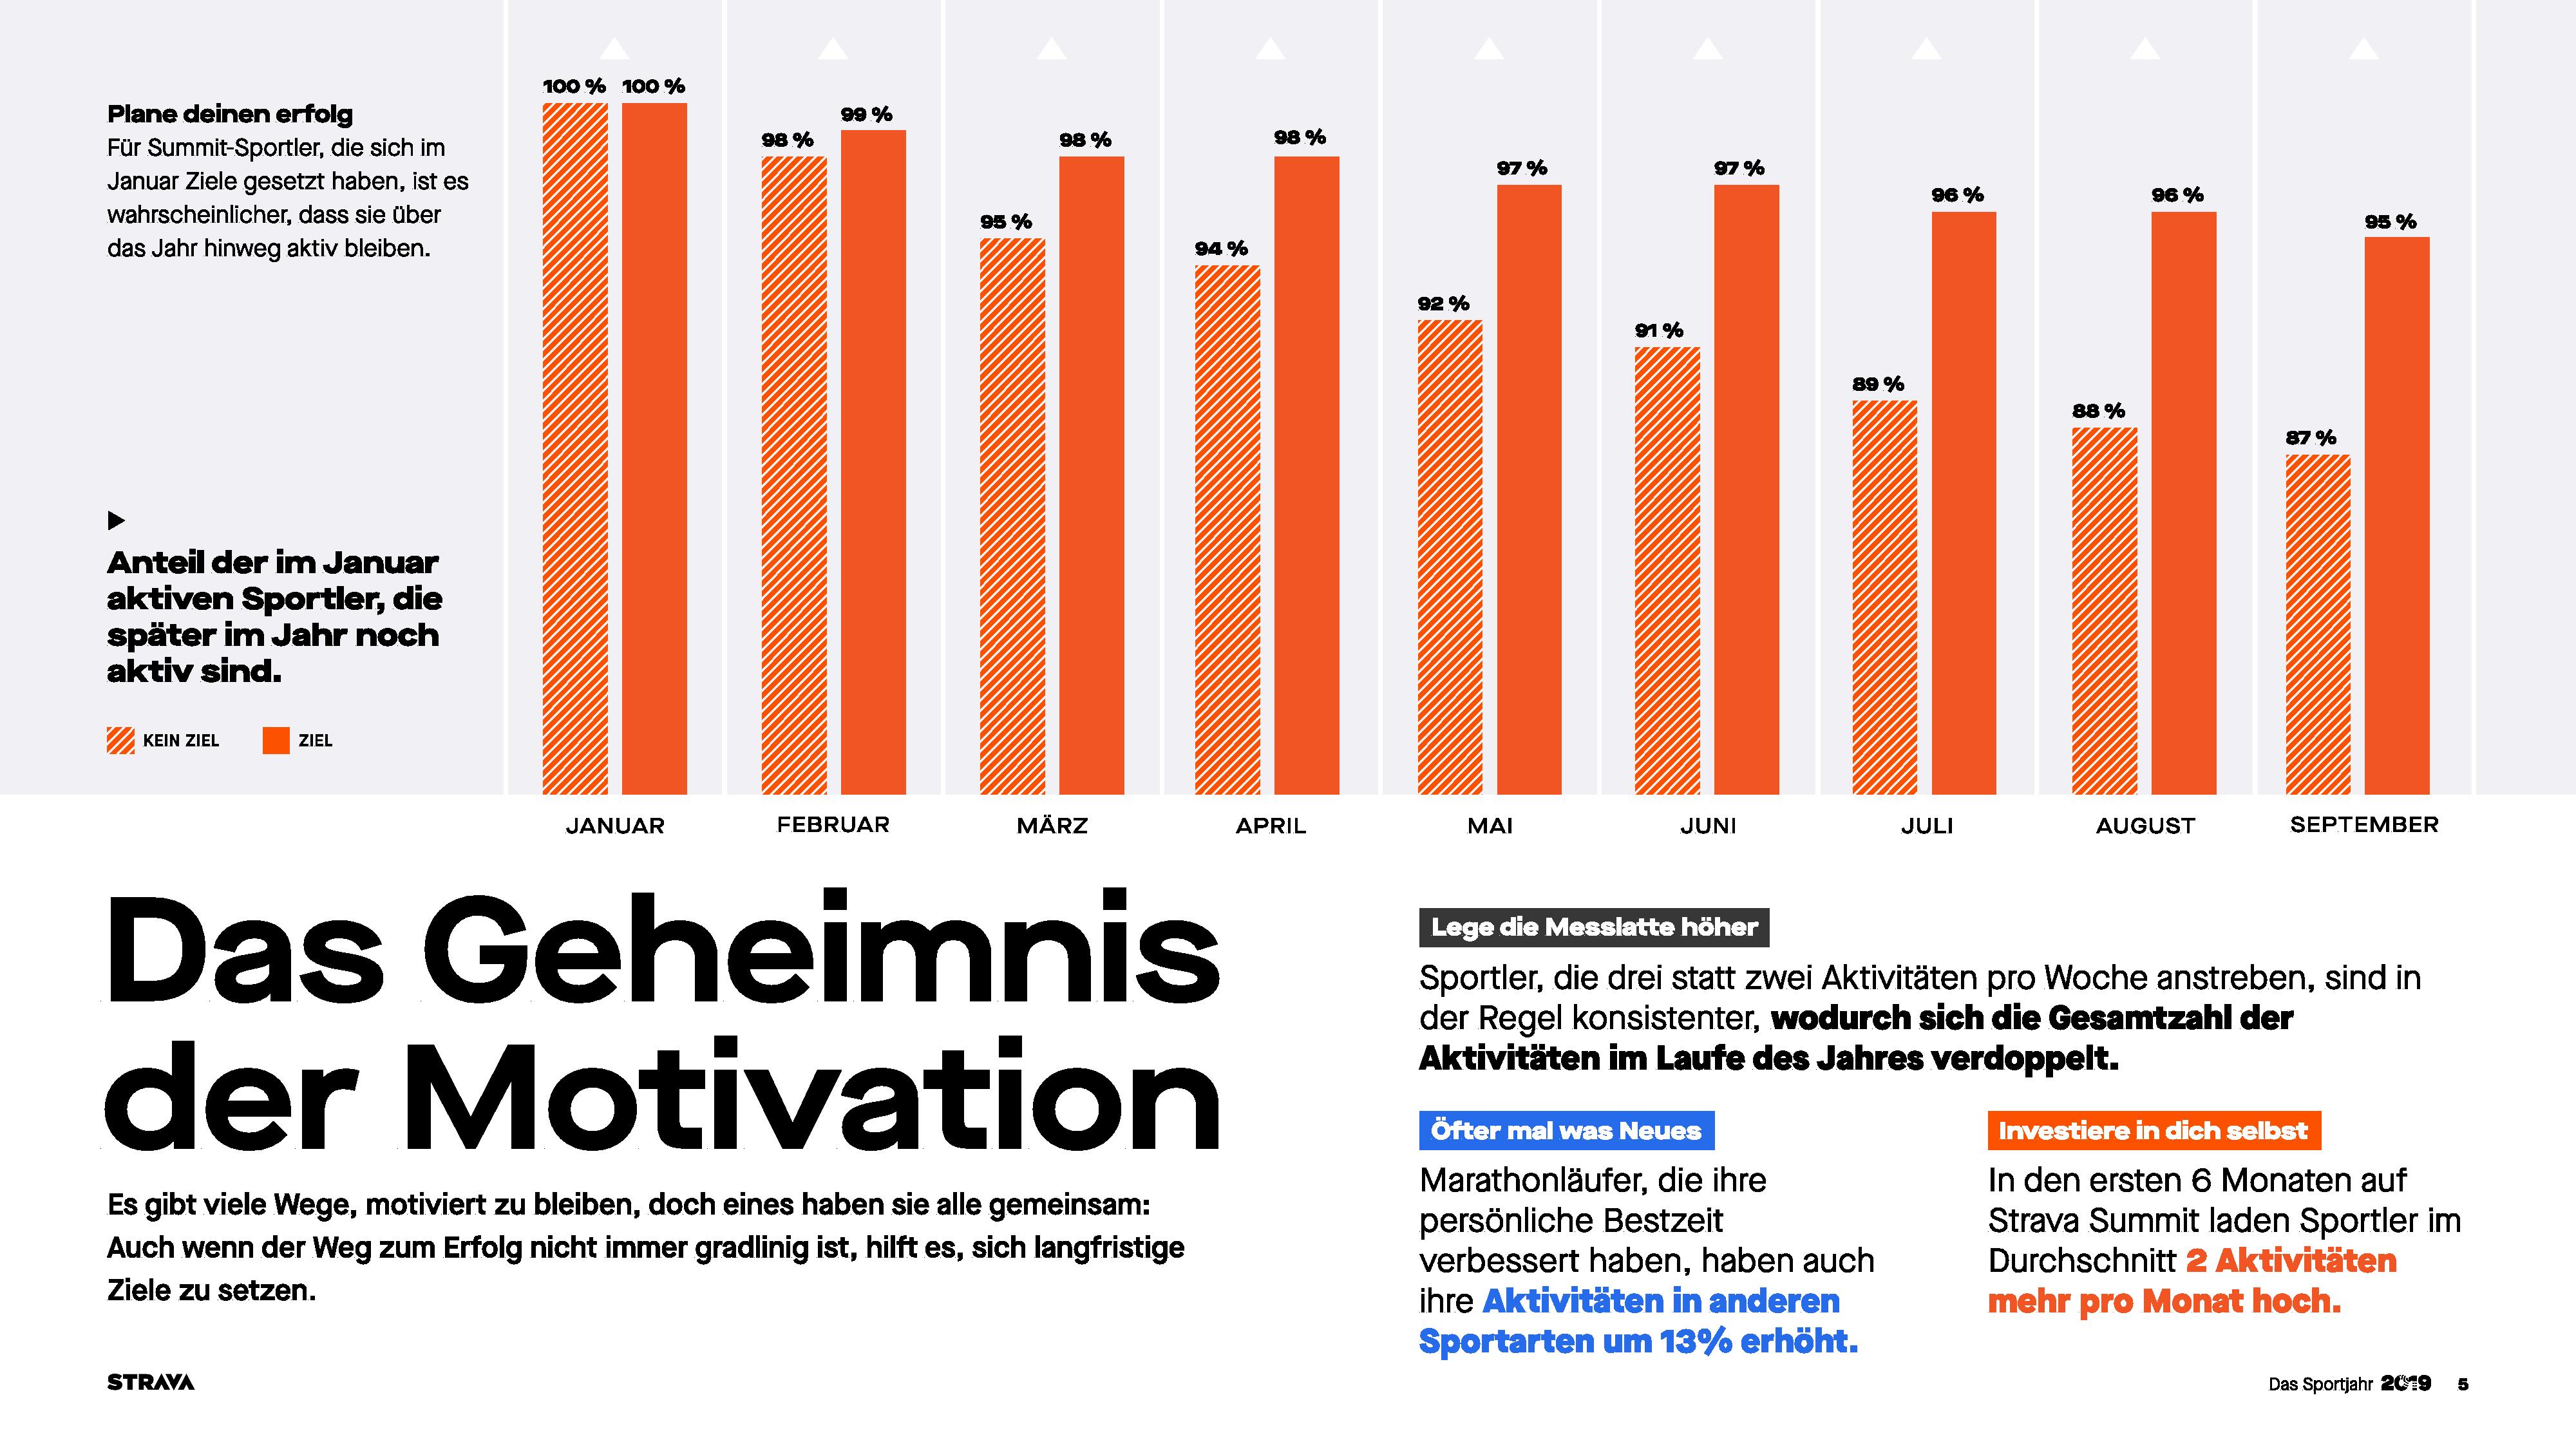
So I’ve been pouring through the stats today and here’s all the juiciest bits. I mean, there are non-juicy bits too – like goal setting. But you can read about that in the gallery.
First, we’ll start off with the top-line numbers. This includes 48 million athletes and uploading 19 million activities per week. Strava notes elsewhere that they continue to add about one million members per month, which has been a mostly constant rate for quite a while now (as proven by having 42 million back in July).

Now, as with any math project – Strava or otherwise – you need to be careful about drawing too many assumptions using simple math. For example, this doesn’t mean that only half the members upload each week. In fact, it’s far less than that. Roughly about 15% upload monthly, if looking across the entirety of all Strava members ever created.
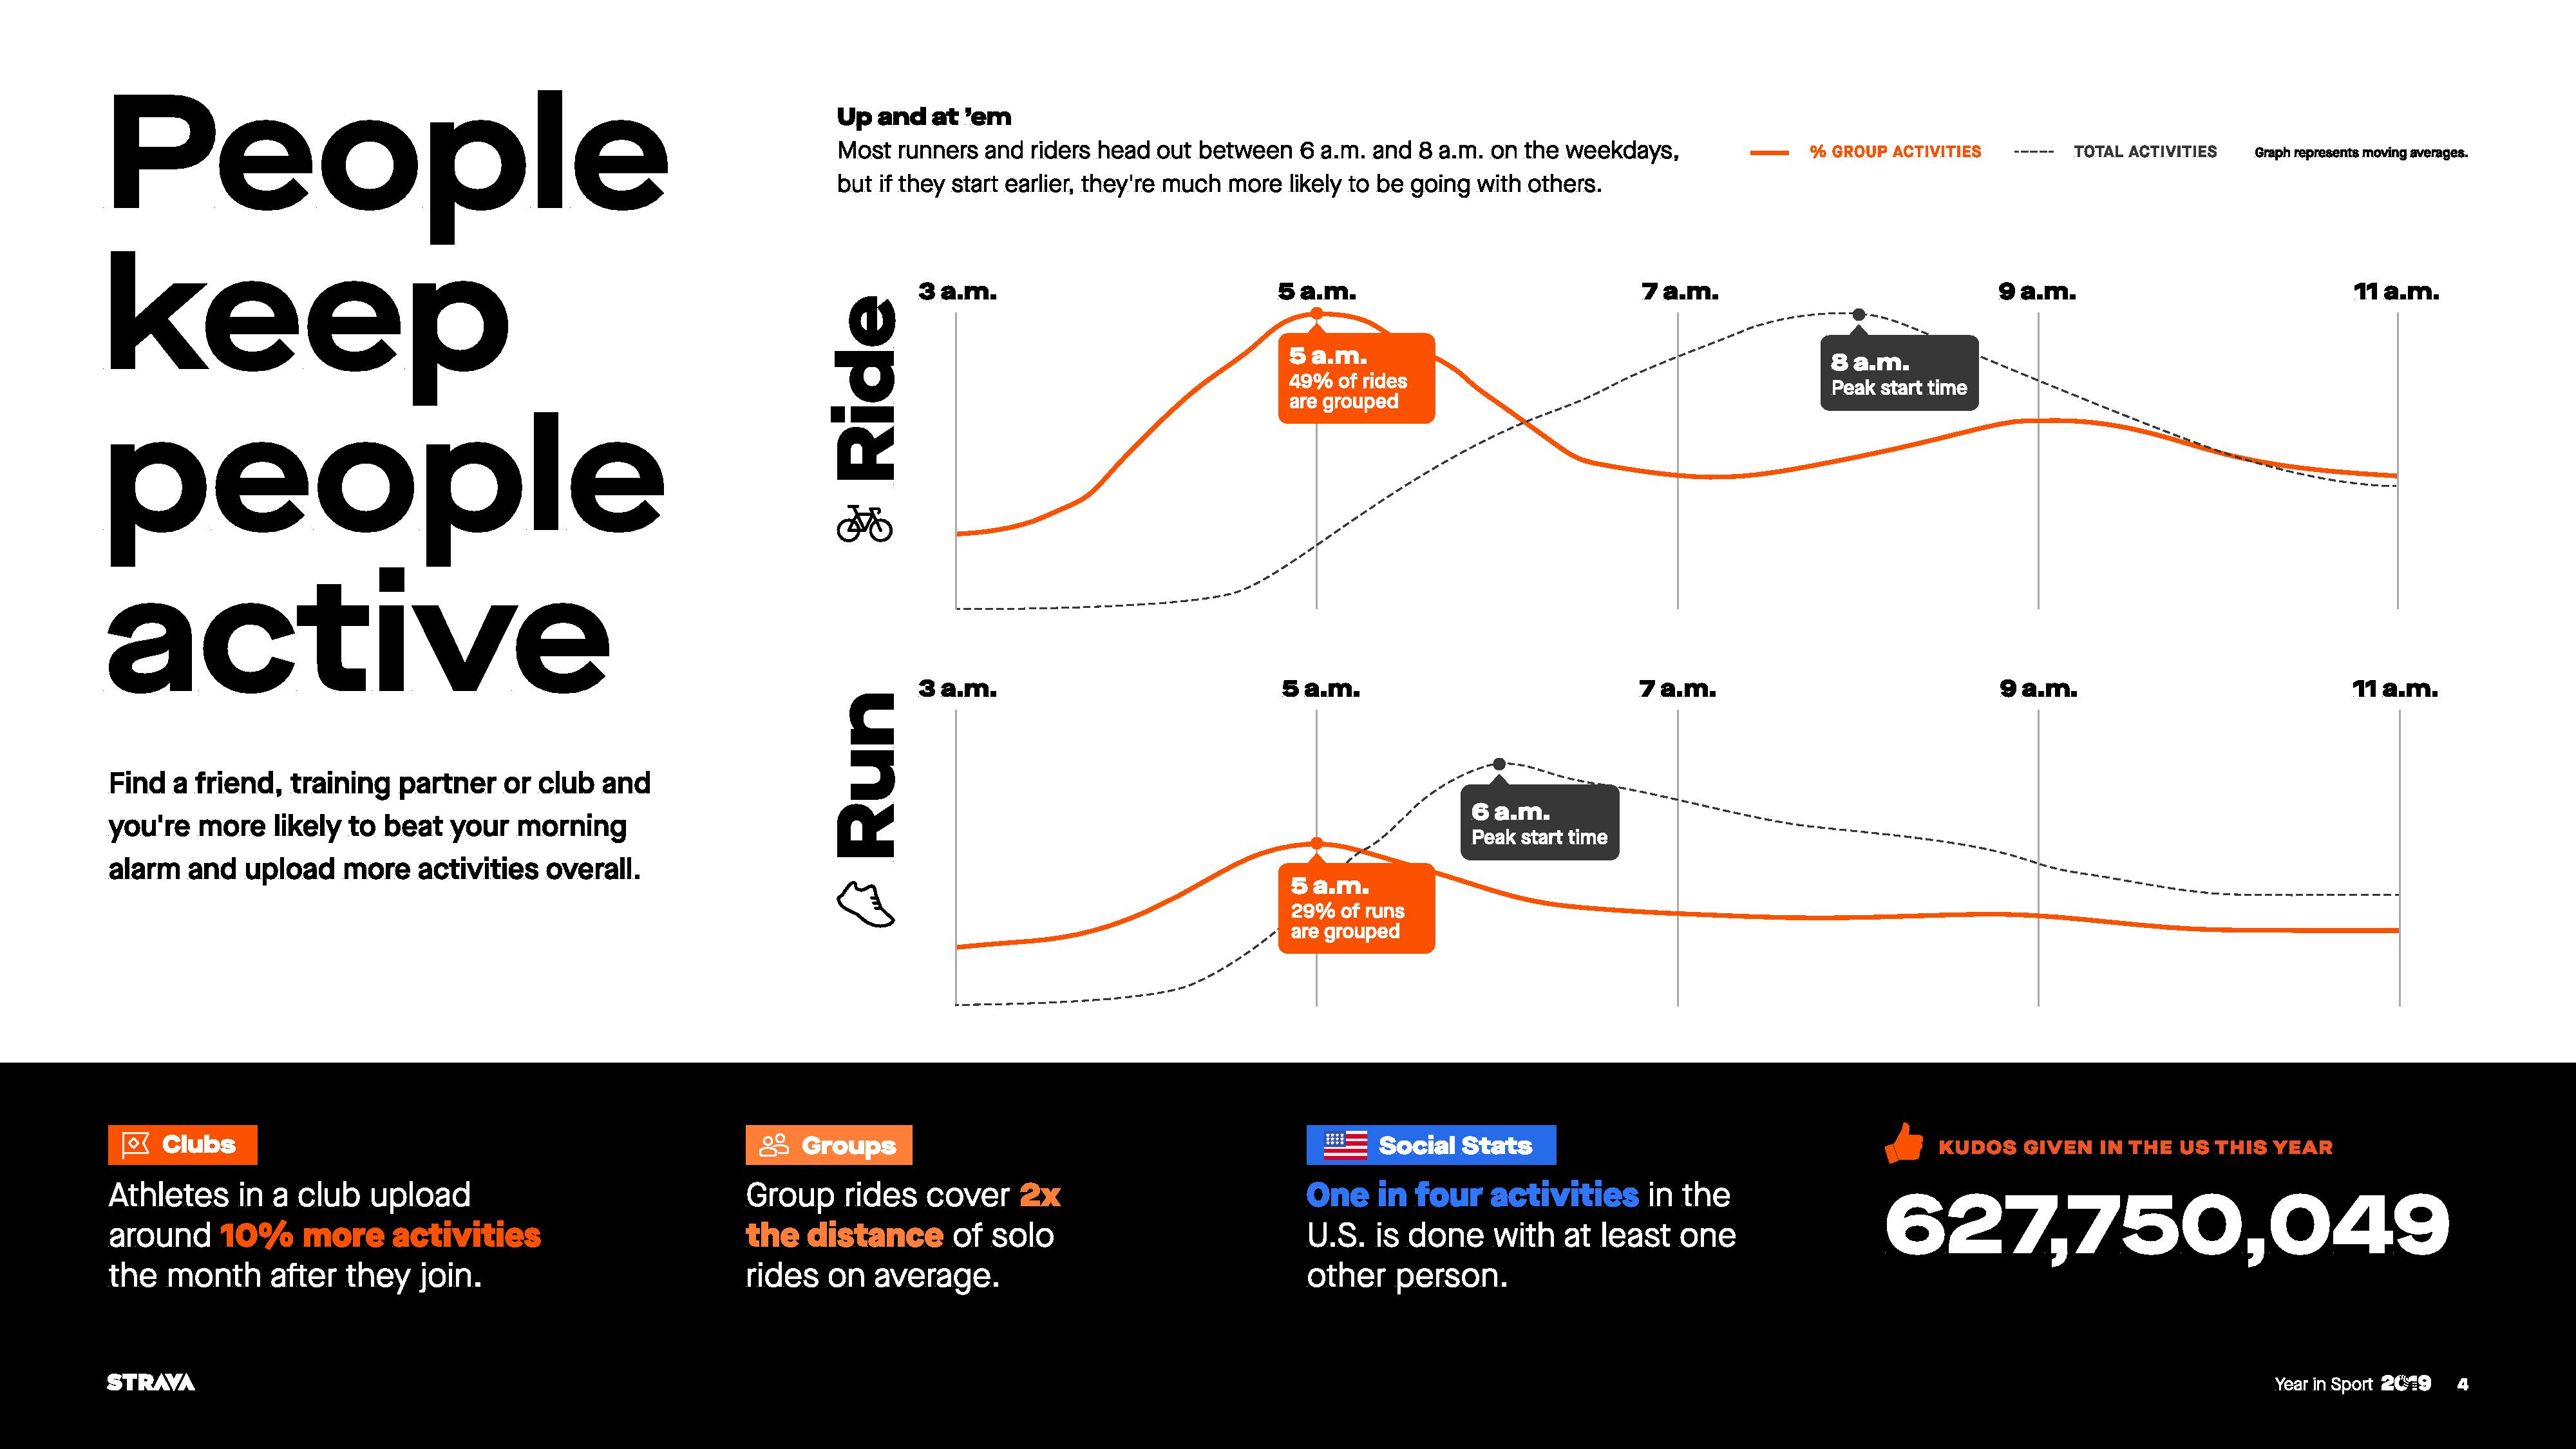
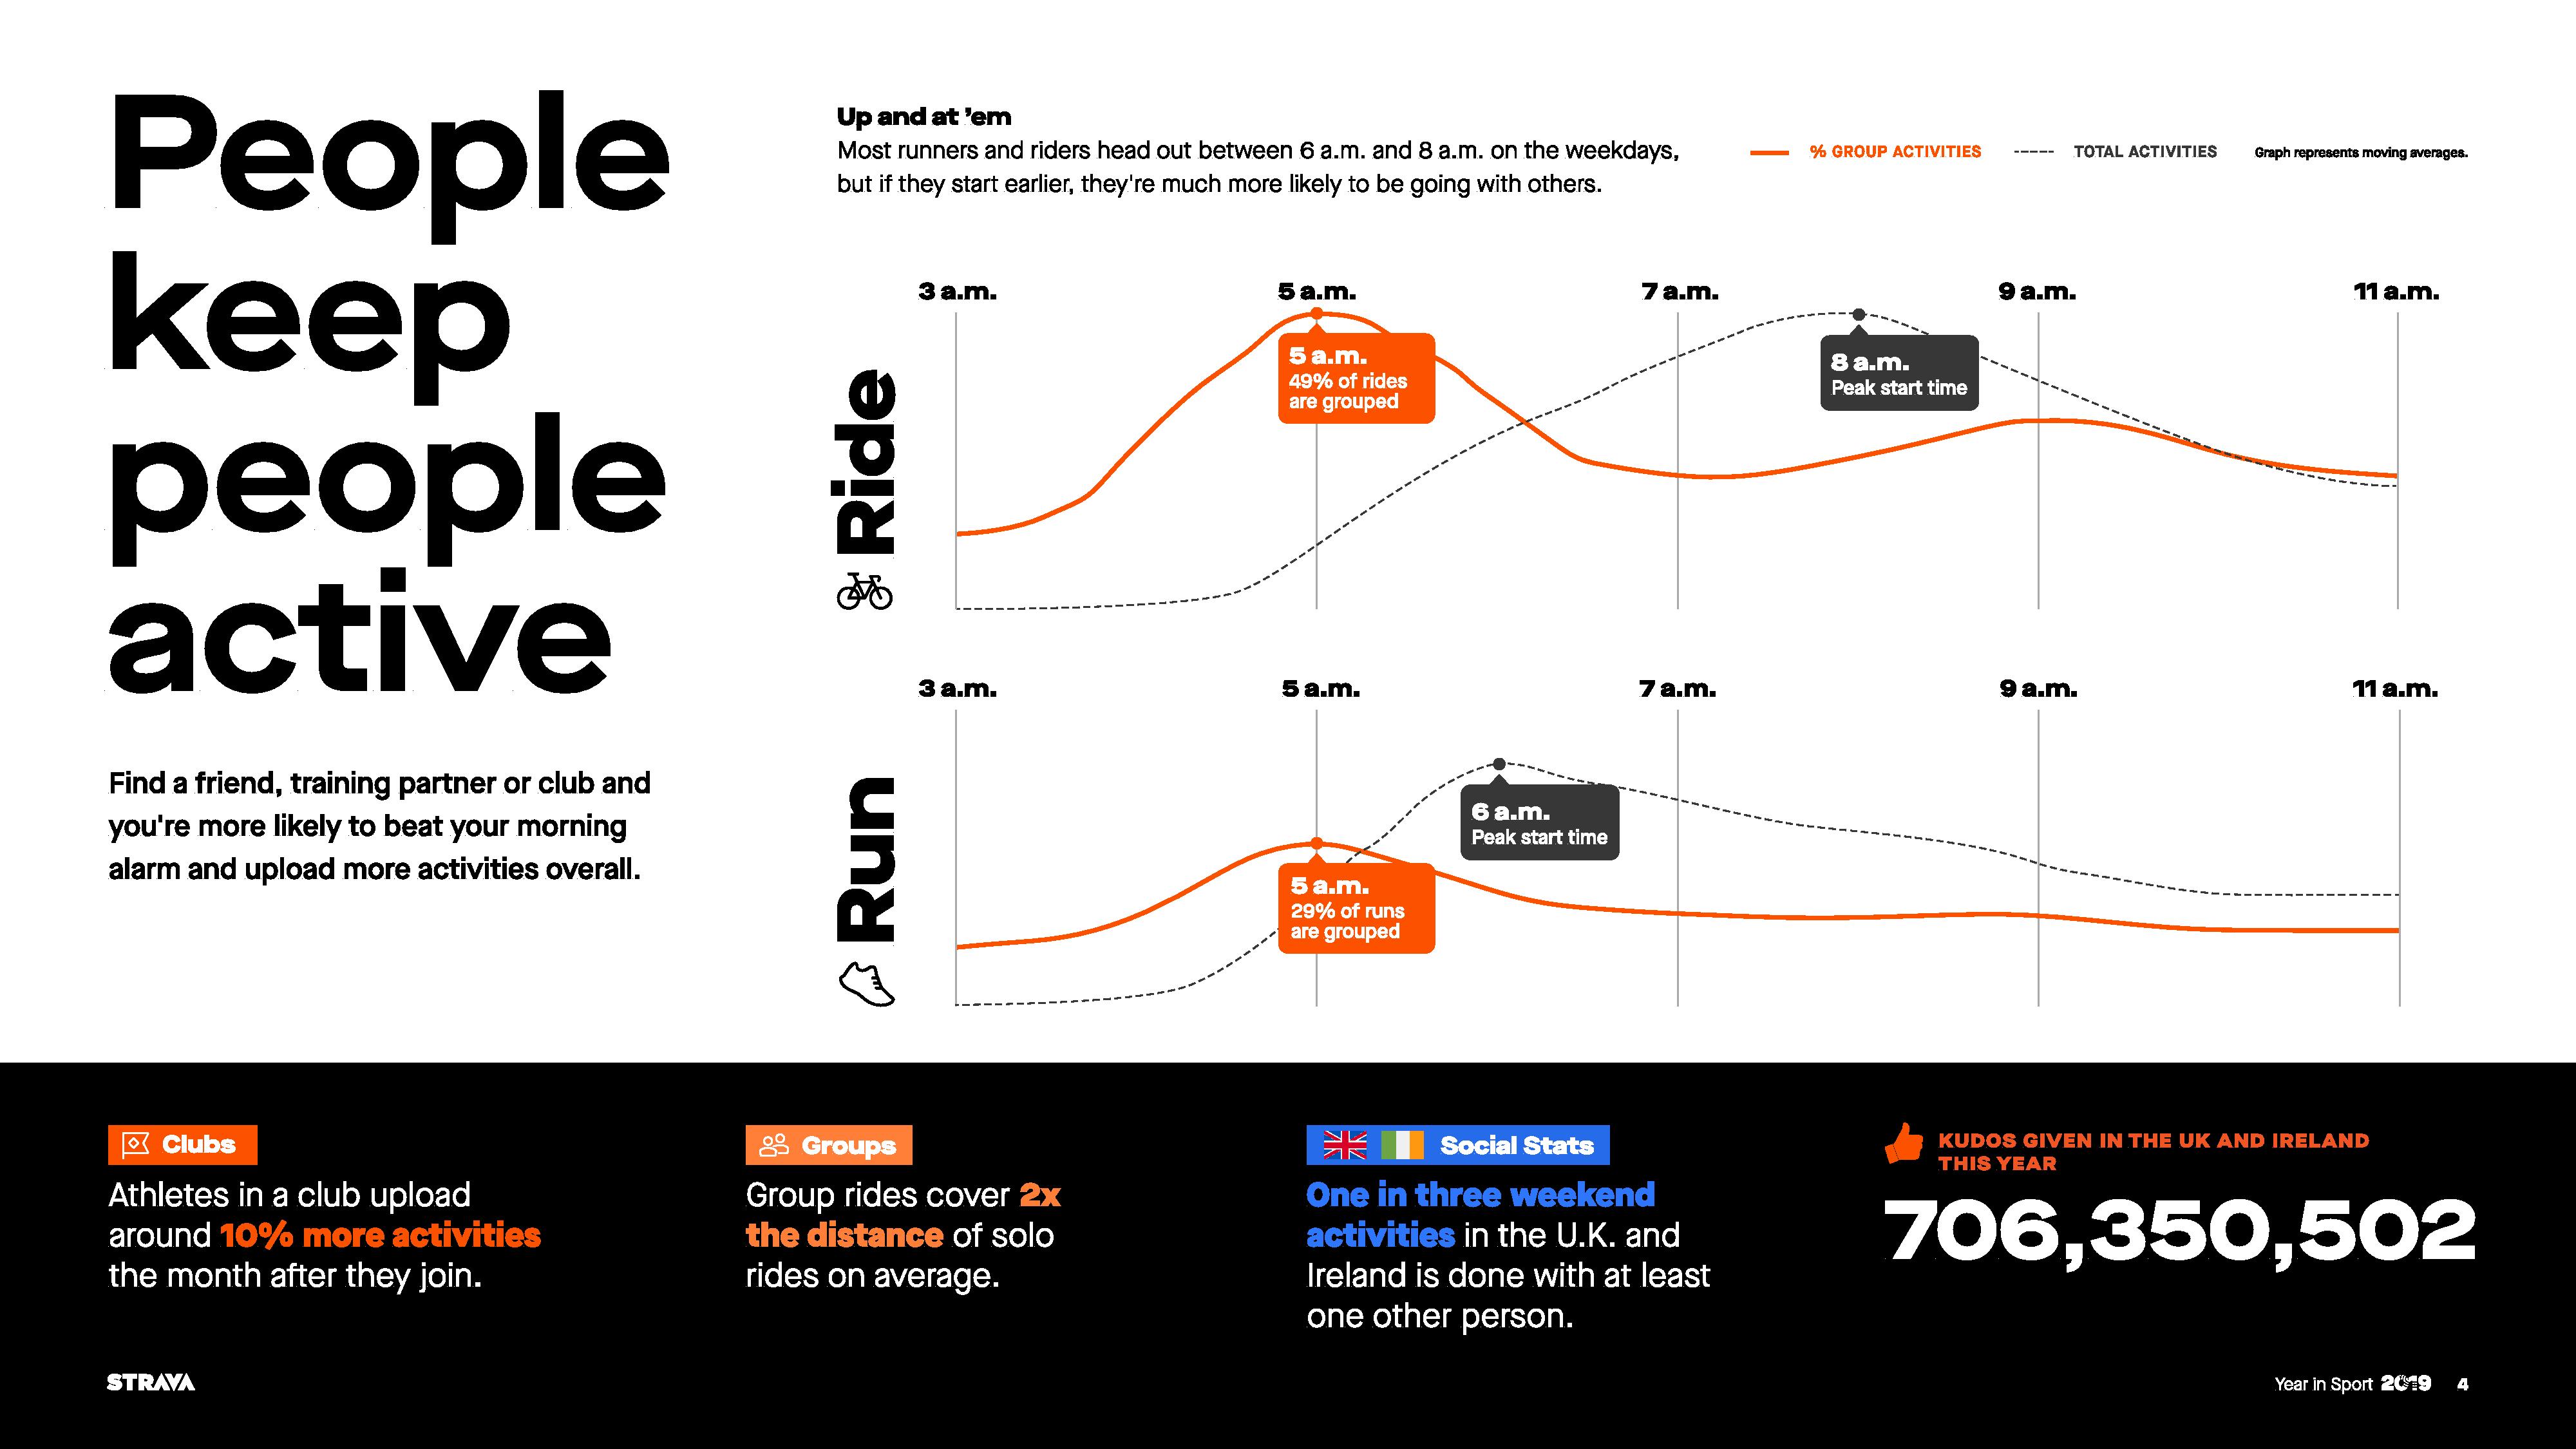
This year Strava has actually split up reports by a bunch of countries. The main global stats are…well…global. But occasionally you’ll see secondary stats next to a flag for a given country. In the case of the below, the US. Still, if we look at this global stat for when people workout on week days, it’s interesting to see that people tend to go out earlier with groups. Also, that group rides tend to double the distance of solo riders.

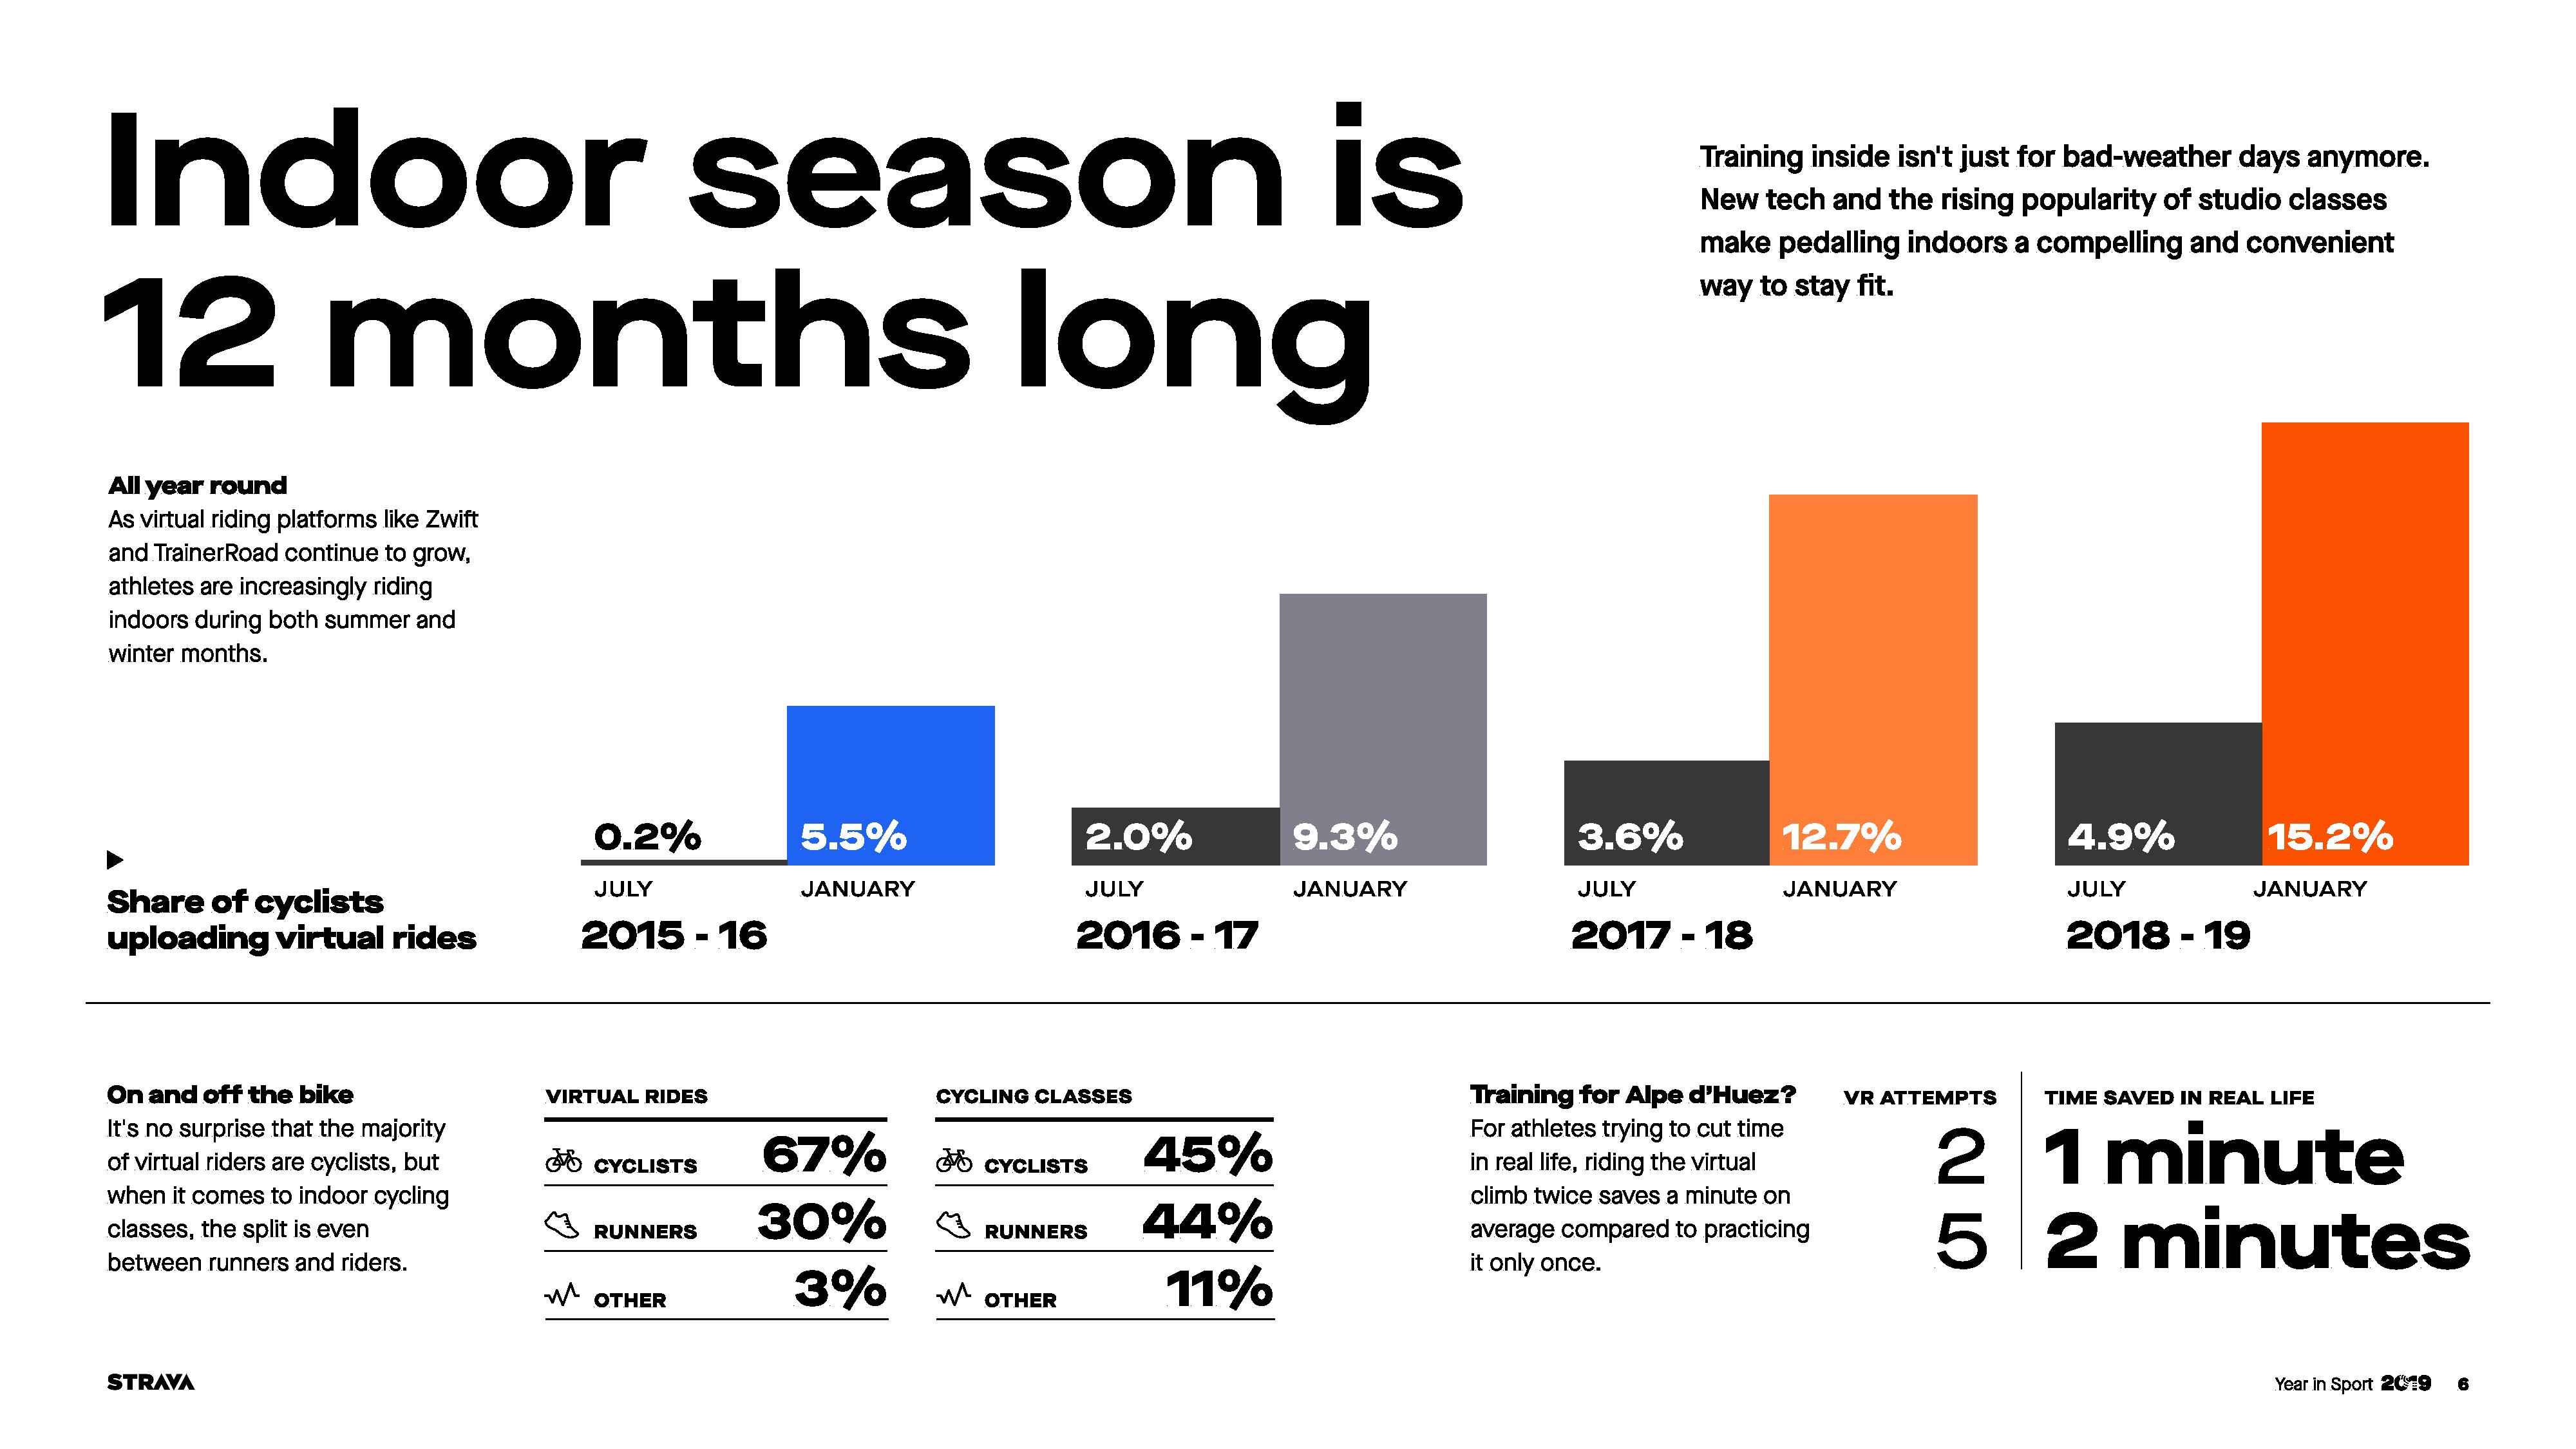
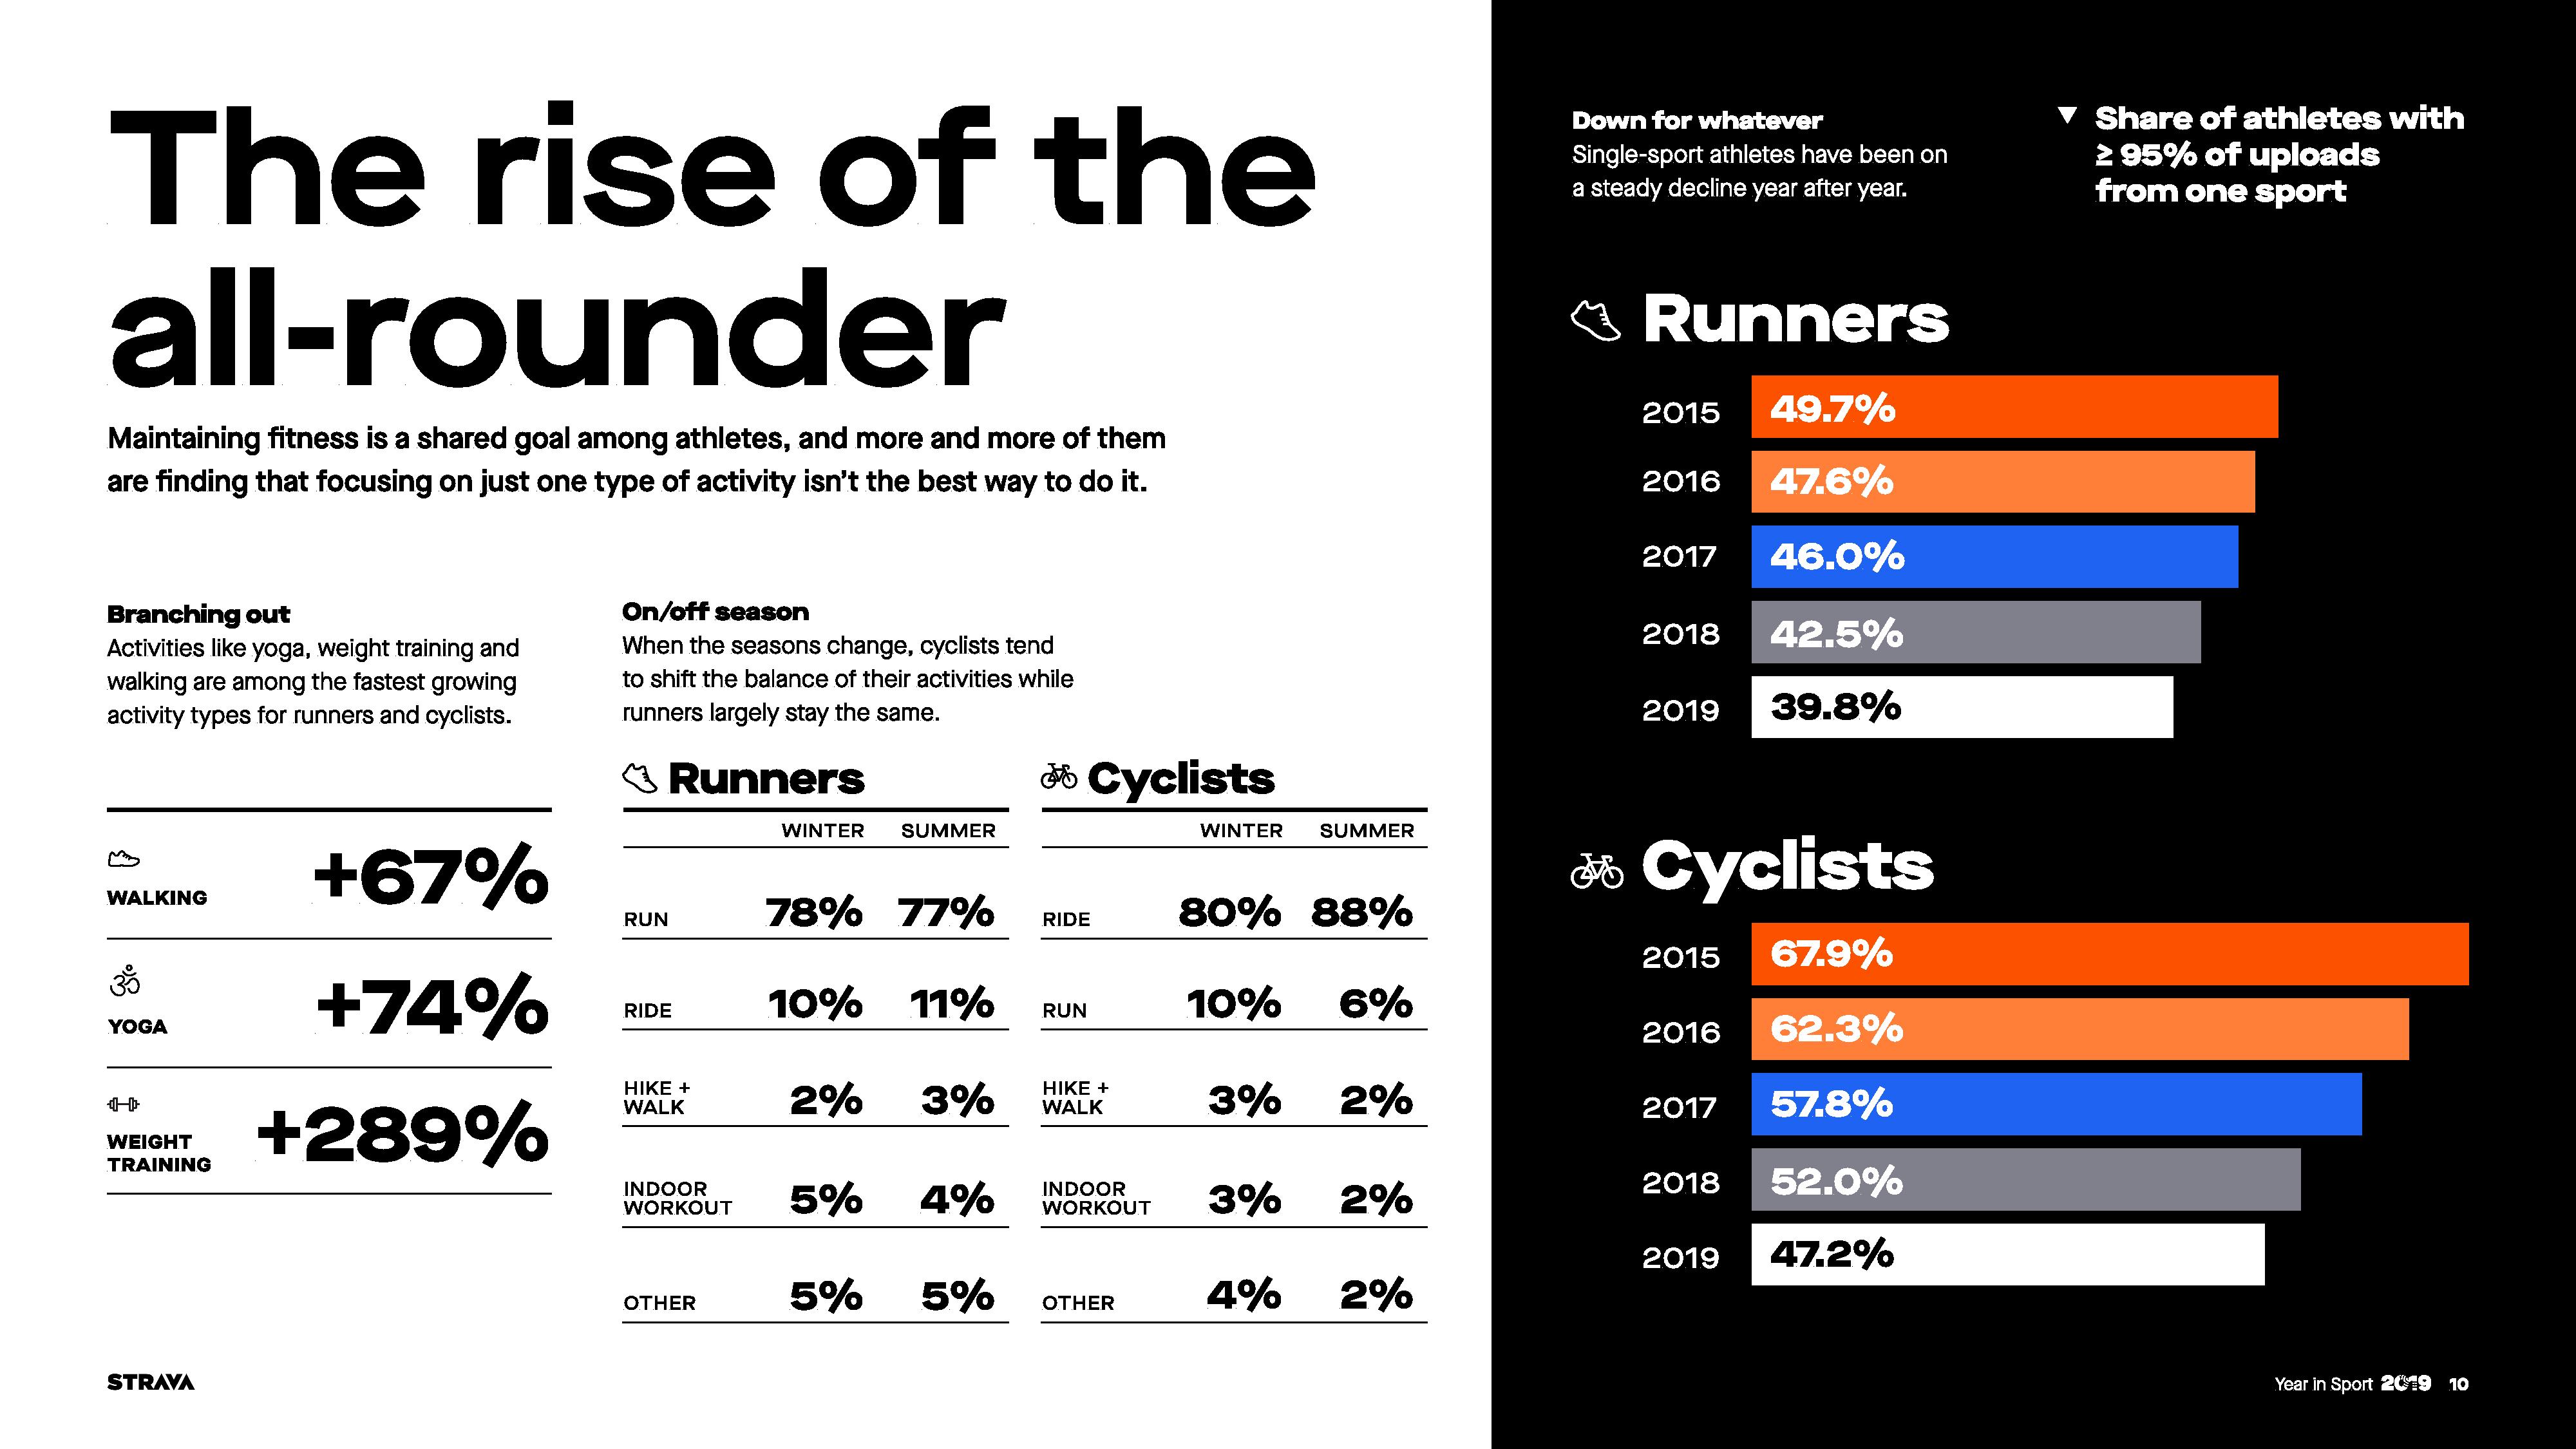
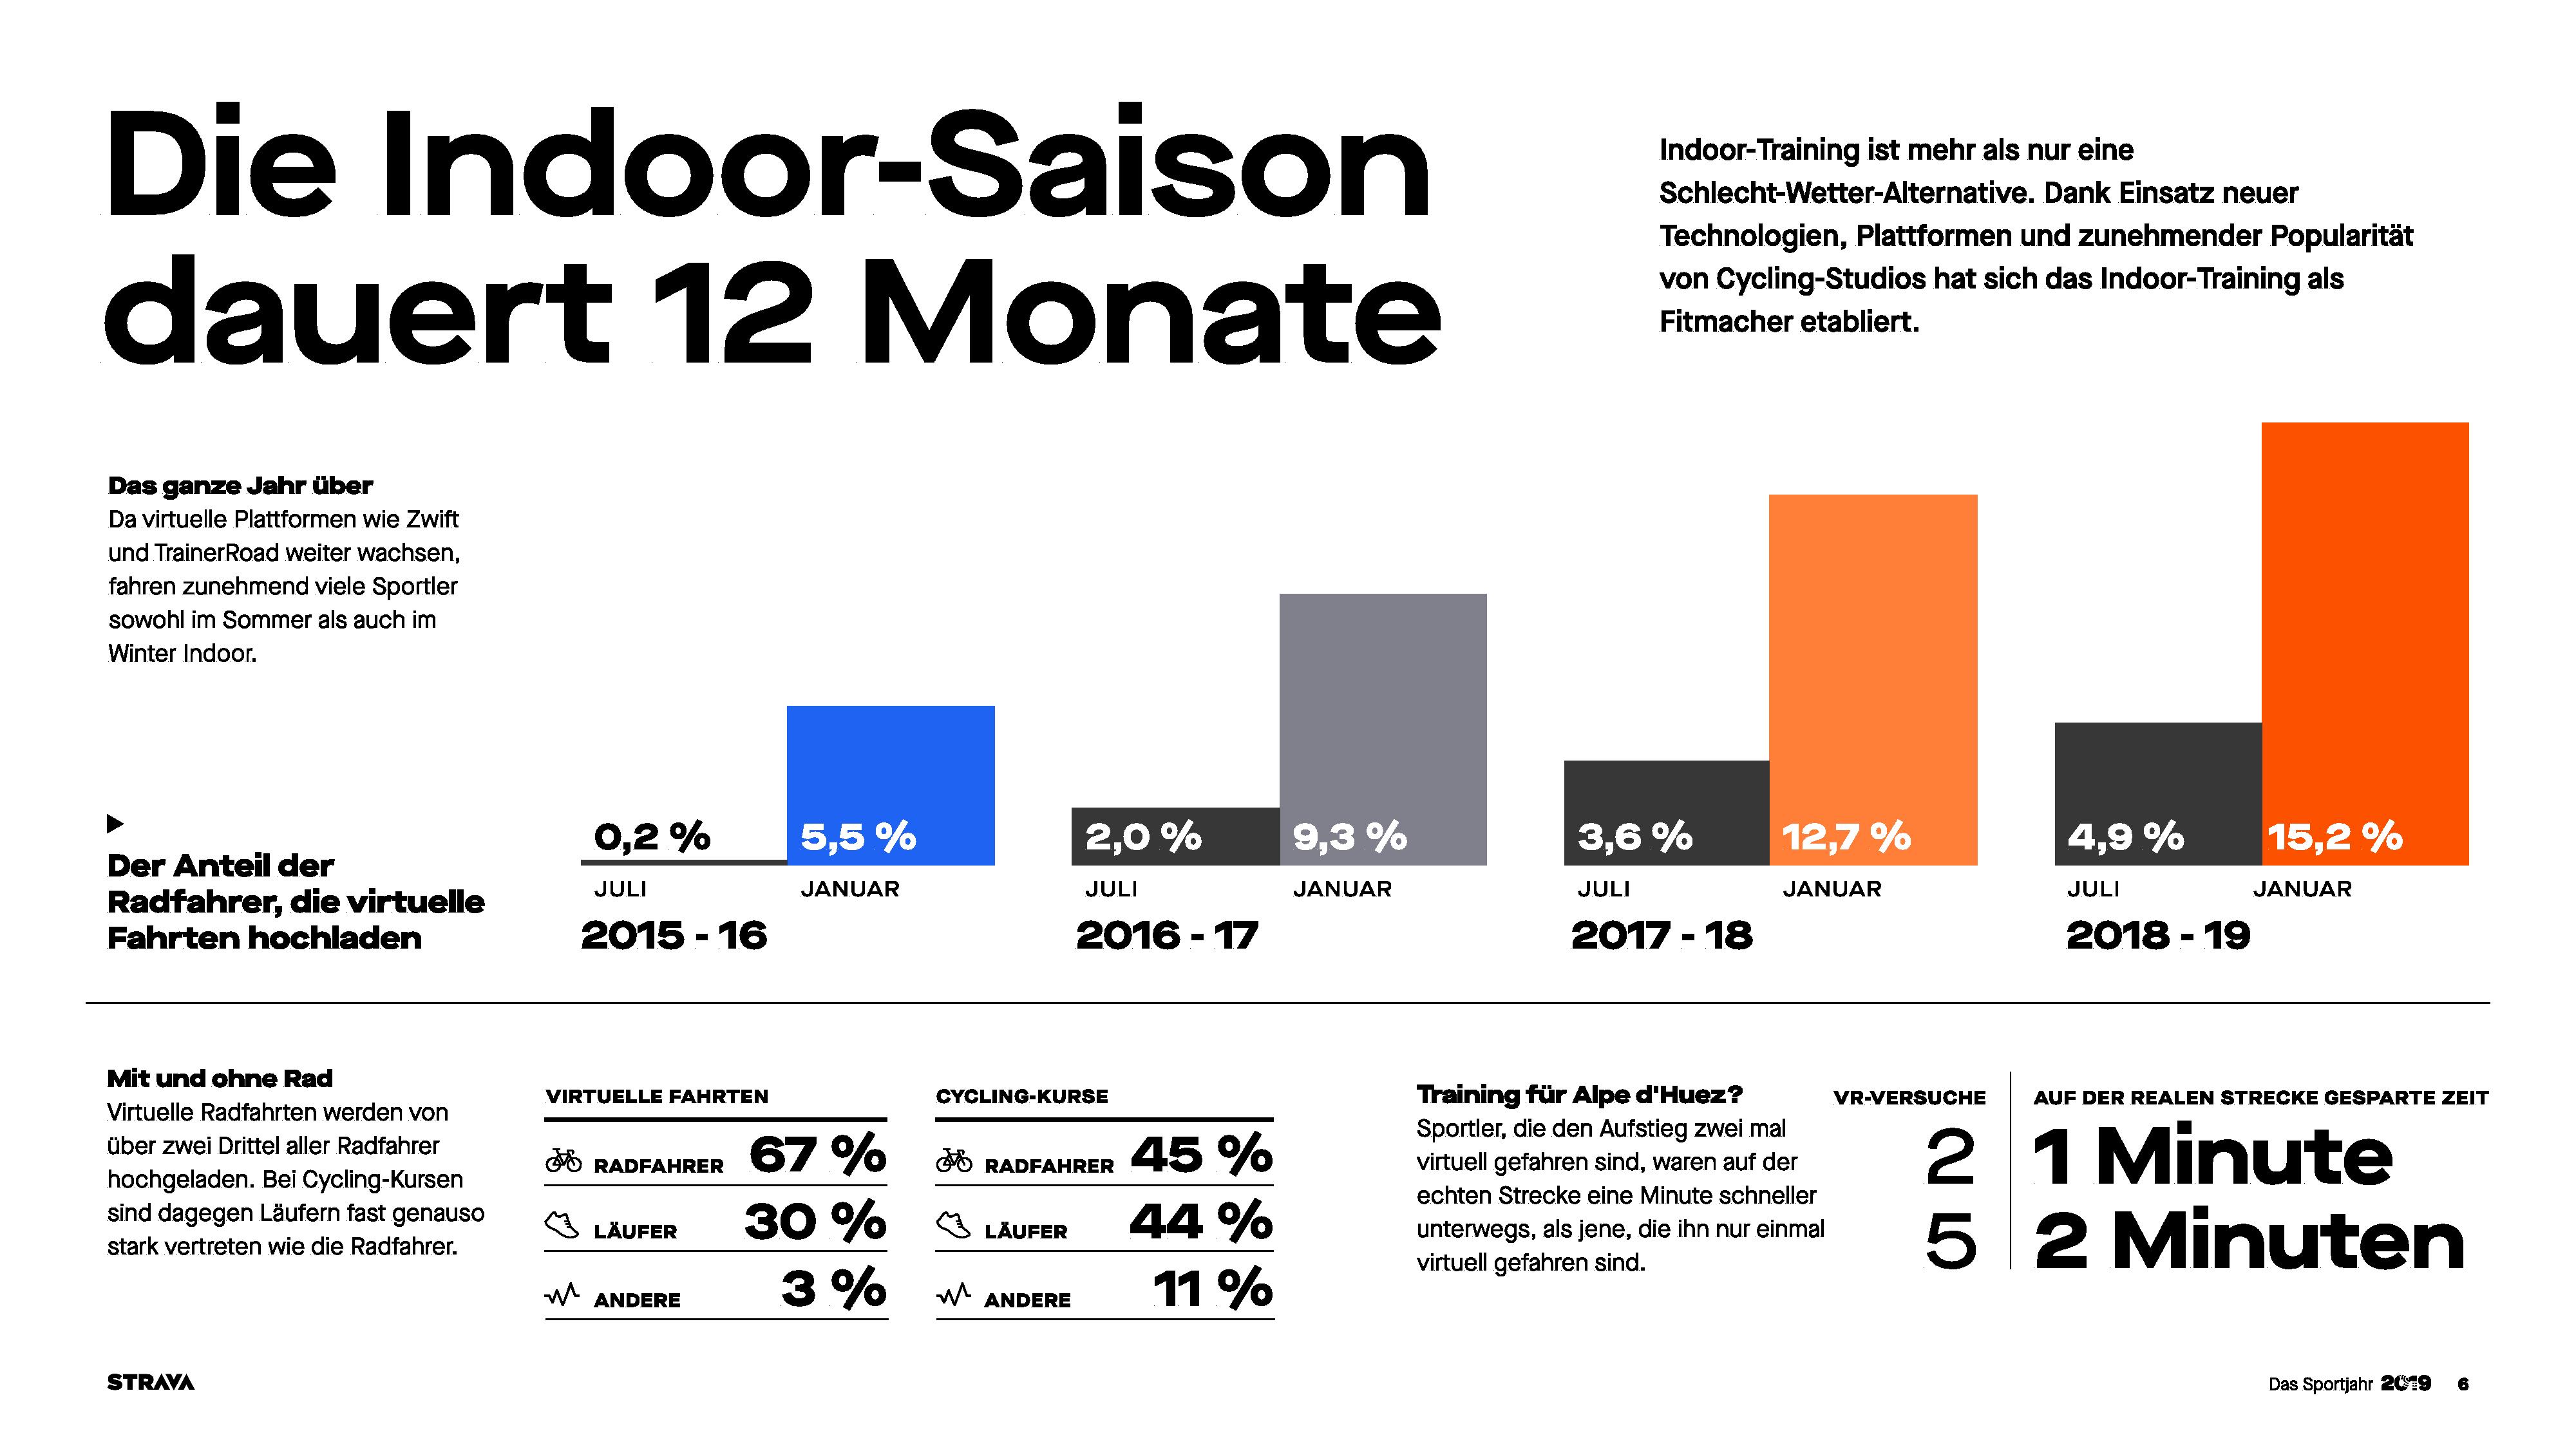
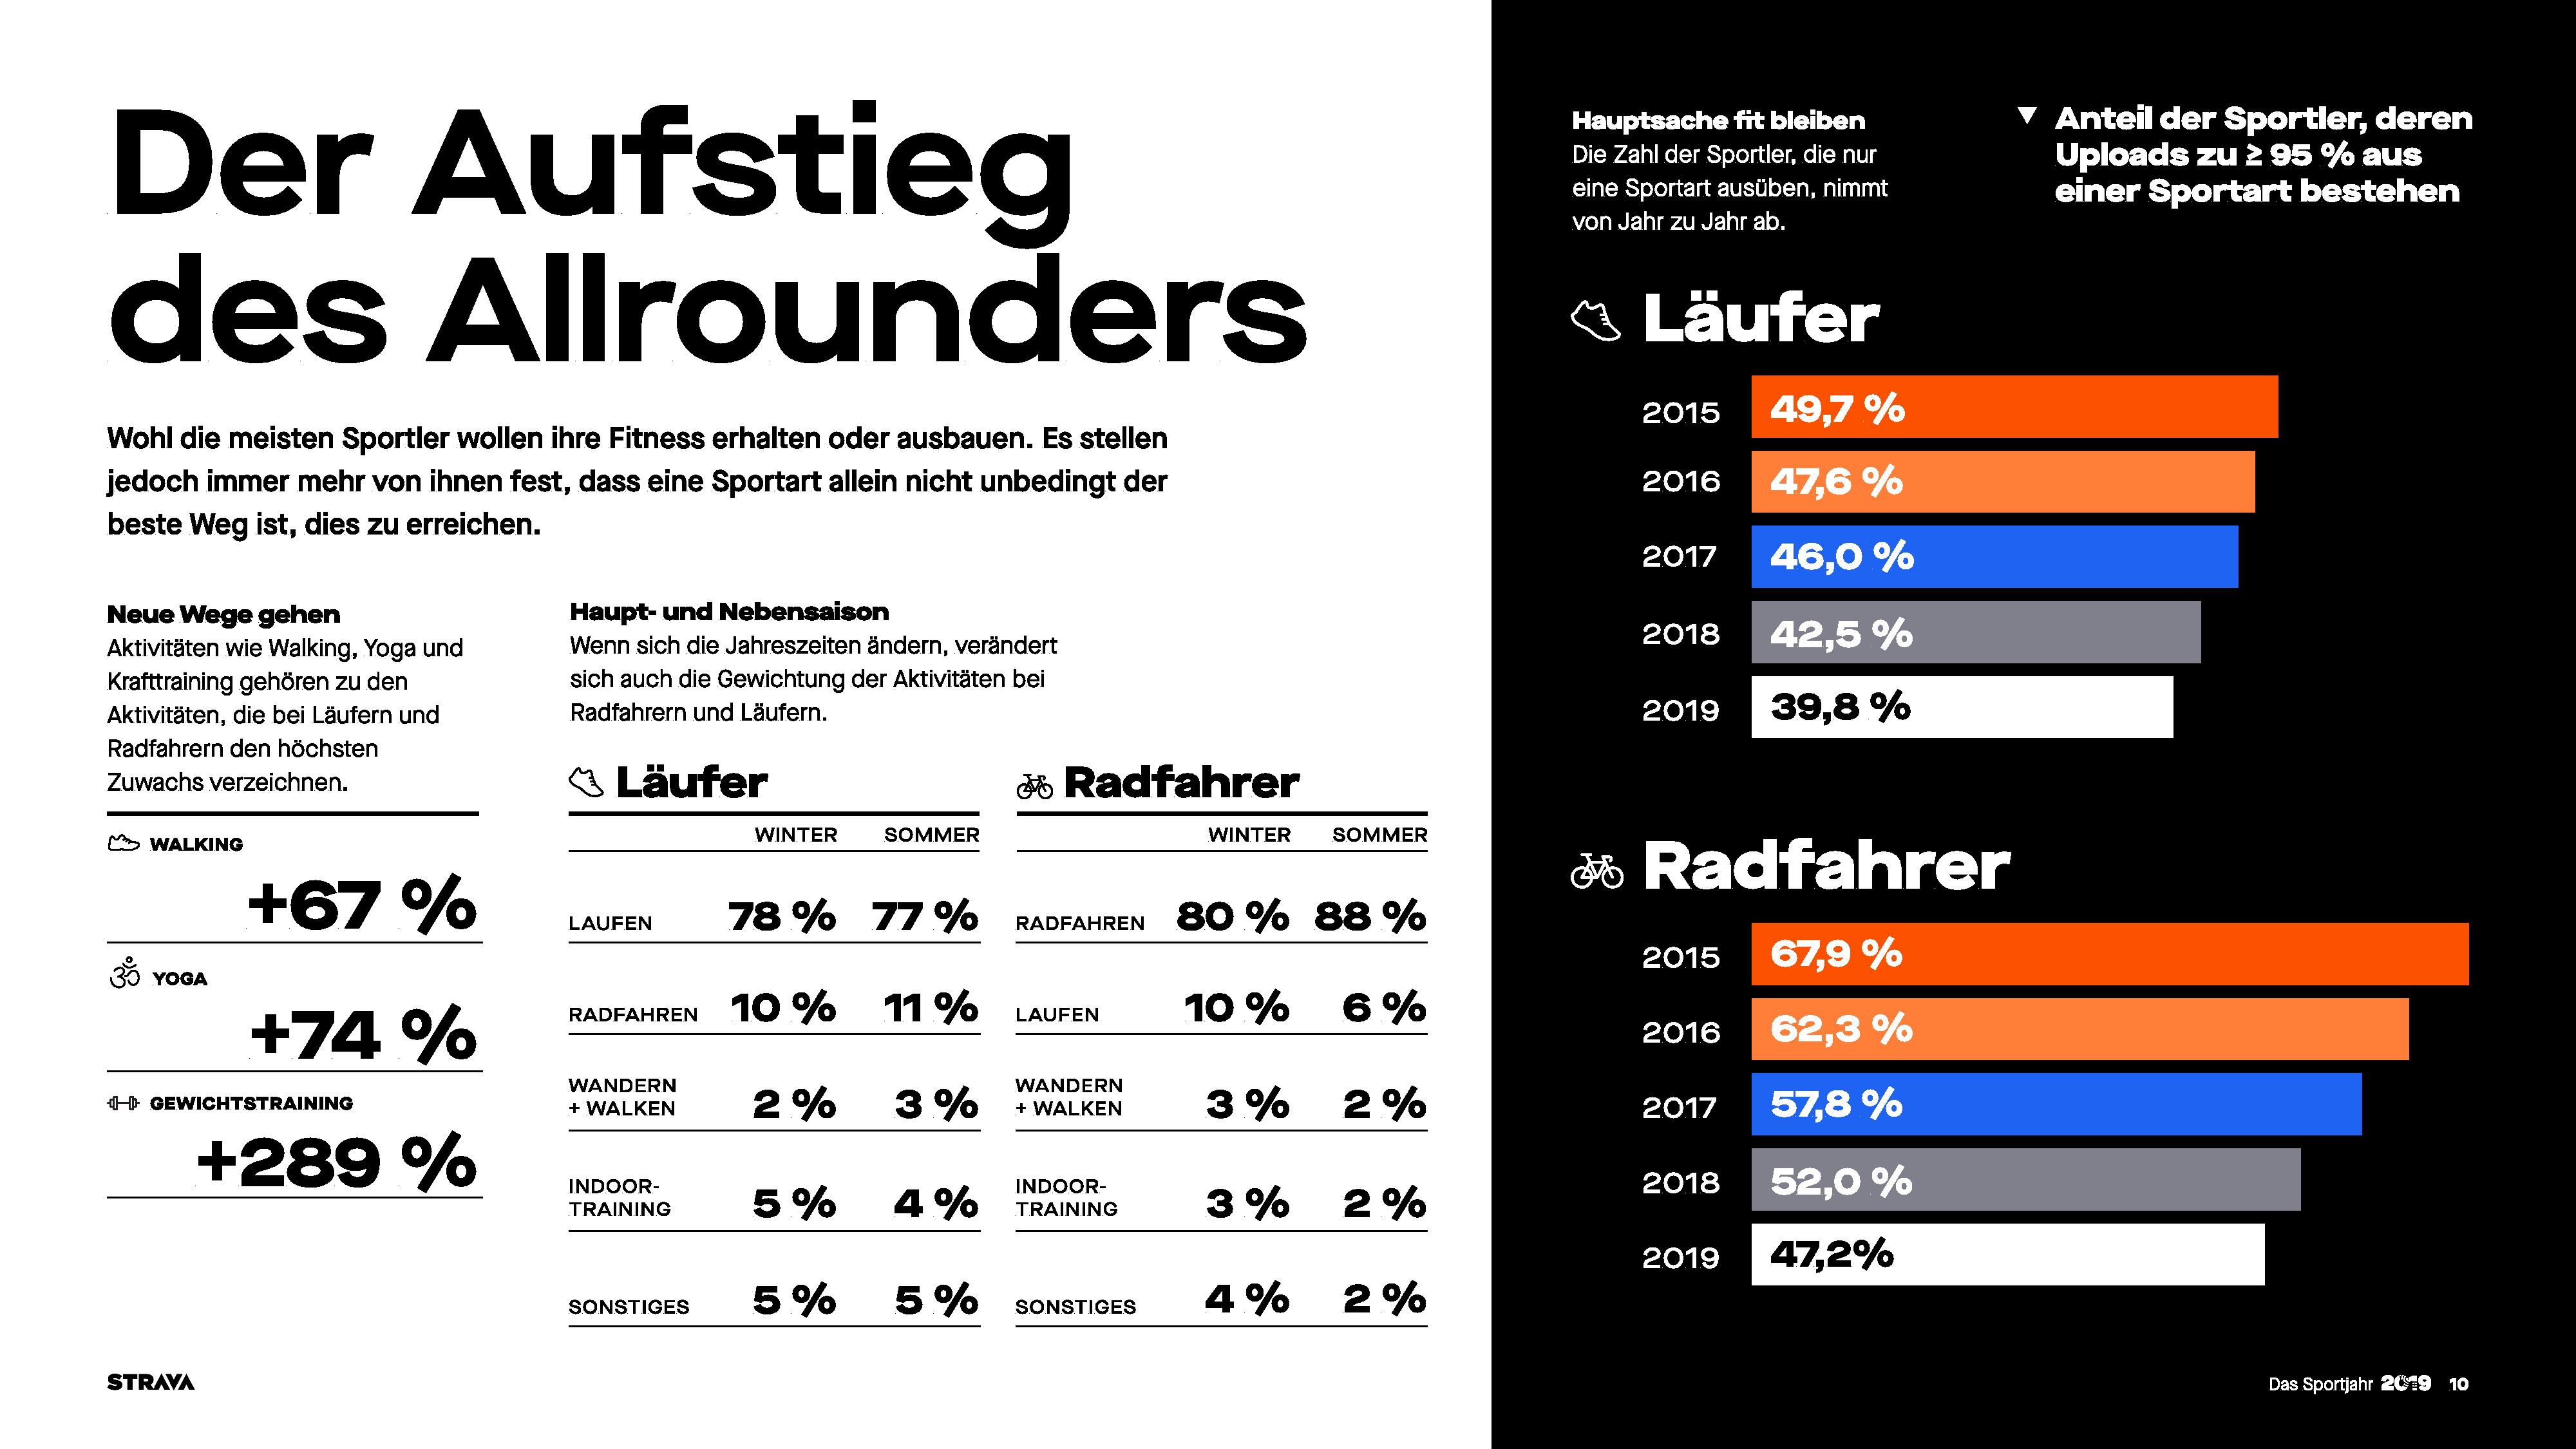
The next stat will surprise approximately nobody – people are riding indoors now more than ever. And more than that, they’ll riding indoors in the summer months more than before. 4 years ago, only 0.2% of people did rides indoors during the summer, versus that’s up to 4.9%. However, one nuanced tidbit here is that it’s not clear if these are technically just GPS-less rides, or rides actually marked as “Virtual Ride” – which is a specific indoor category that apps didn’t actually start to leverage till around late 2016 or so. Still, I’m pretty sure the point is mostly the same here.

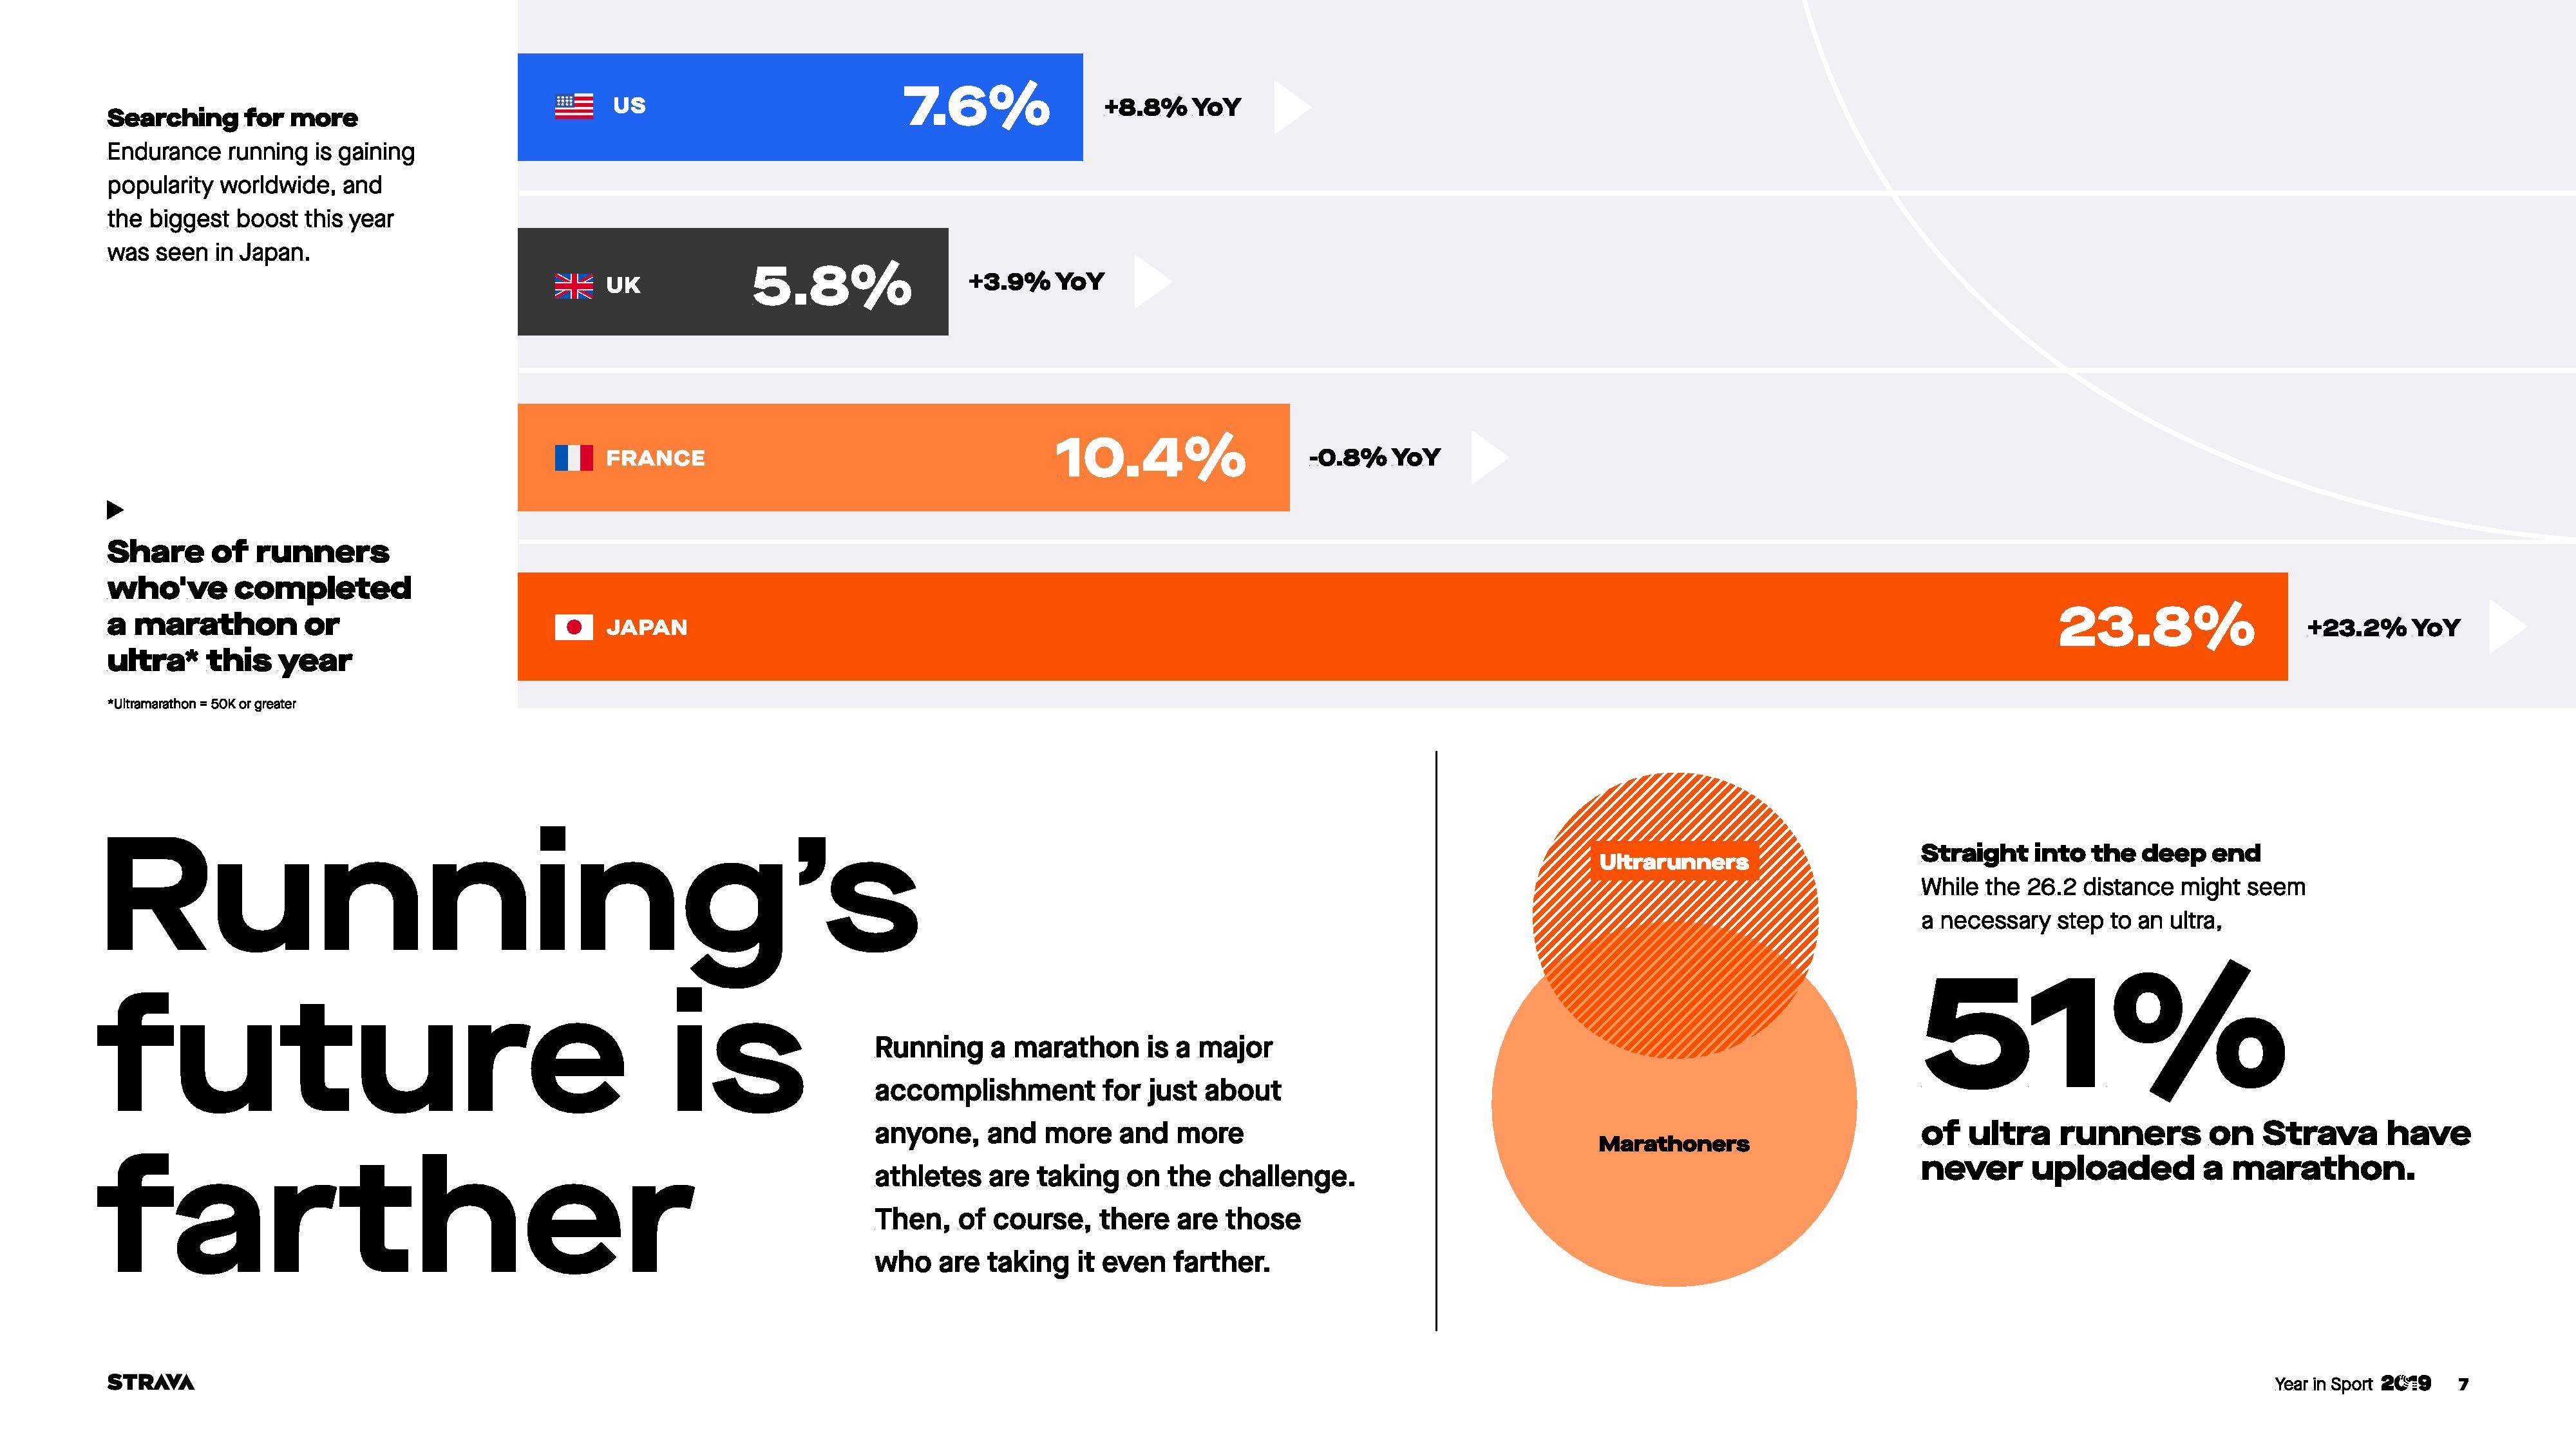
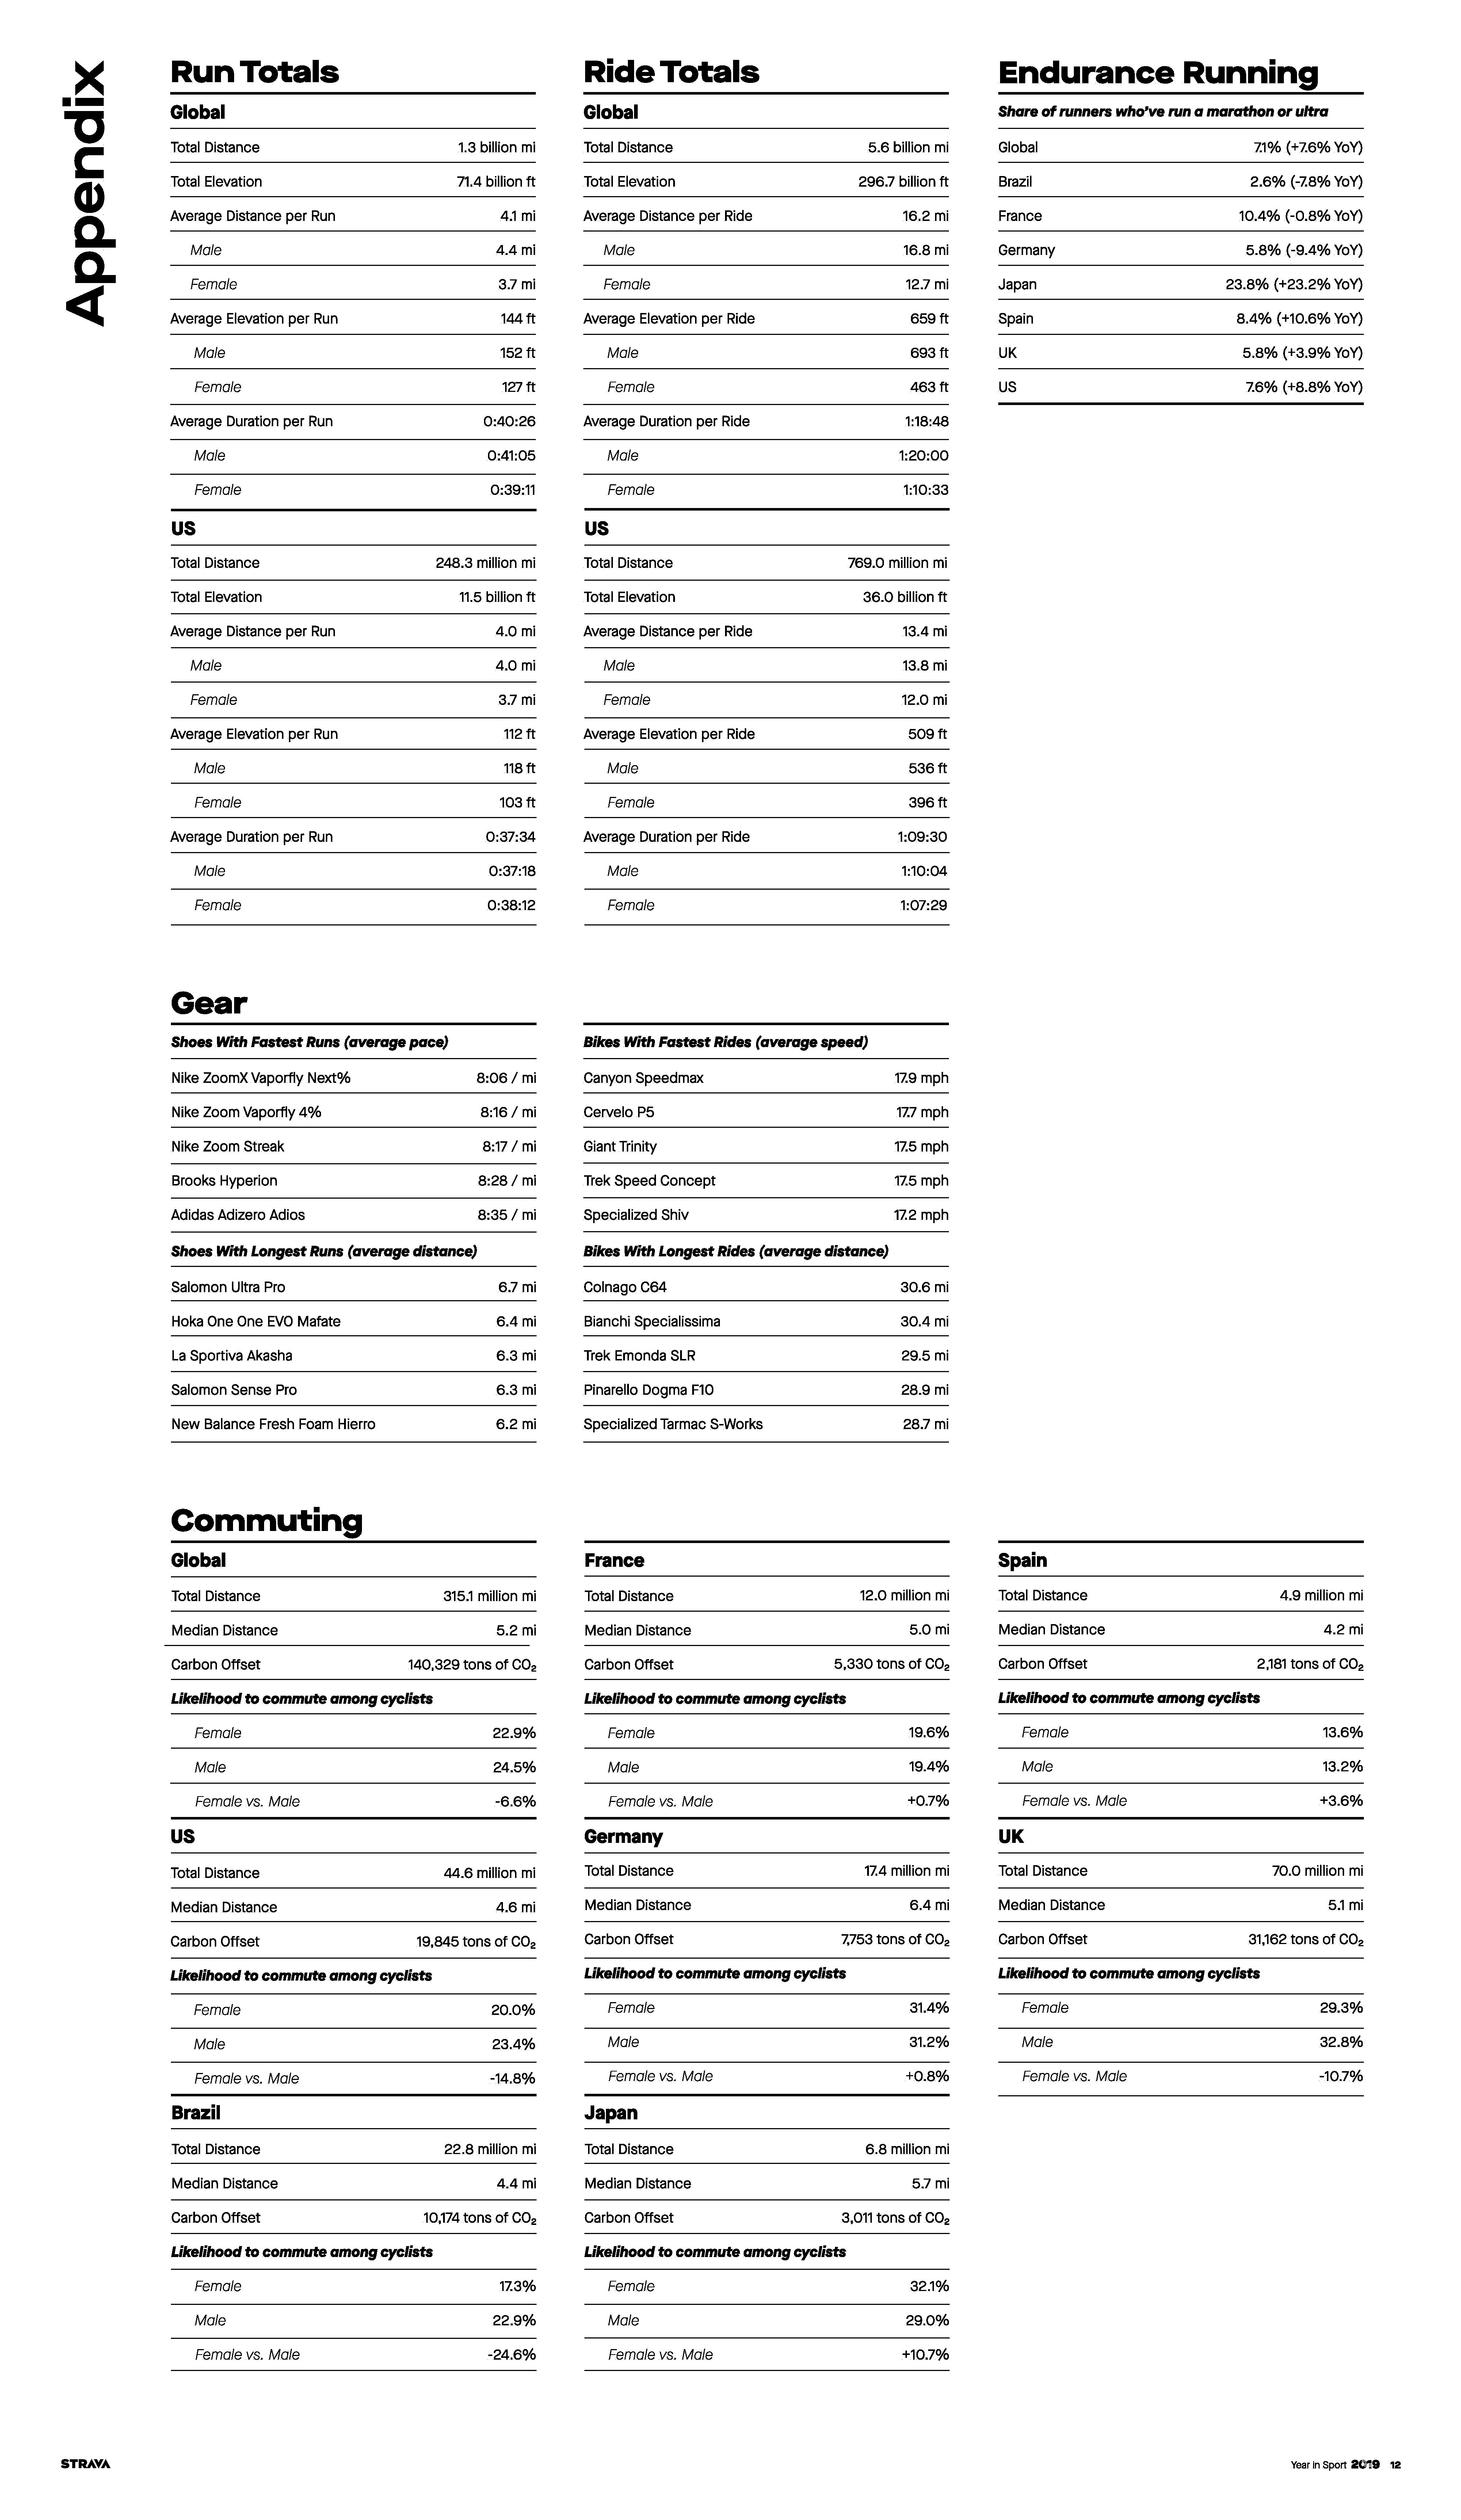
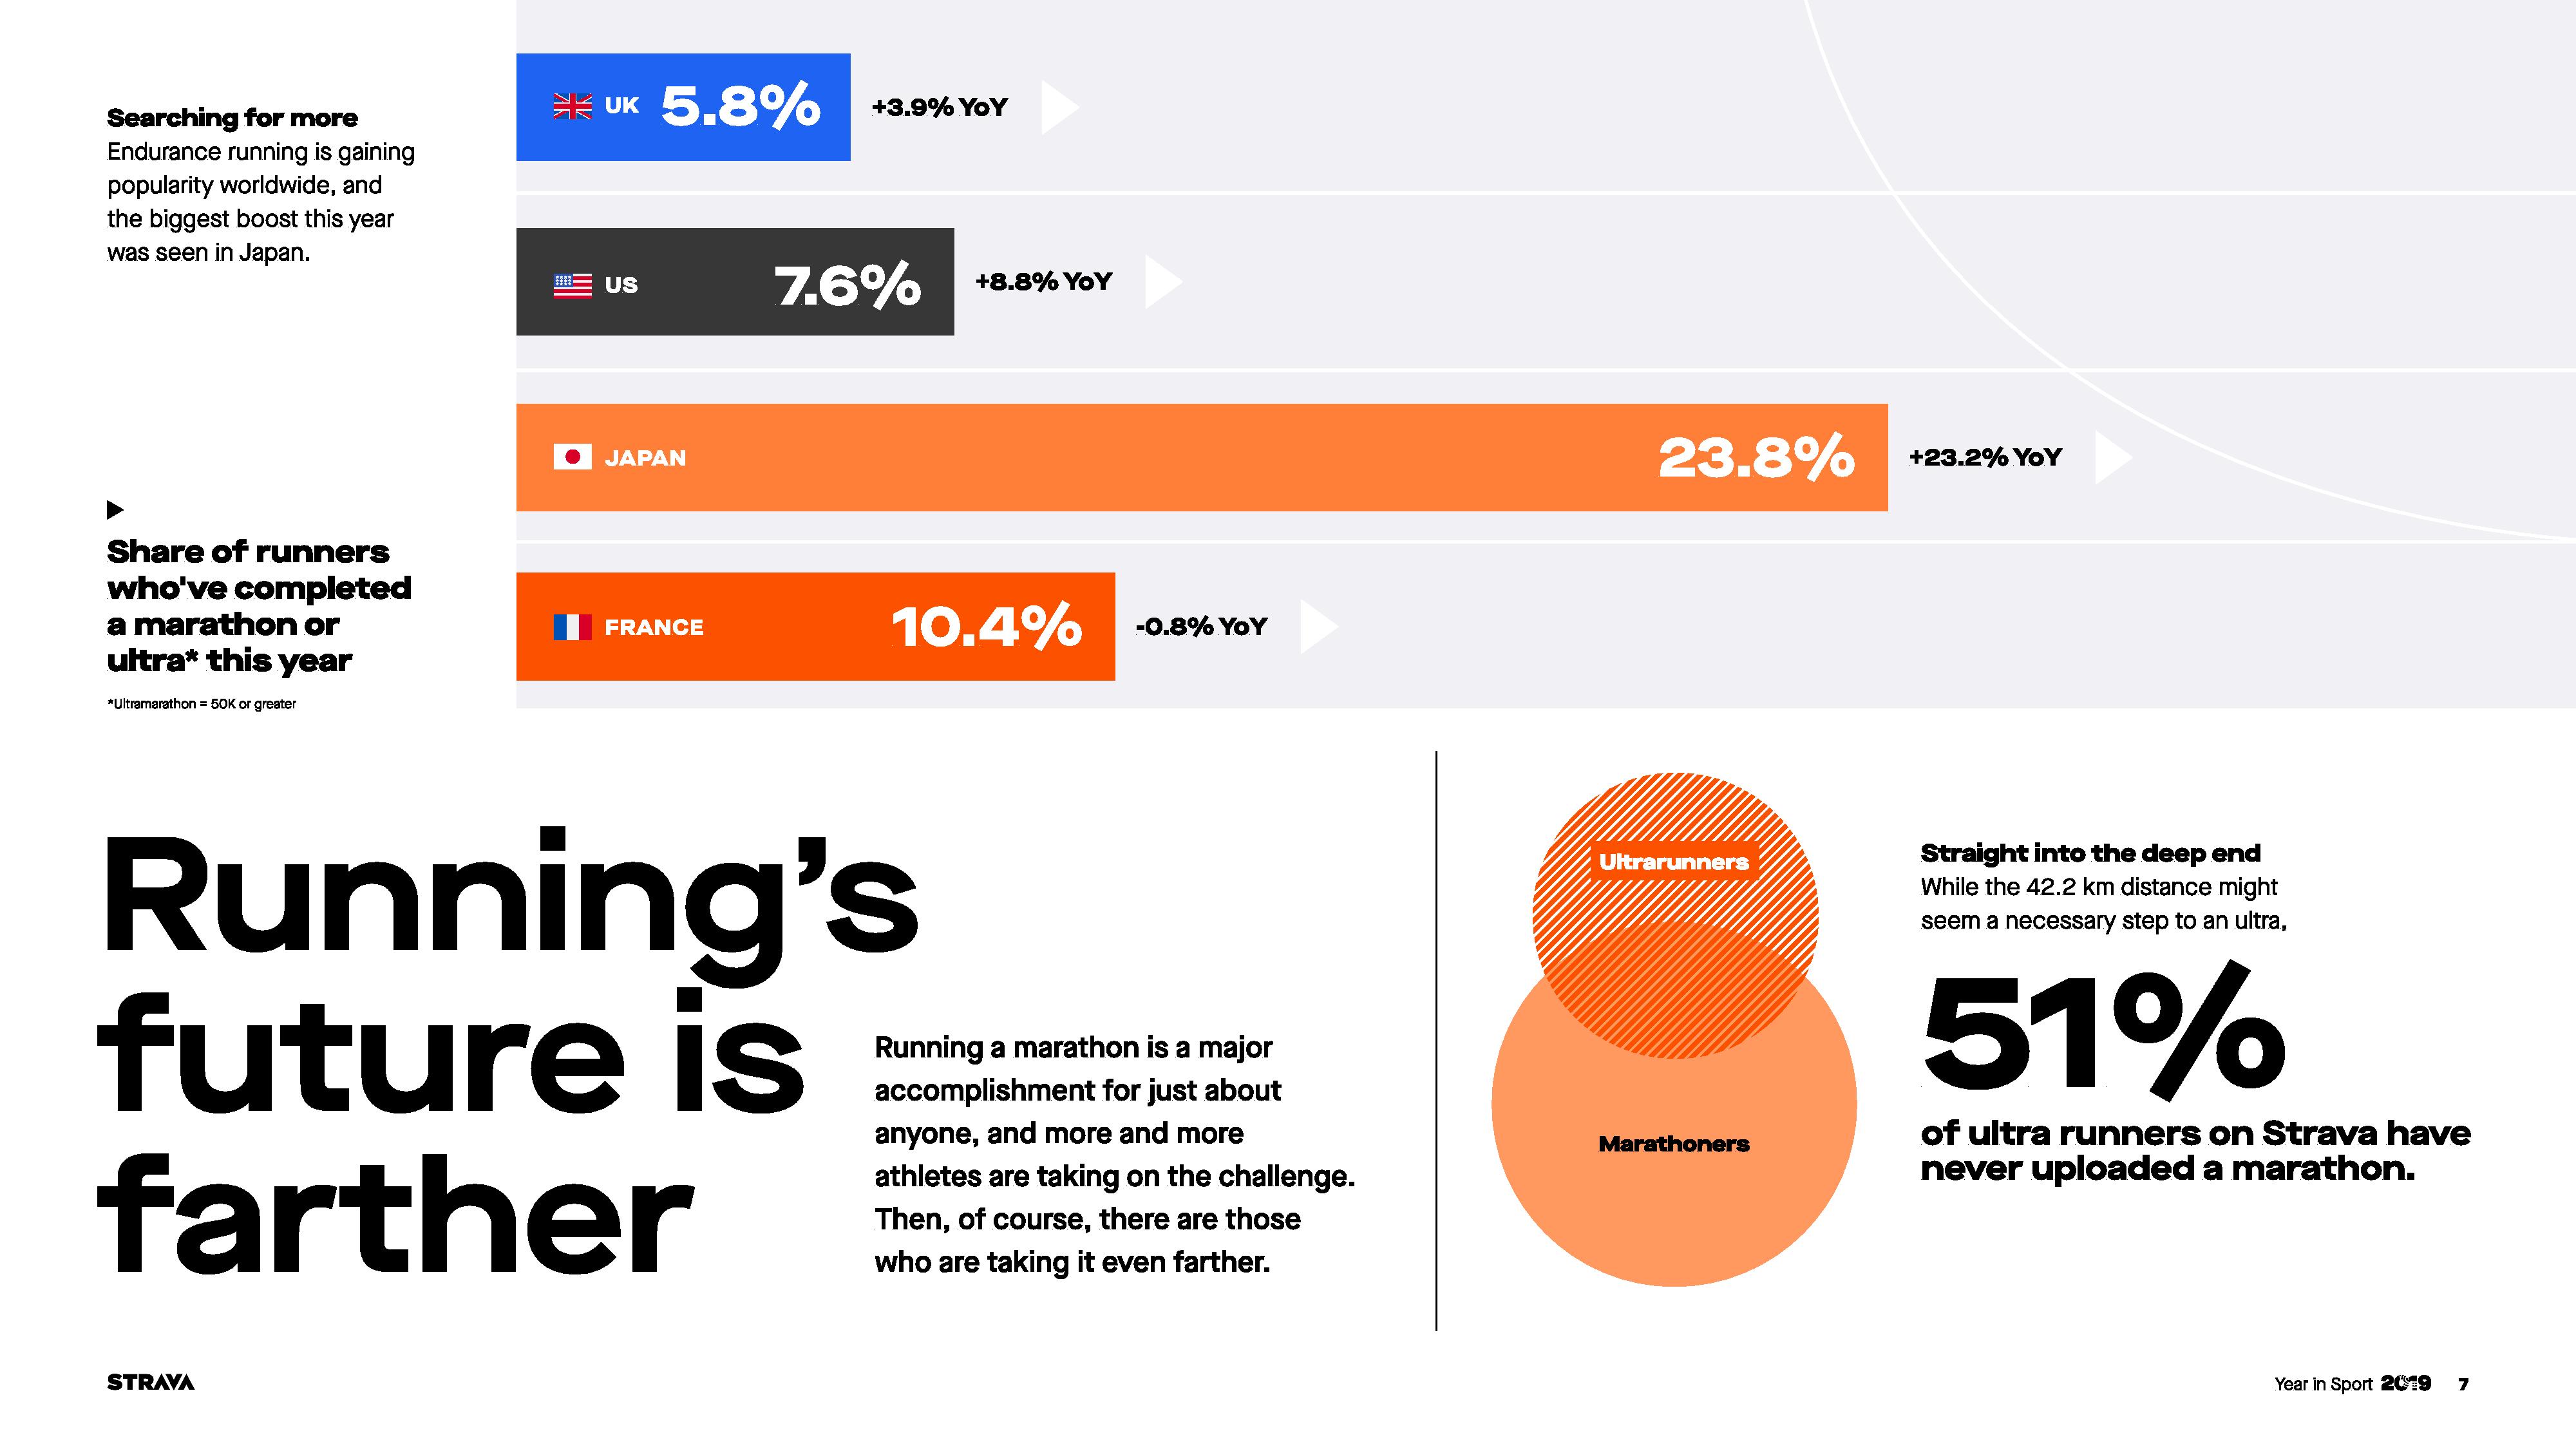
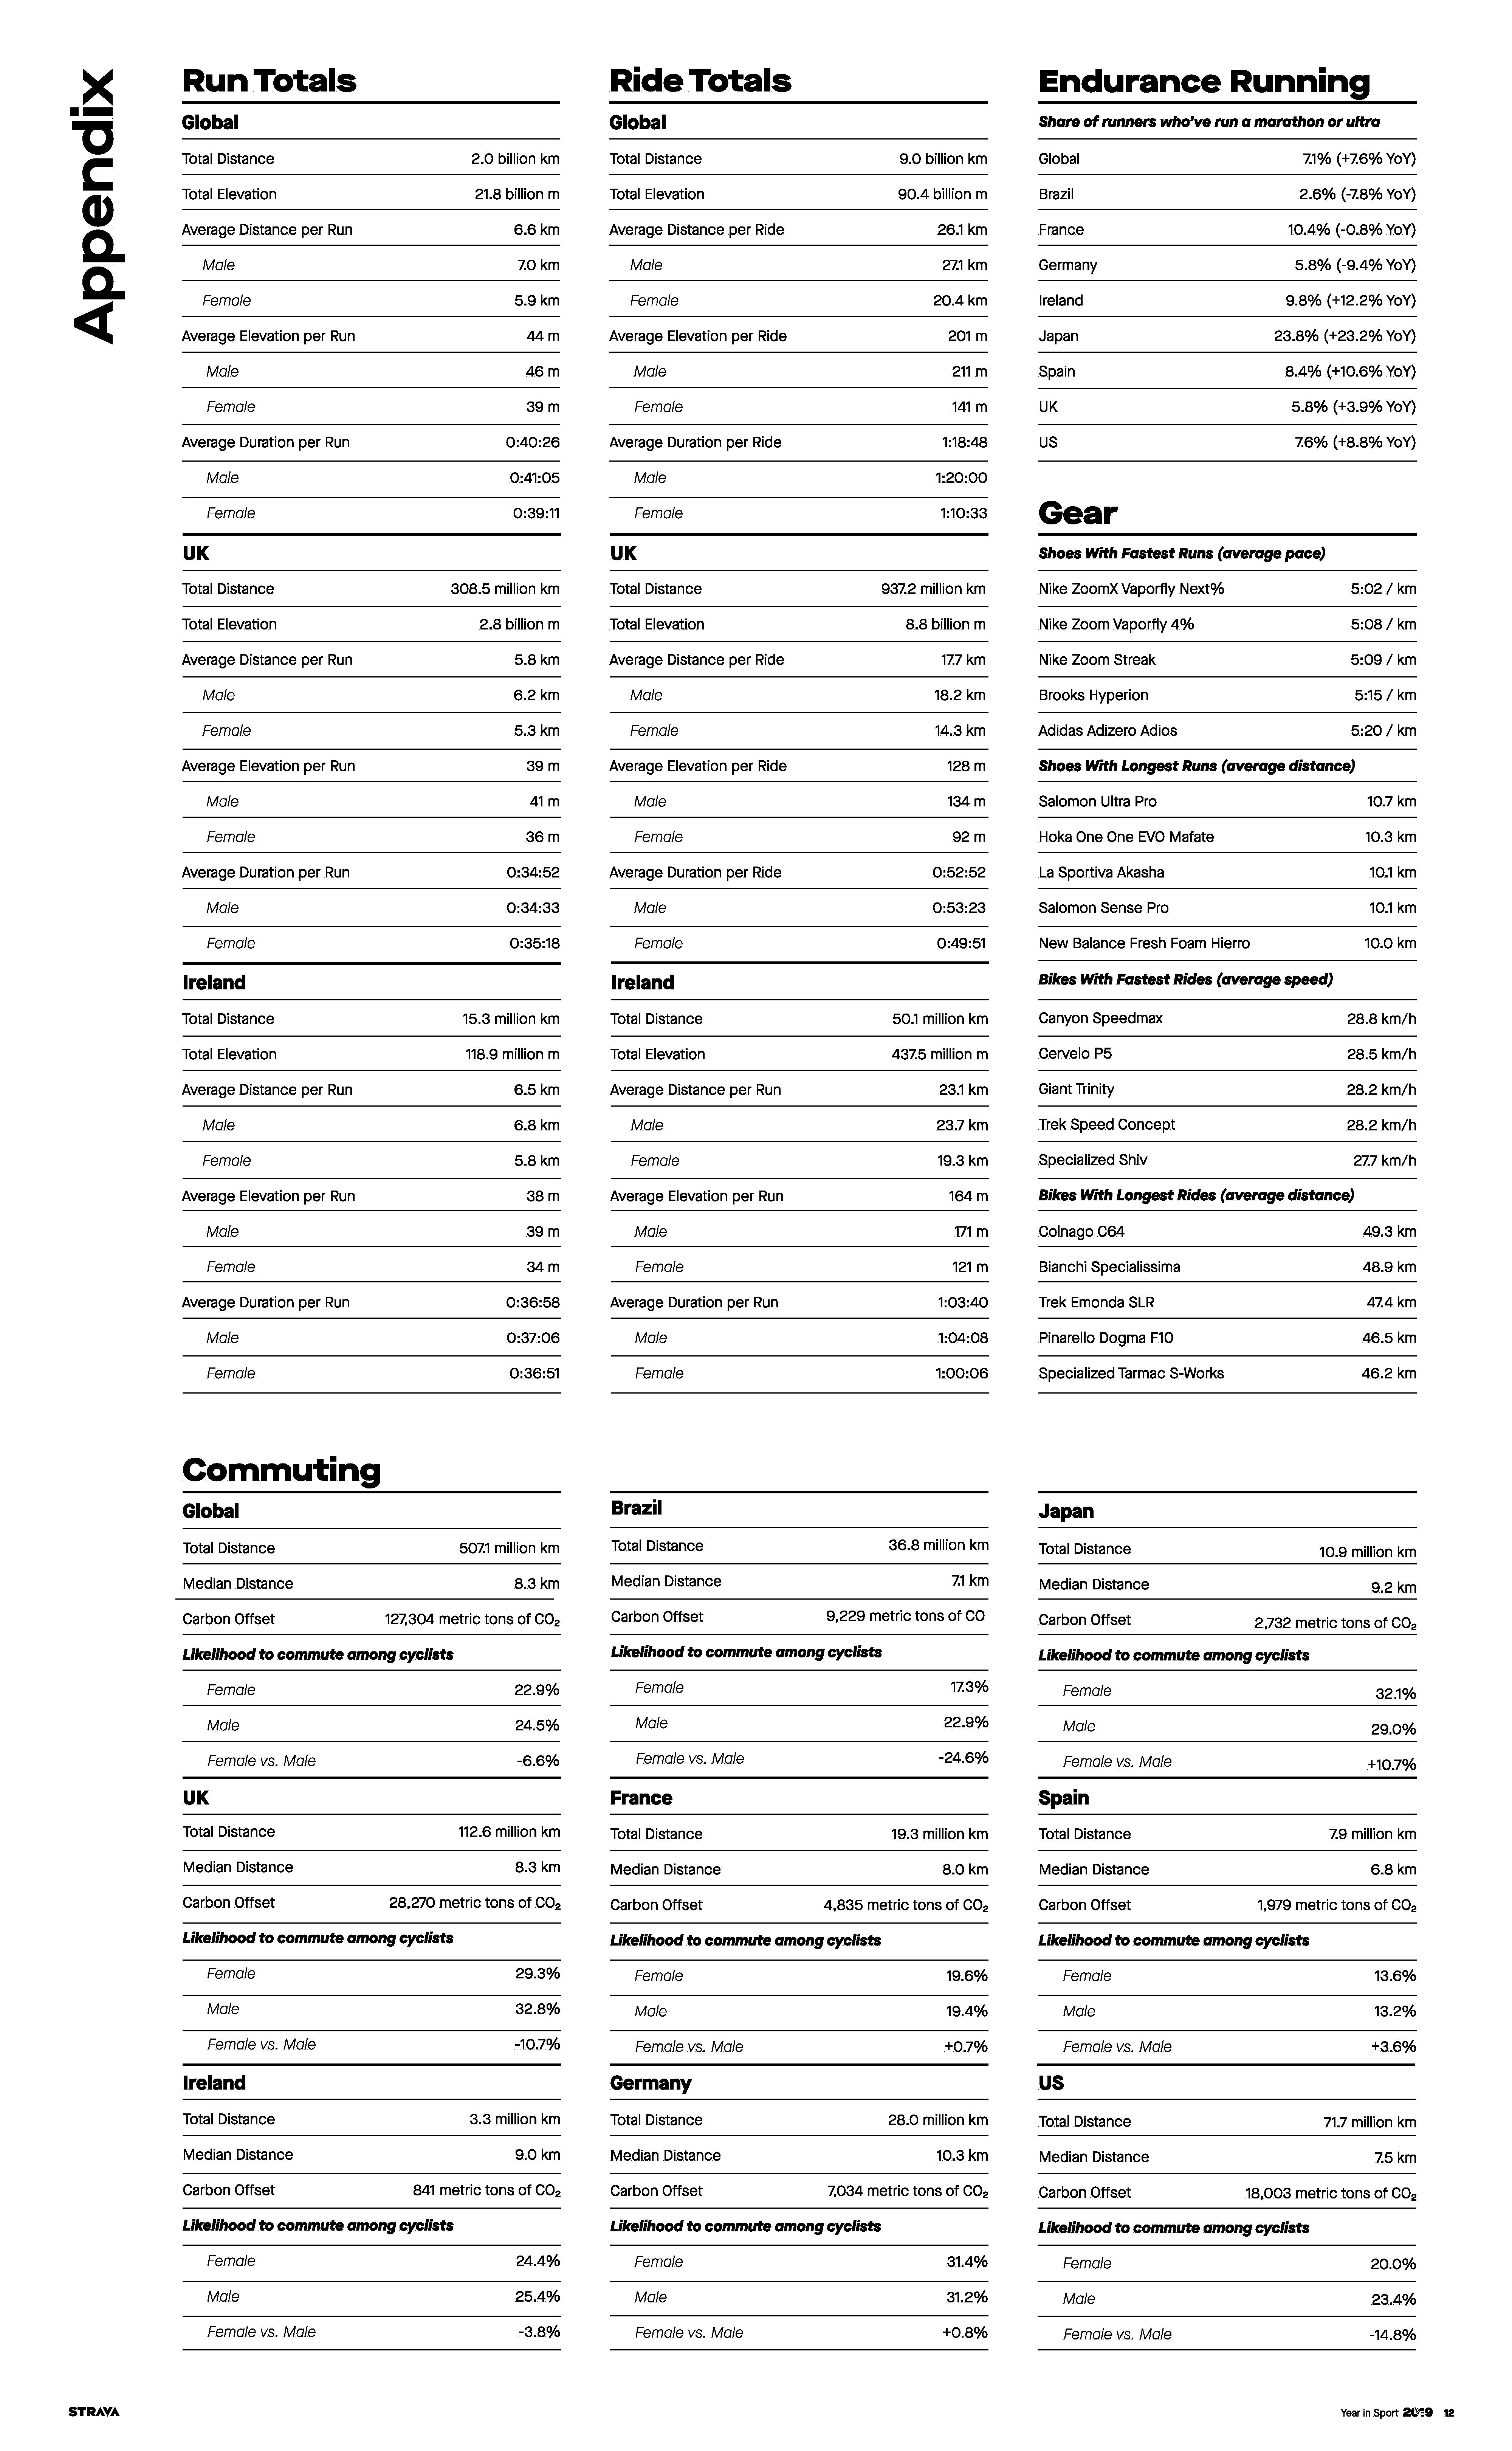
In totally unrelated news – what on earth is going on with Japan? Somehow 23.8% of runners completed a marathon or ultramarathon this year. Really? This seems like an absurdly high number. I’m sure the stats are correct, but at the same time it also tells you how little penetration into the Japanese market Strava must have. It’s clearly only attracting the most ardent of runners – as compared with US and UK share being 5.8 to 7.6% having completed a marathon.

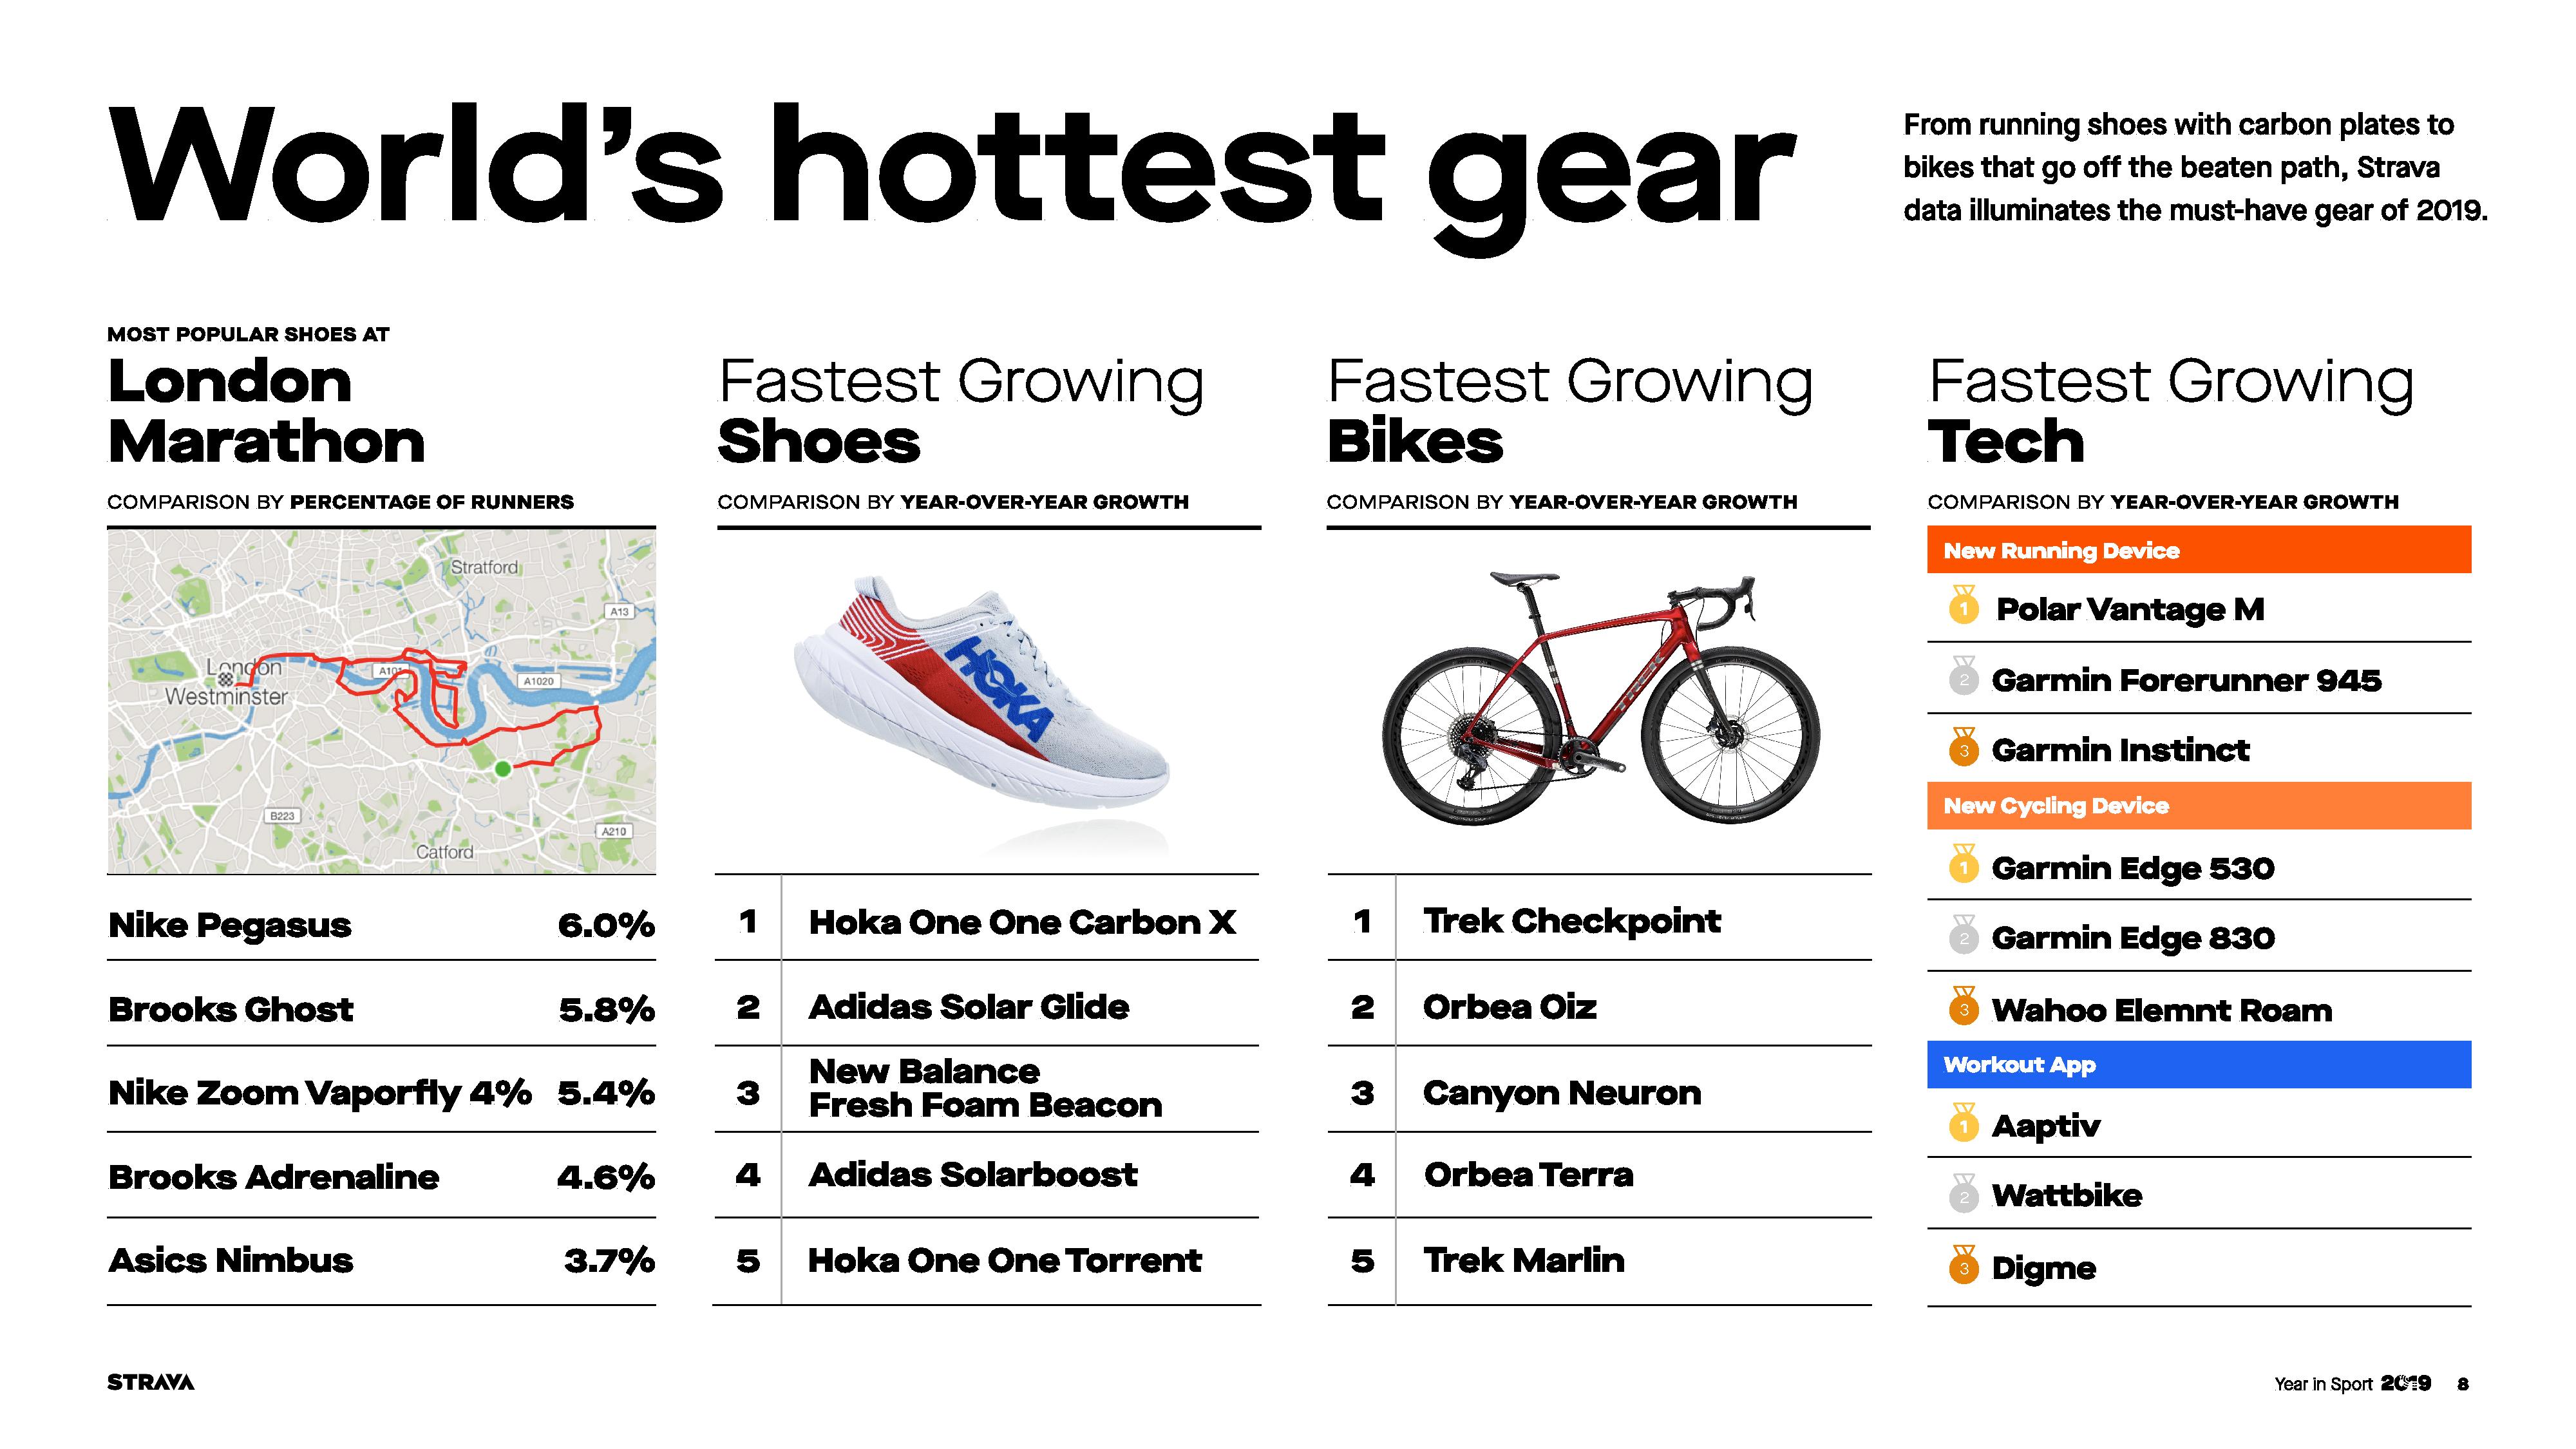
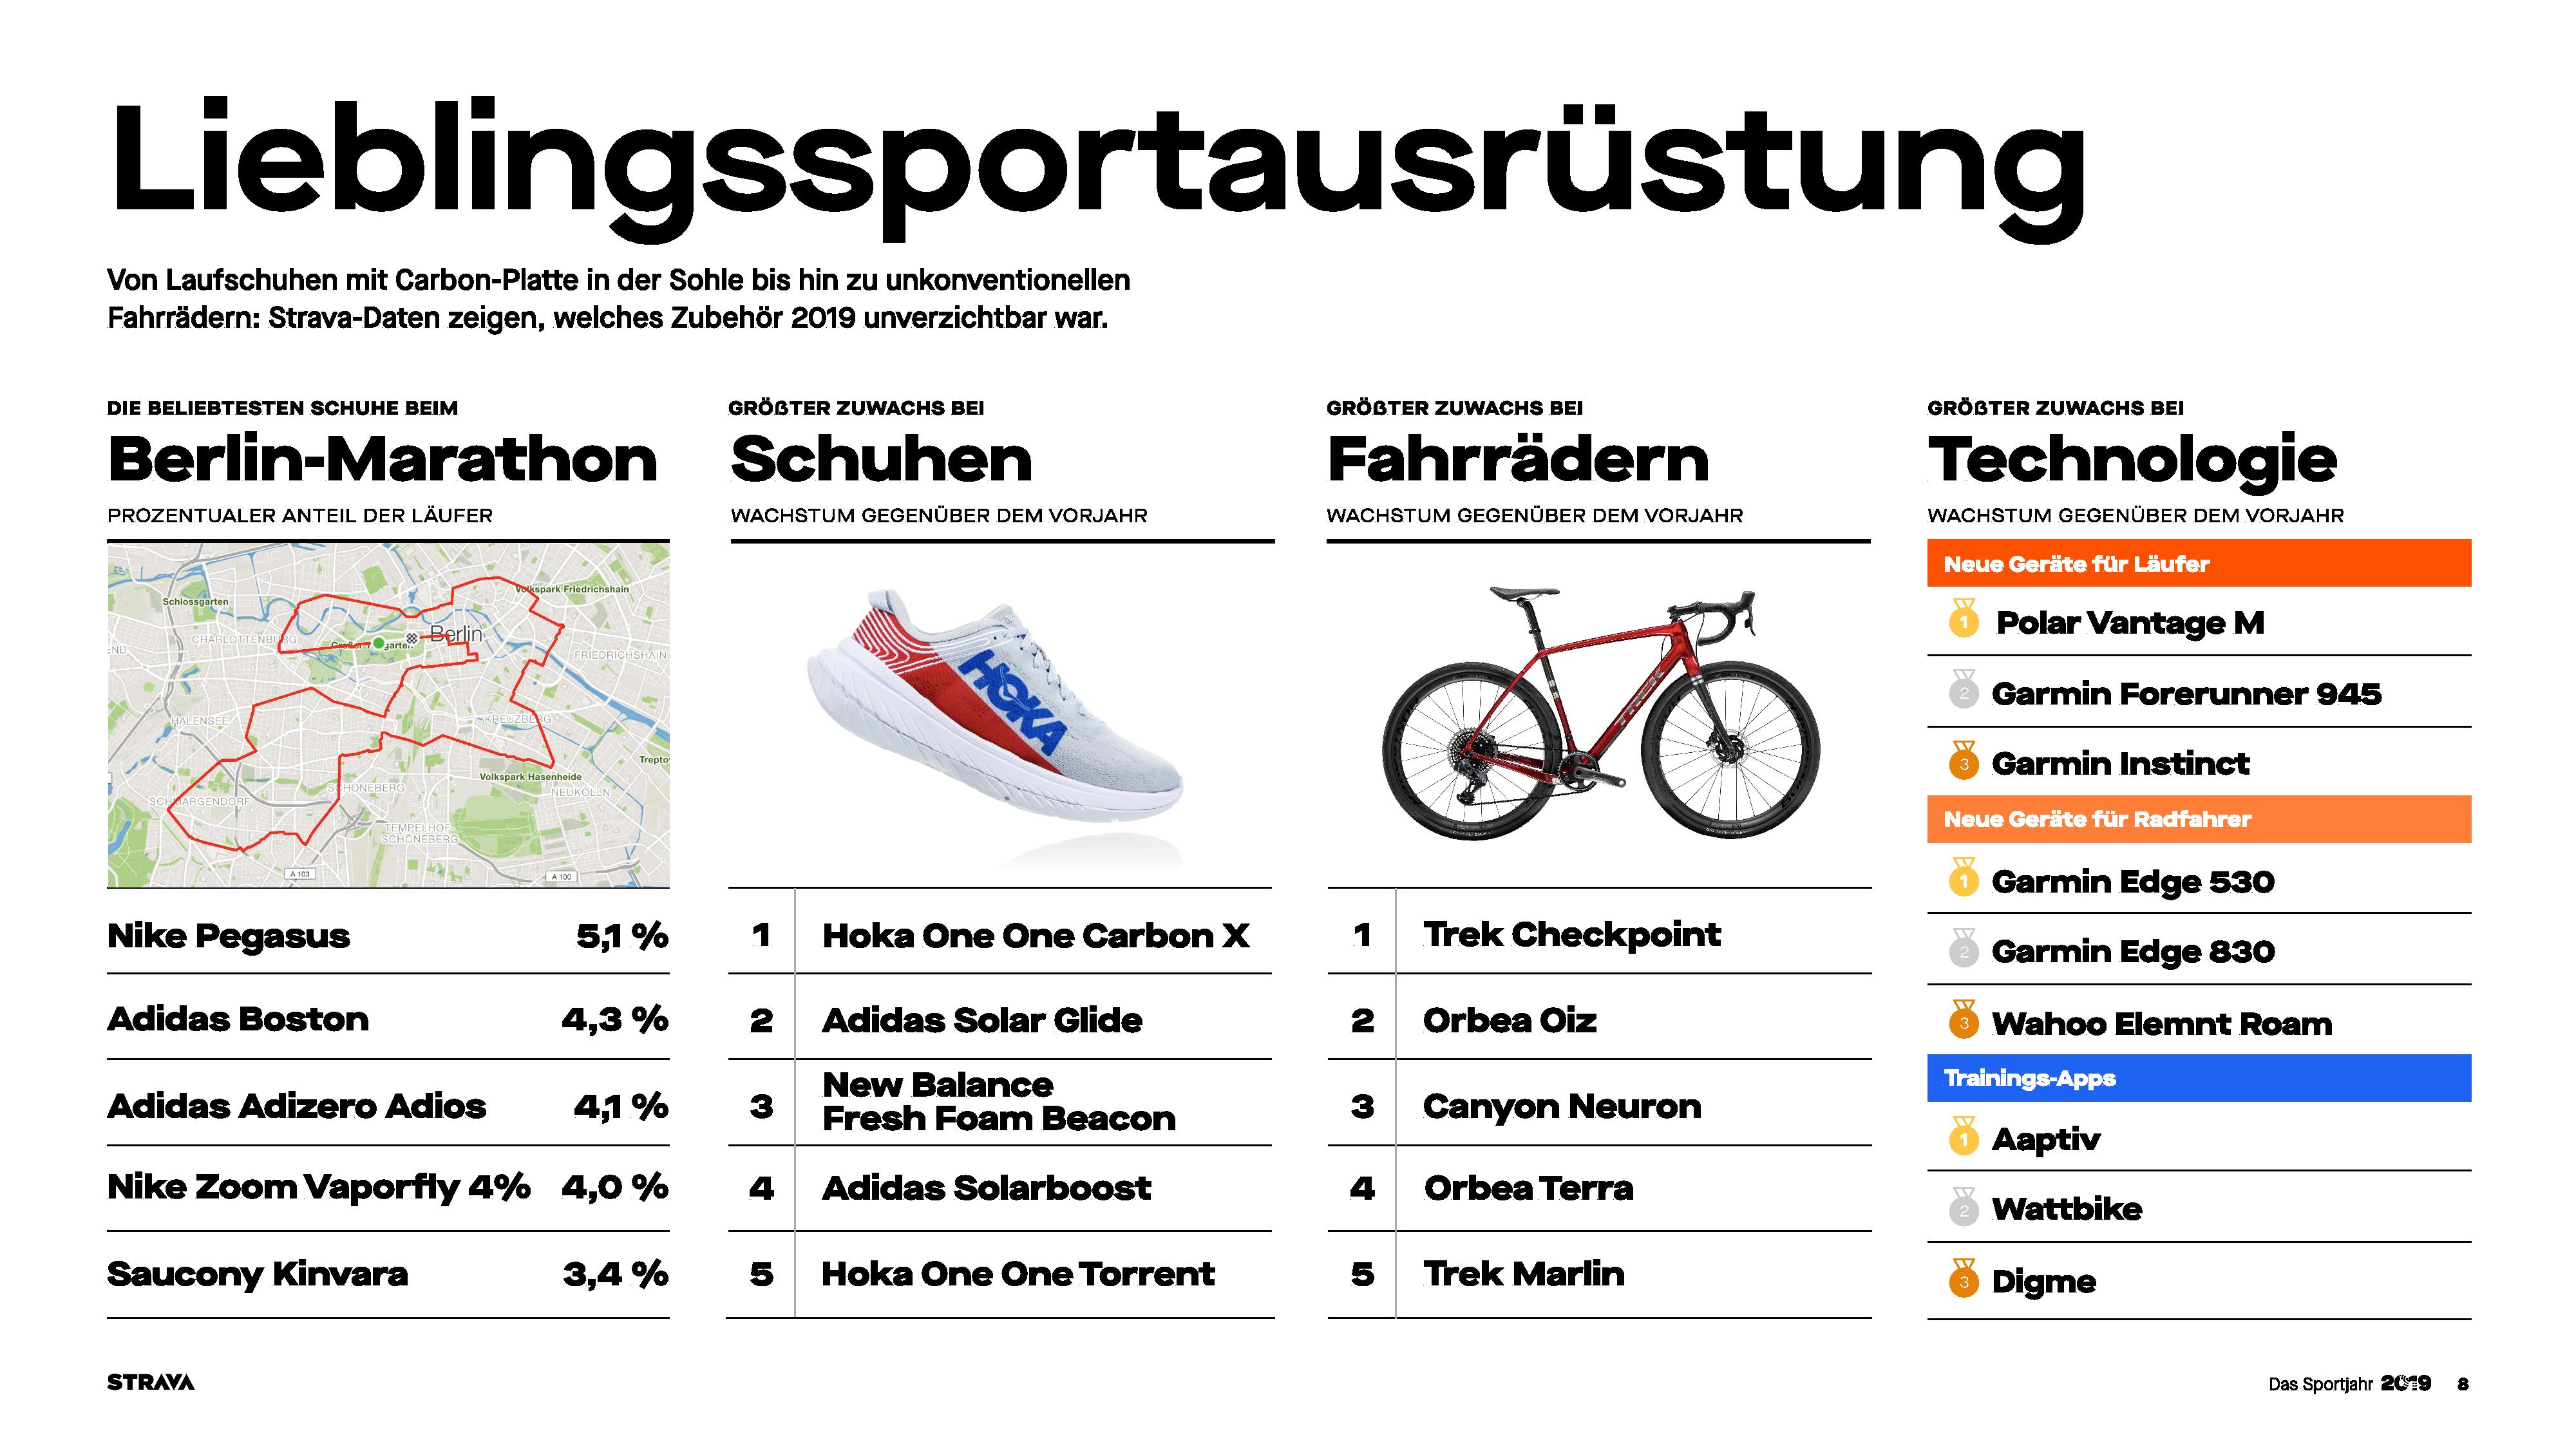
Now here’s some of the good stuff! Actual name brands. These shoes and bikes are what you can actually specify in your Strava profile. I don’t bother to update my shoes there, but my bikes are roughly correctly listed (I have a catch-all though for ‘Random Rental Bikes’, when travelling).
There’s even a section on the side with actual device listings. It’s almost like someone was channeling their inner DCR!

Except there’s a huge catch. See that little text that says “Year-over-year growth”? Well, that makes this category mostly useless. And by mostly, I mean entirely.
See, the Edge 530, 830, and ROAM all came out in 2019 (within a week of each other in late April/early May). So, their YoY growth will be any value you want, since last year was 0% share. Running is much the same. All those devices came out after Oct 1st, 2018 (when this report started). The Polar Vantage M and Garmin Instinct started shipping last November, and the FR945 in May. It’s a peculiar way to present the data, since a far more useful would be to show that overwhelmingly old devices lead the way.
But that probably would upset partners. The way they’ve shown the data here basically aims to show brand diversity. As we know from numerous stats over the years (and this year too), otherwise this would overwhelmingly show Garmin and Apple domination. Not to mention that a non-trivial number of people upload their Apple Watch data with 3rd party apps that Strava doesn’t reflect as being Apple Watches.
Which is ultimately how we get to workout apps like Wattbike and Digme making the top 3 apps. Of course they aren’t. We all know that. They’re nowhere near that. But when viewed in the lens of ‘new things of sorta-2019 with 0 as a starting point’, then I guess.
Now, to Strava’s credit here – they did put useful information around the bikes and shoes. In this case in the appendix they listed the average ride speeds for the top 5 bikes. Of course, there’s many ways you can slice and dice this.

For example, one would probably point out that the Canyon Speedmax is far more affordable/accessible in Europe than the US. And unless you live near a national park or similar land in the US, it’s likely that your rides will have more stoplights than many places in Europe, where there tends to be less suburban sprawl. Meaning, once you’re out riding unobstructed roads you’re out (aside from the fact that bike infrastructure tends to be far better in Europe).
I’m sure some people could dive into the nuances of that all day long. But still, it’s cool stuff to see.
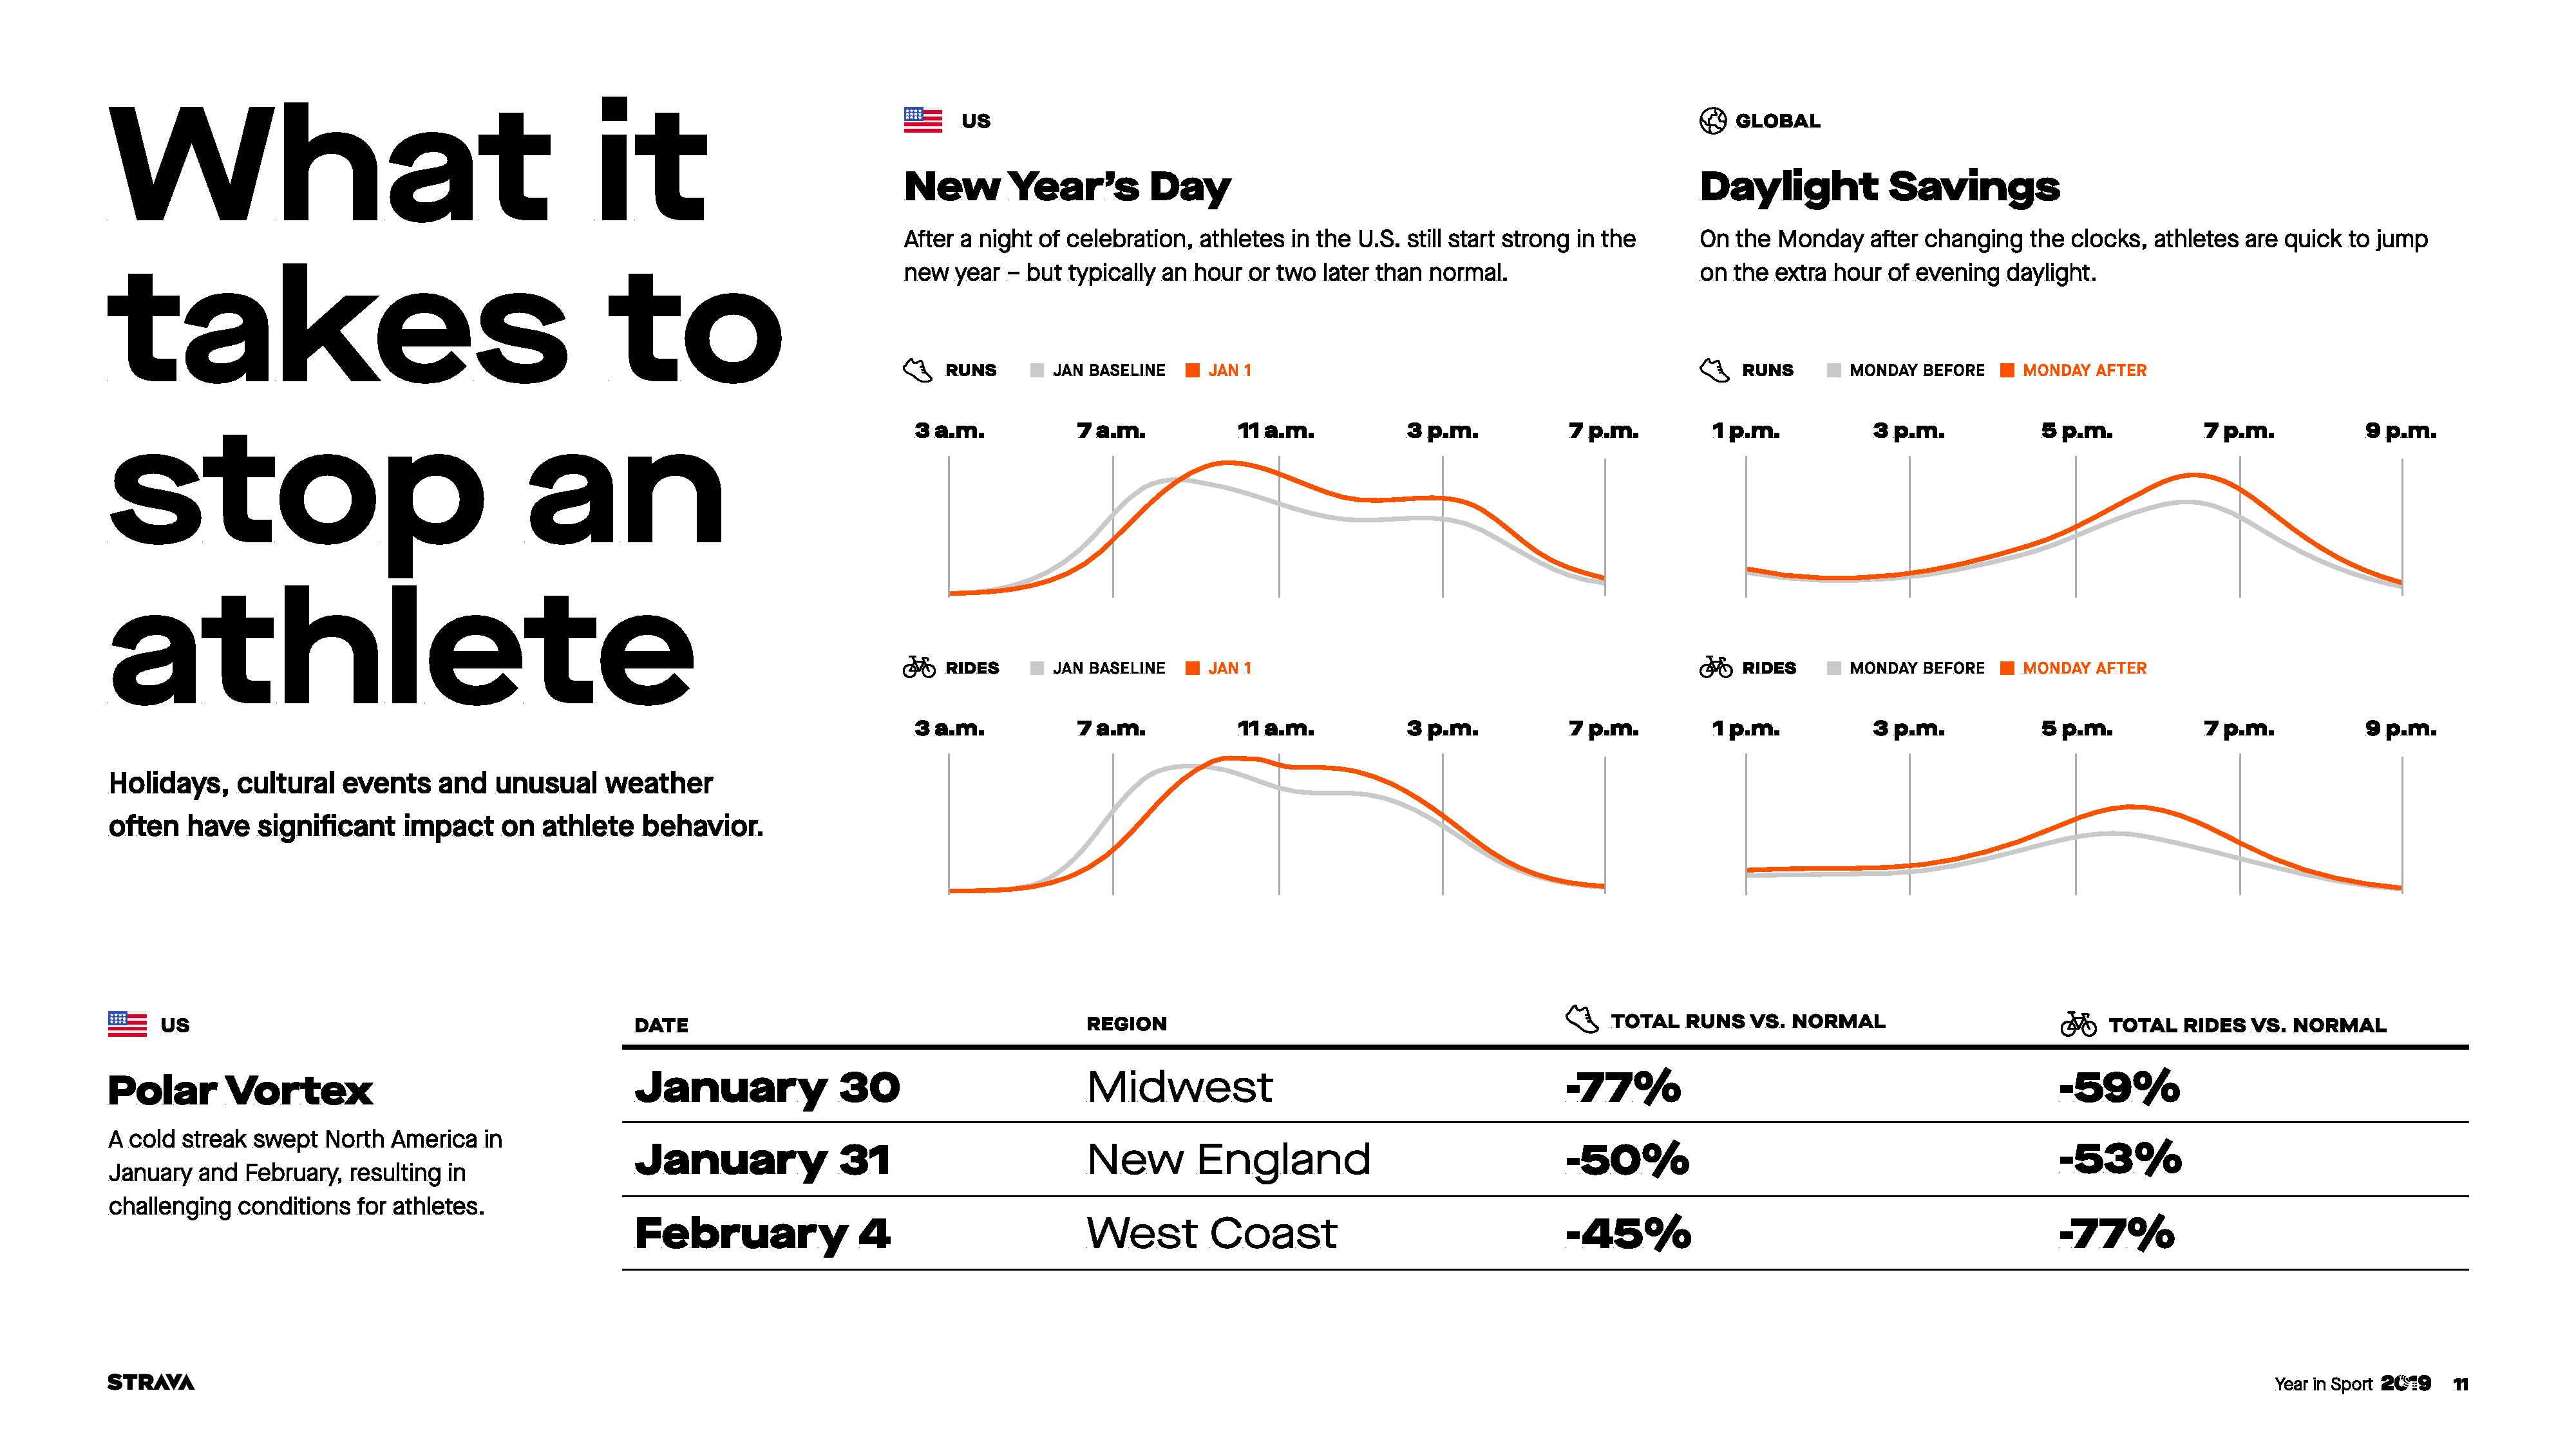
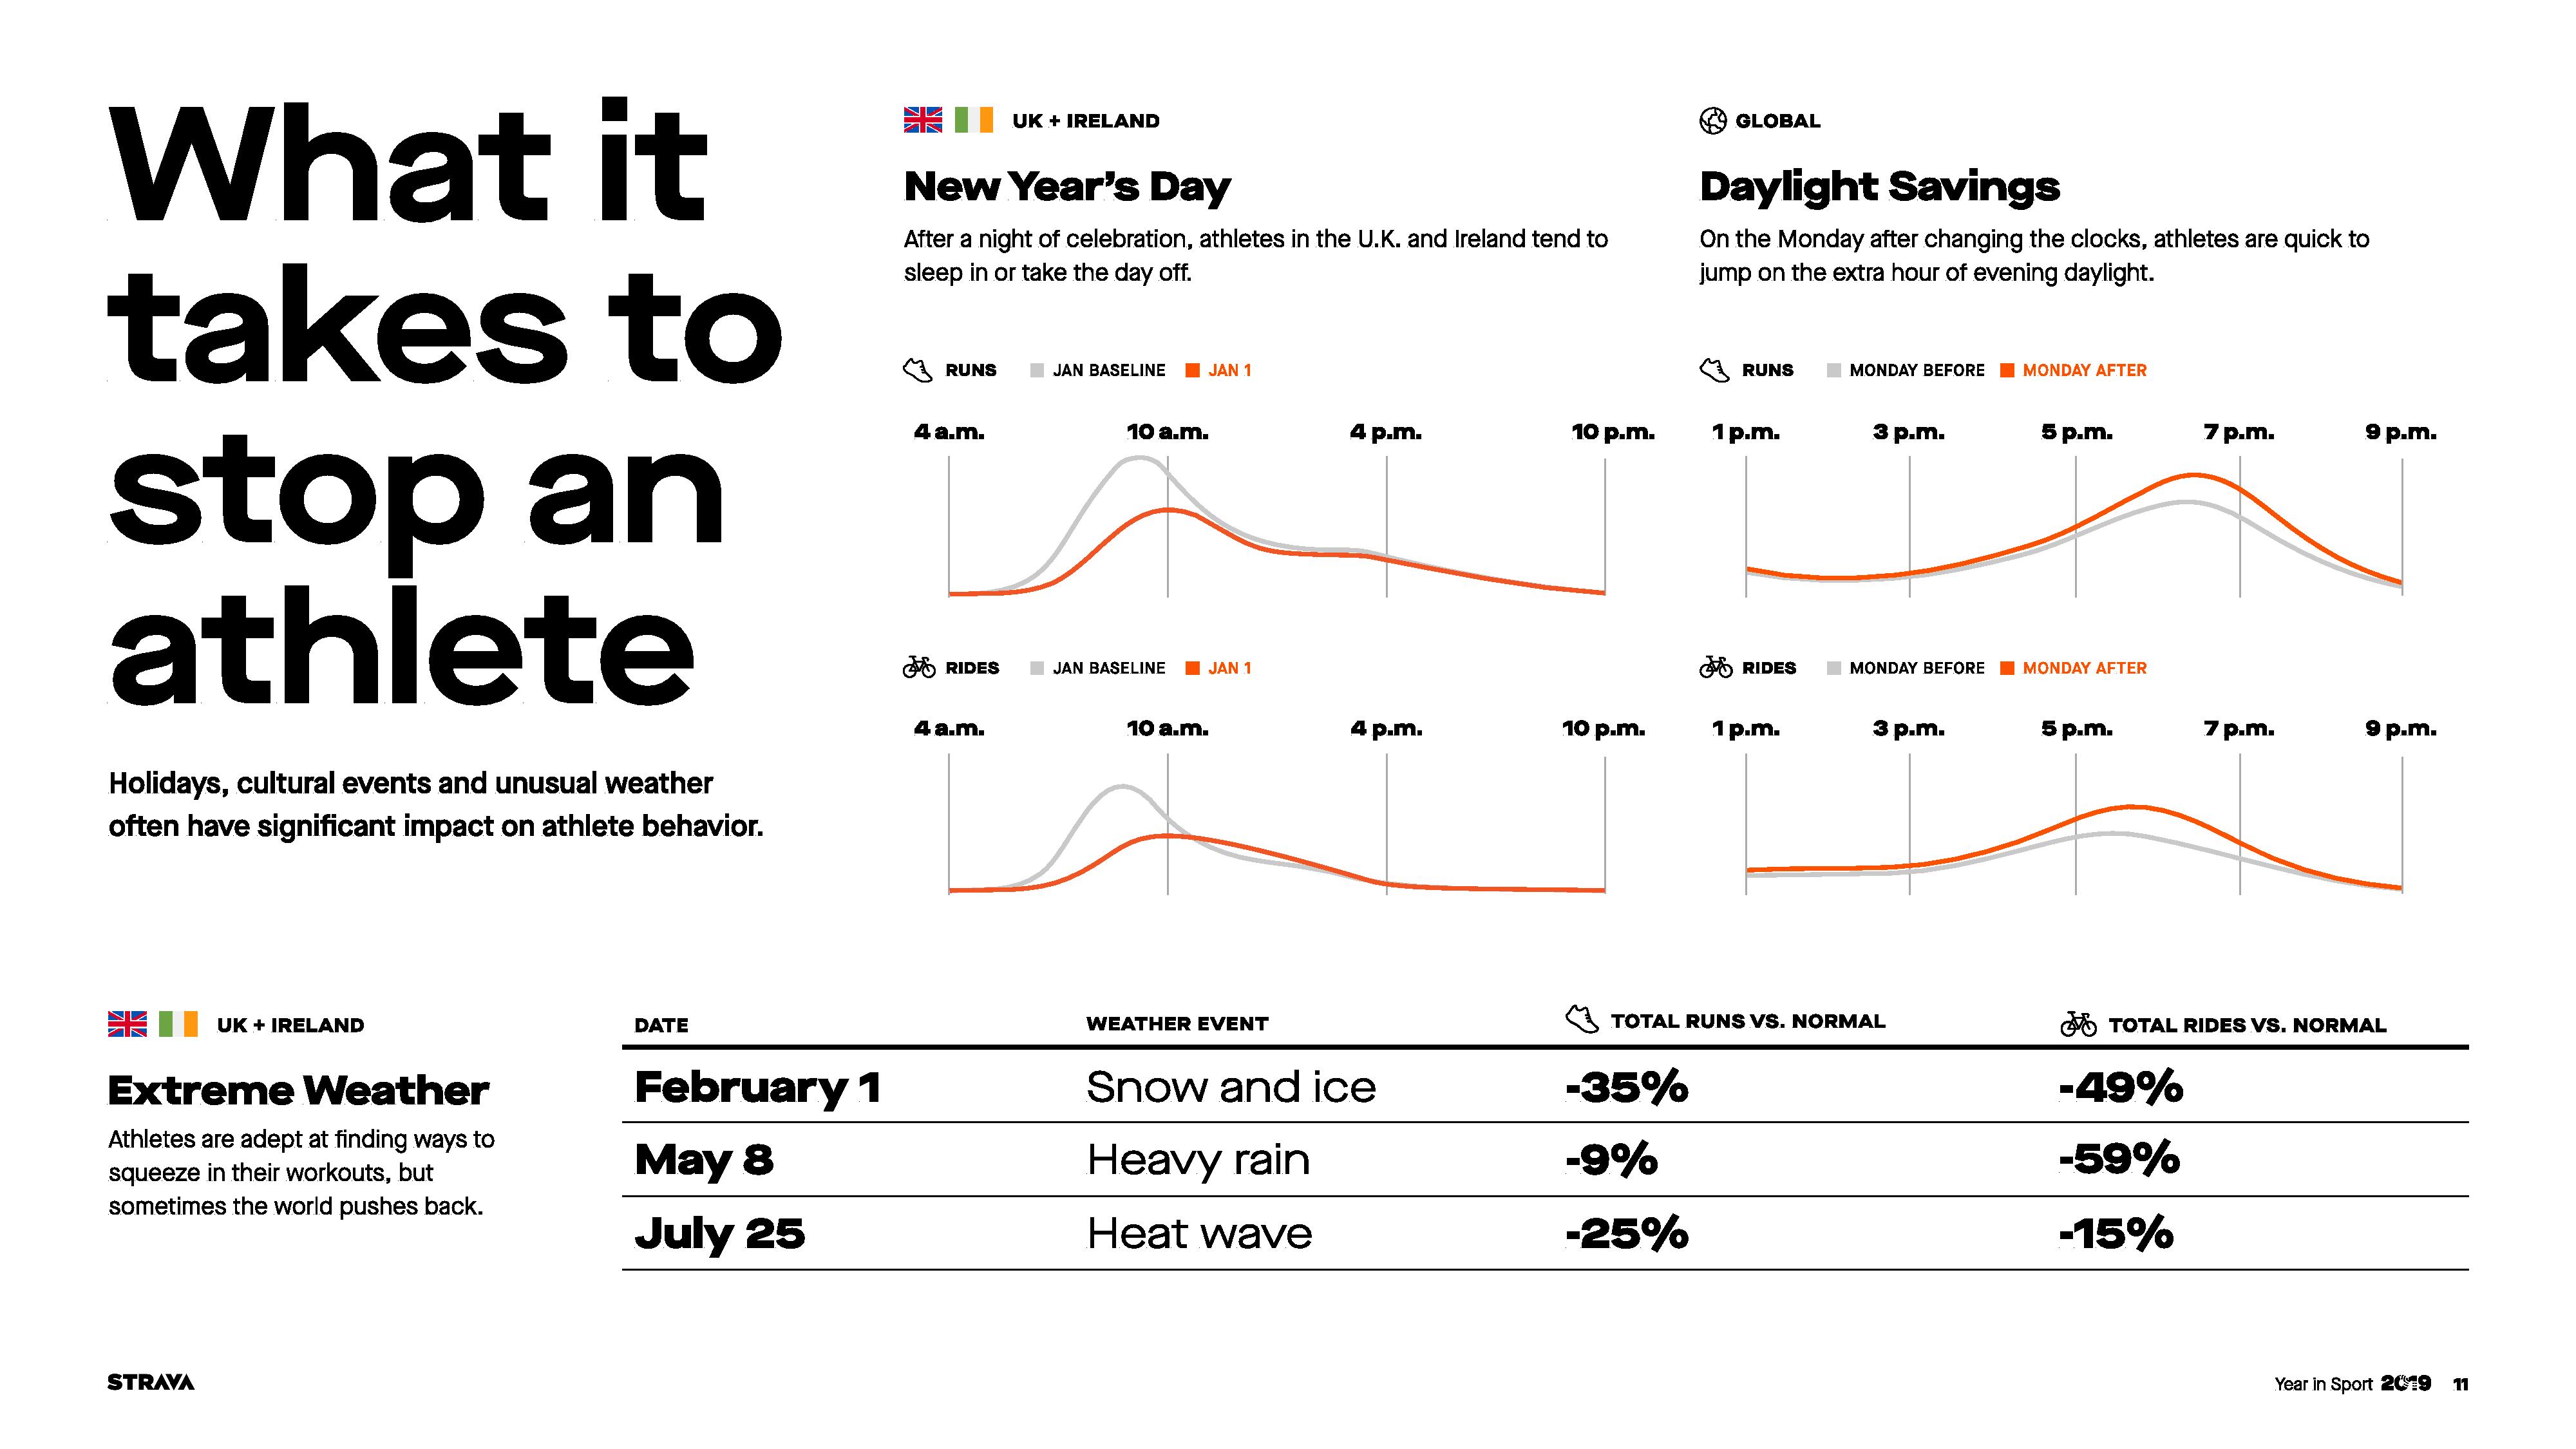
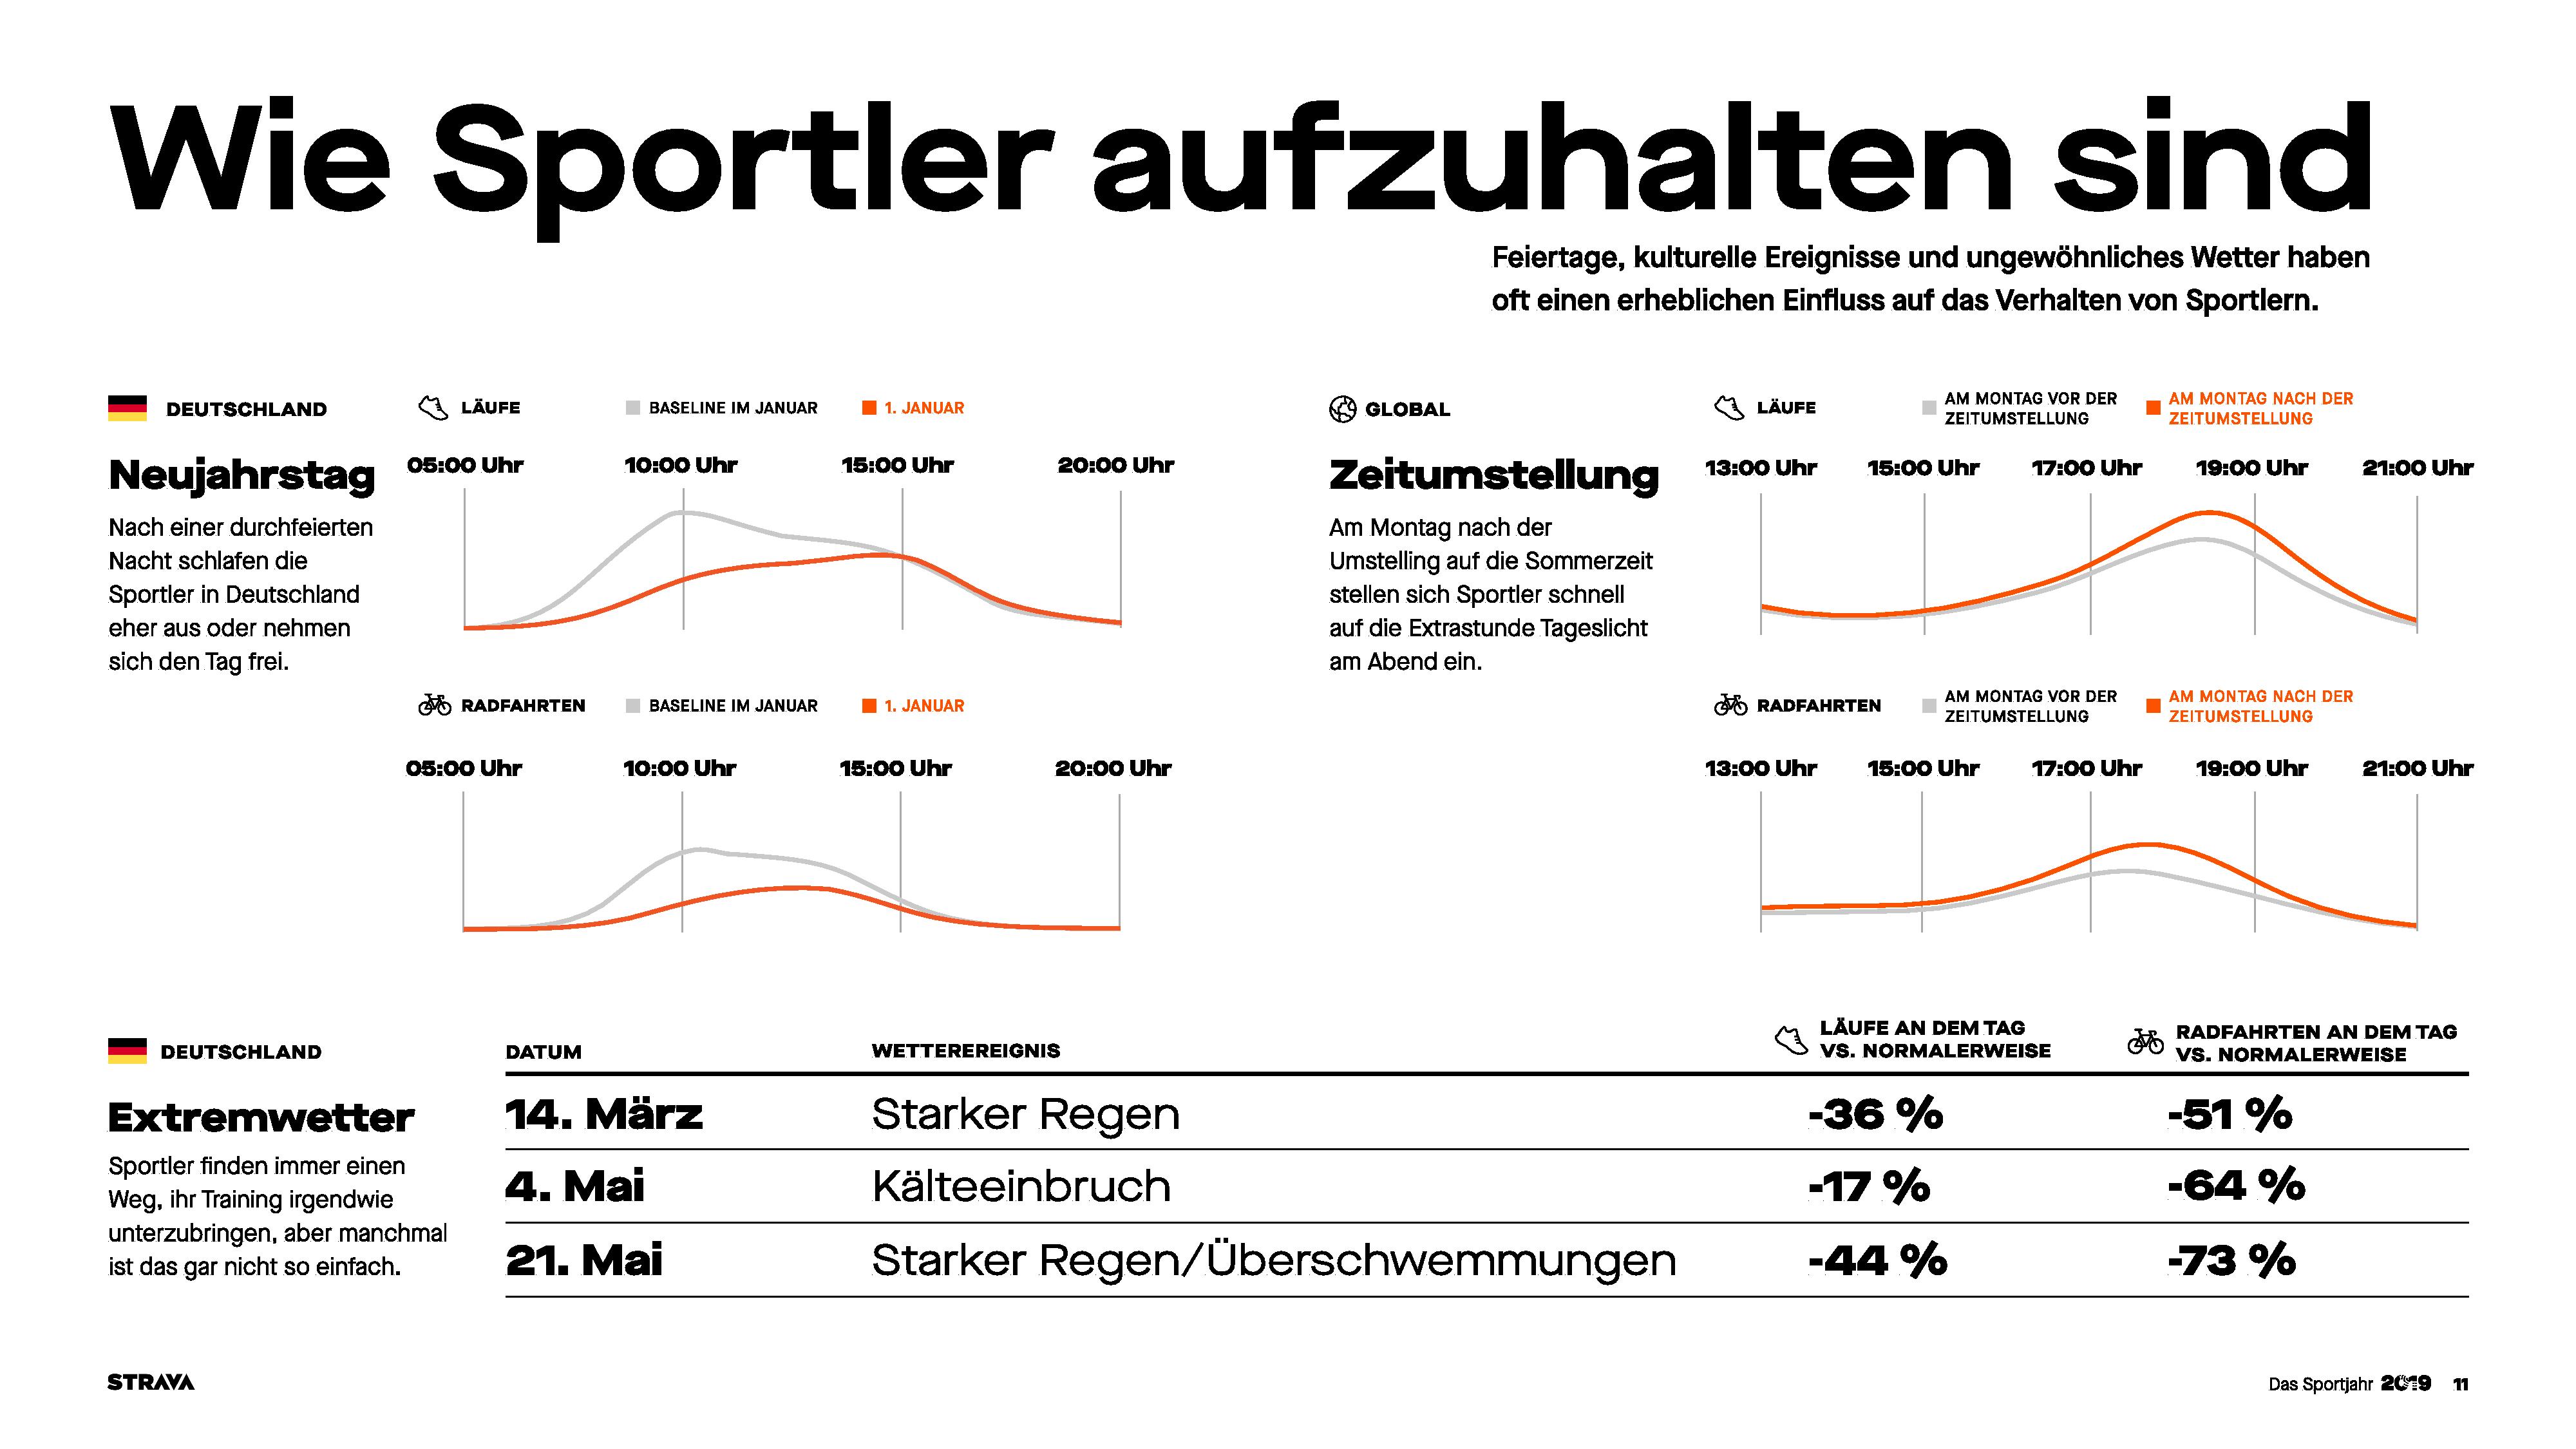
Switching topics entirely – we’ve got got the hangover. It’s funny to see how much later people workout on January 1st after a night partying than the baseline for the rest of January. Inversely, when we gain an hour for daylight savings, many of us (certainly me) quickly shift to later rides and runs.

Note however, this apparently doesn’t apply to you folks in the UK & Ireland. You appear to party much harder than the US folks and simply give up on working out the next day:

Which is exactly what the French do as well:

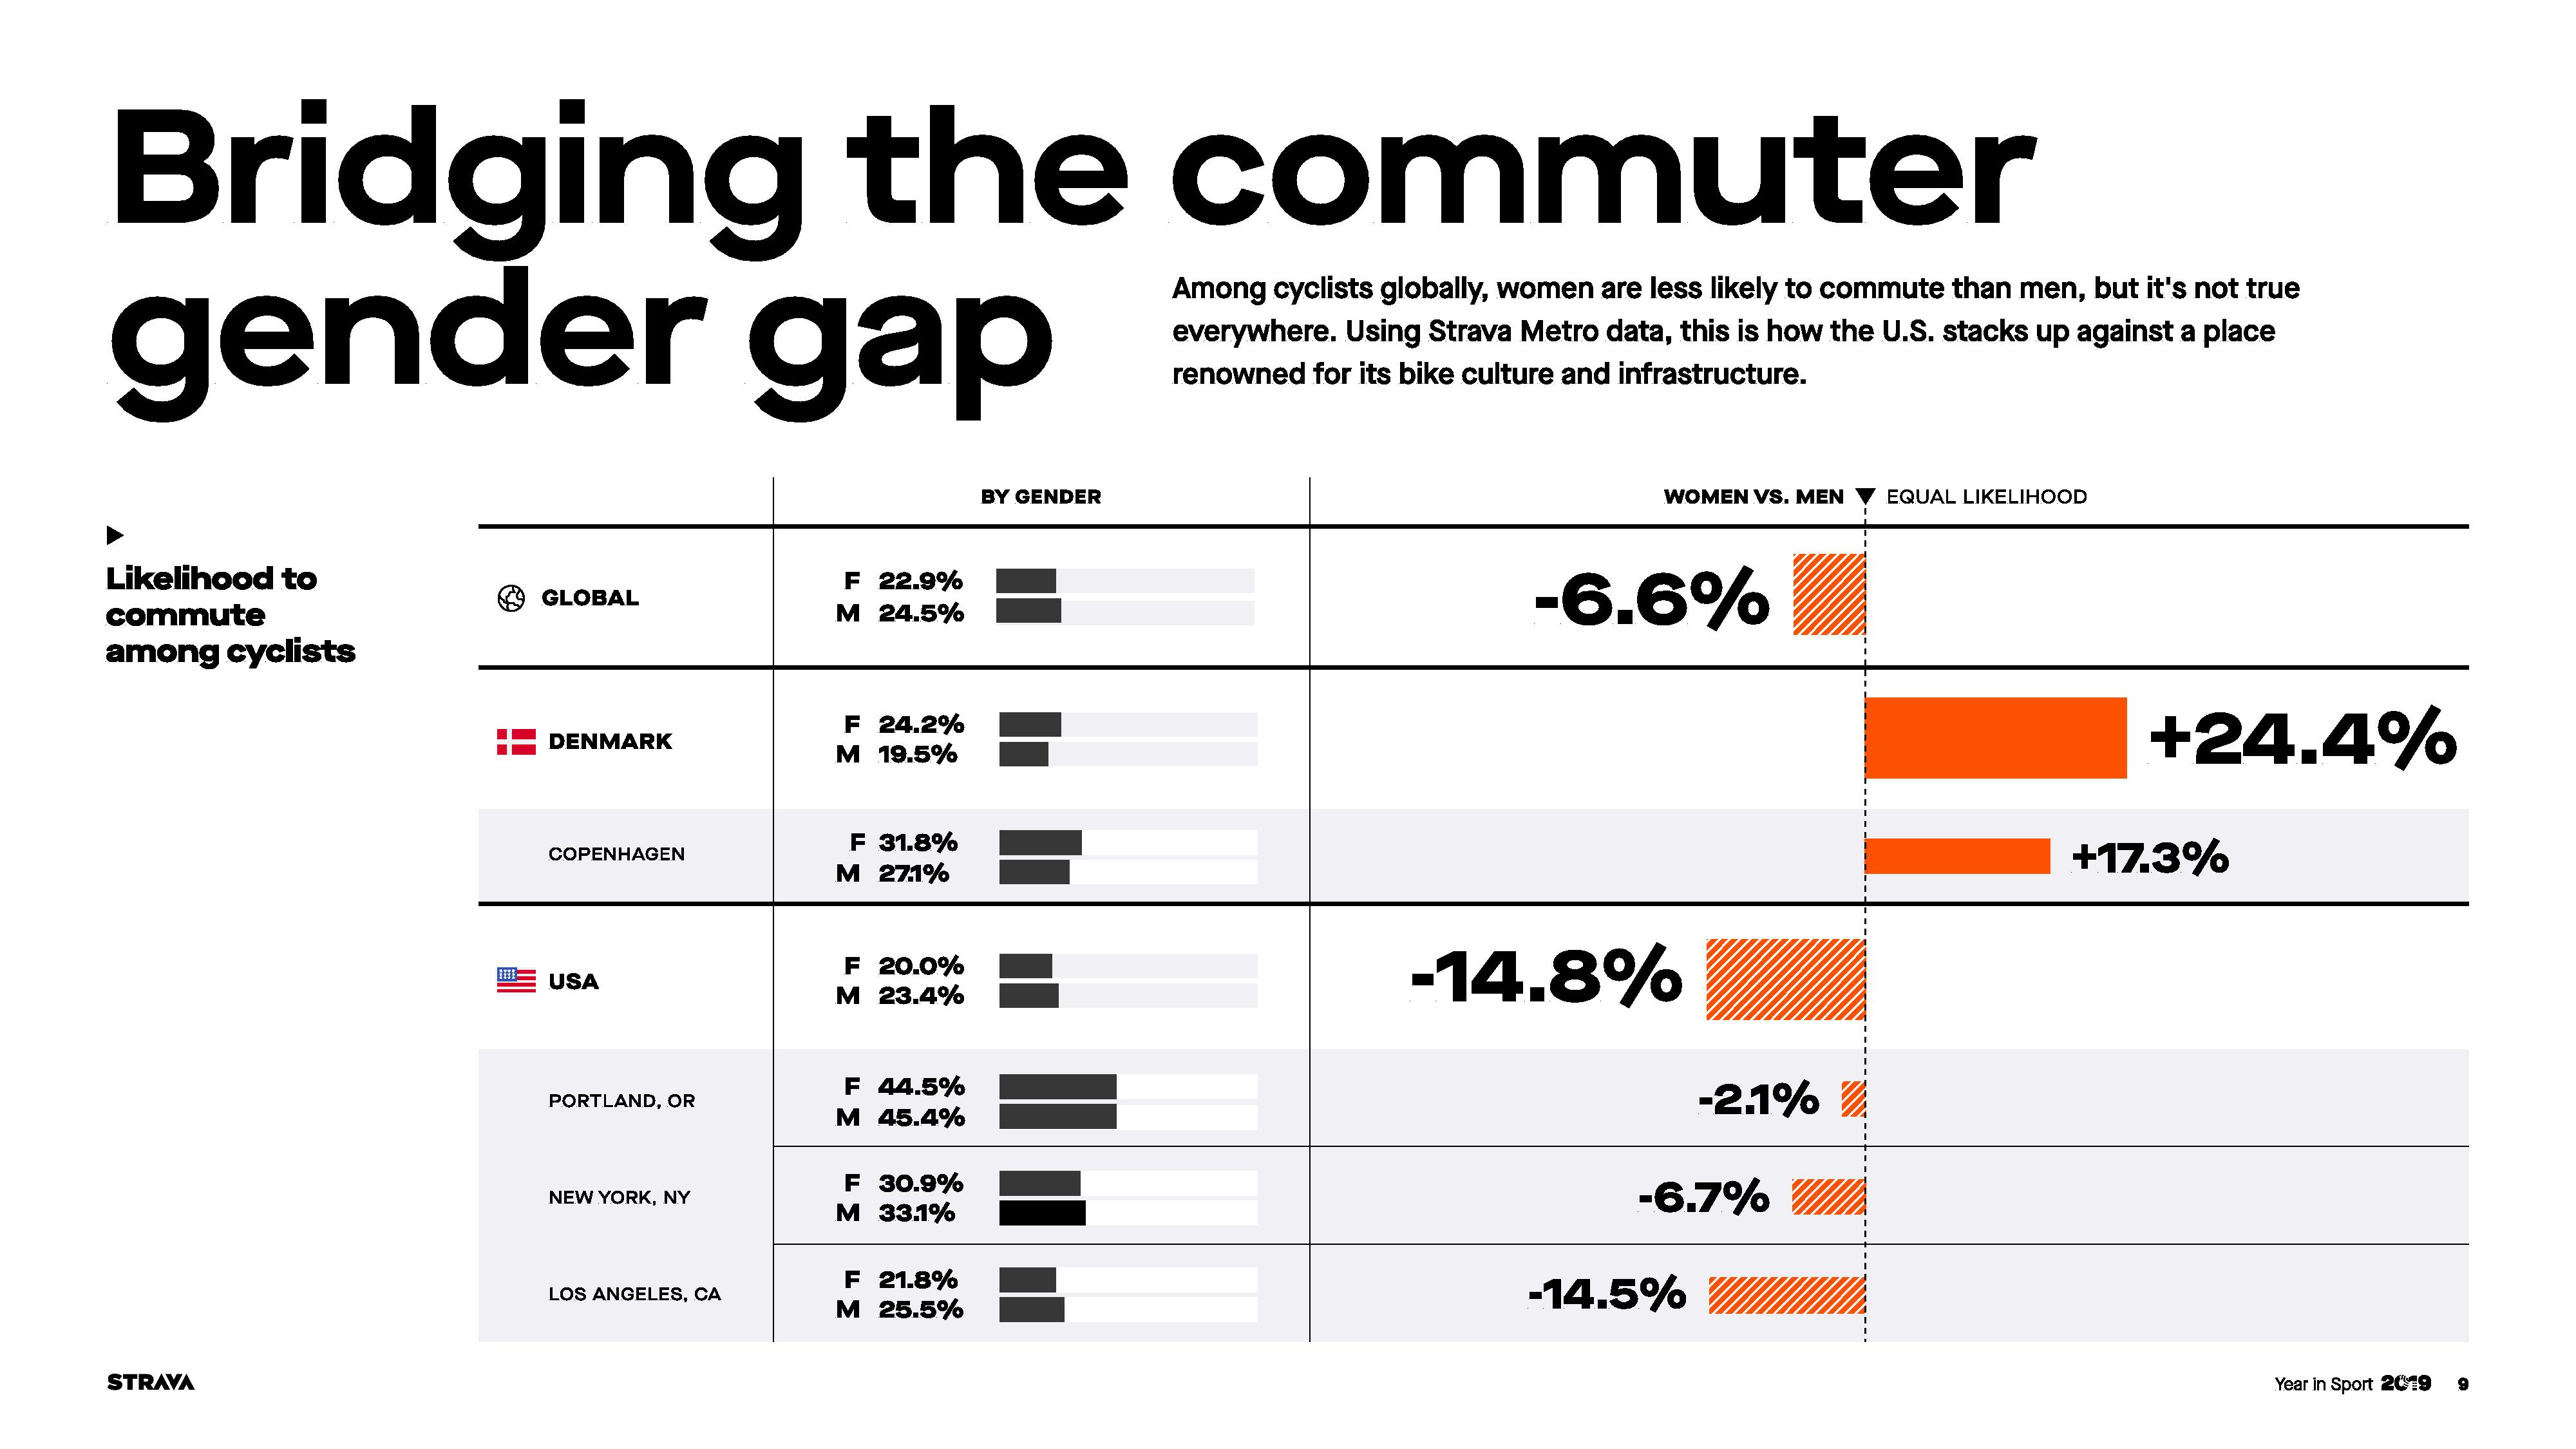
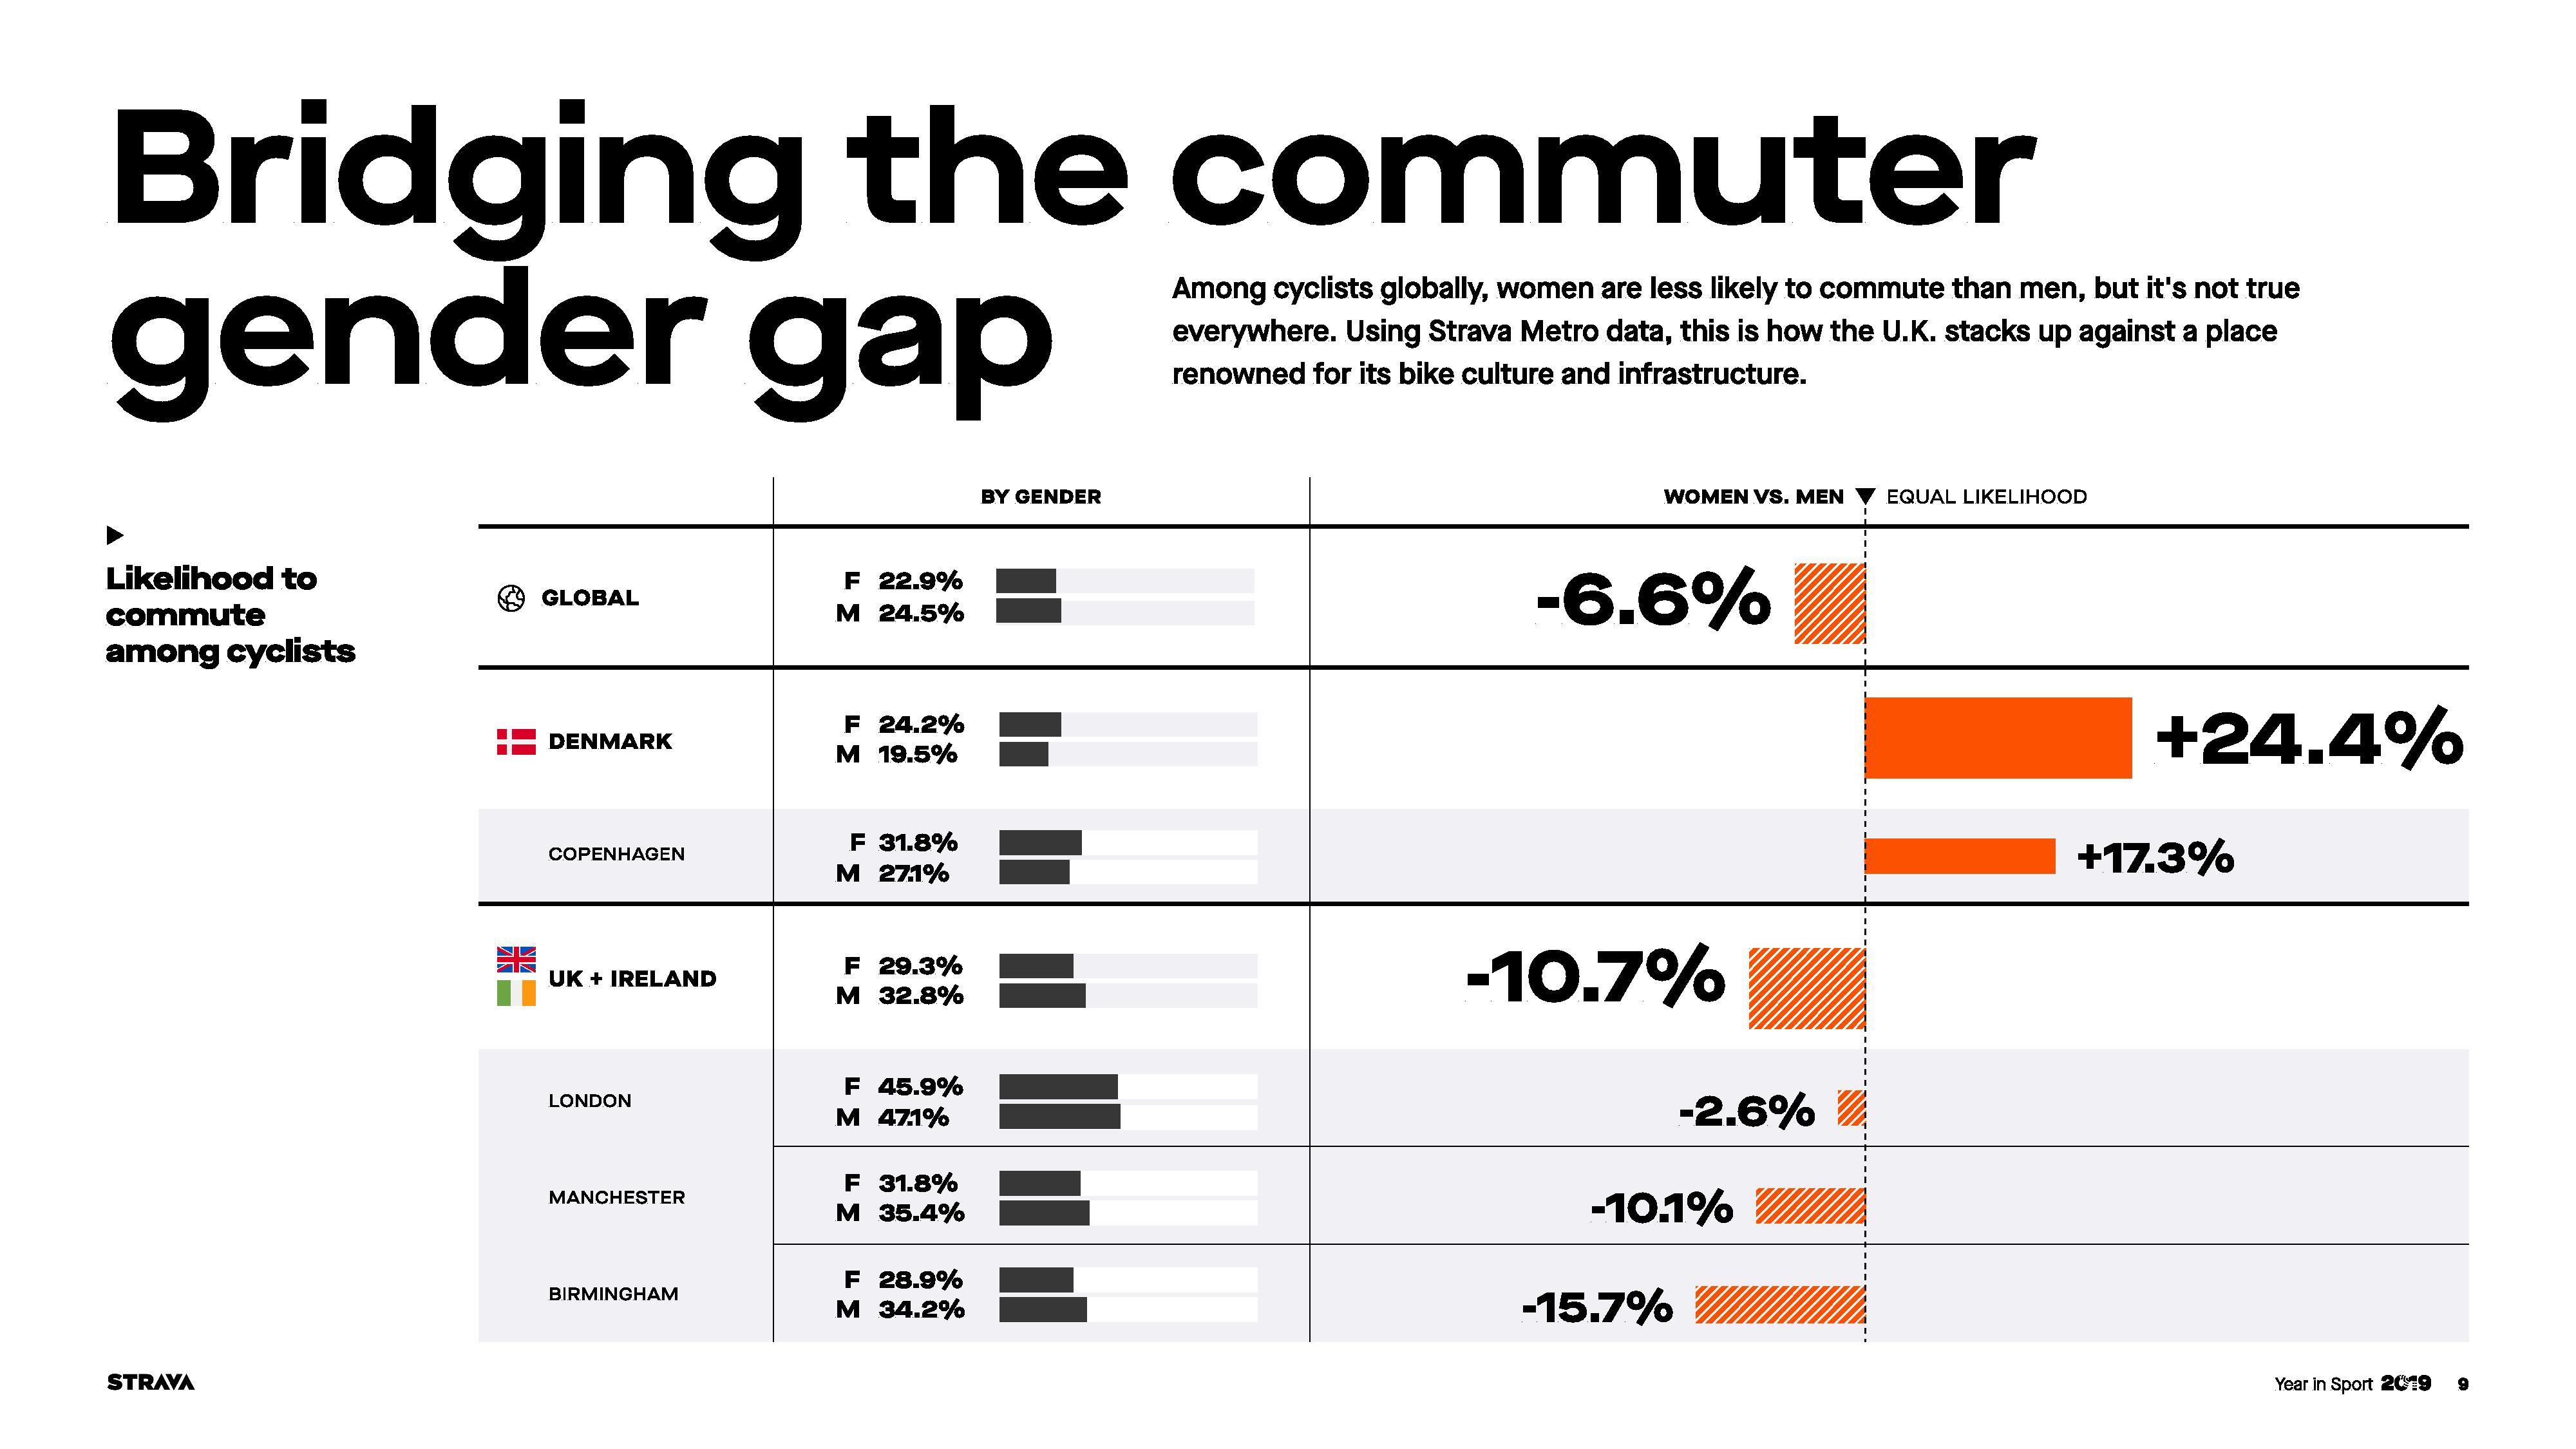
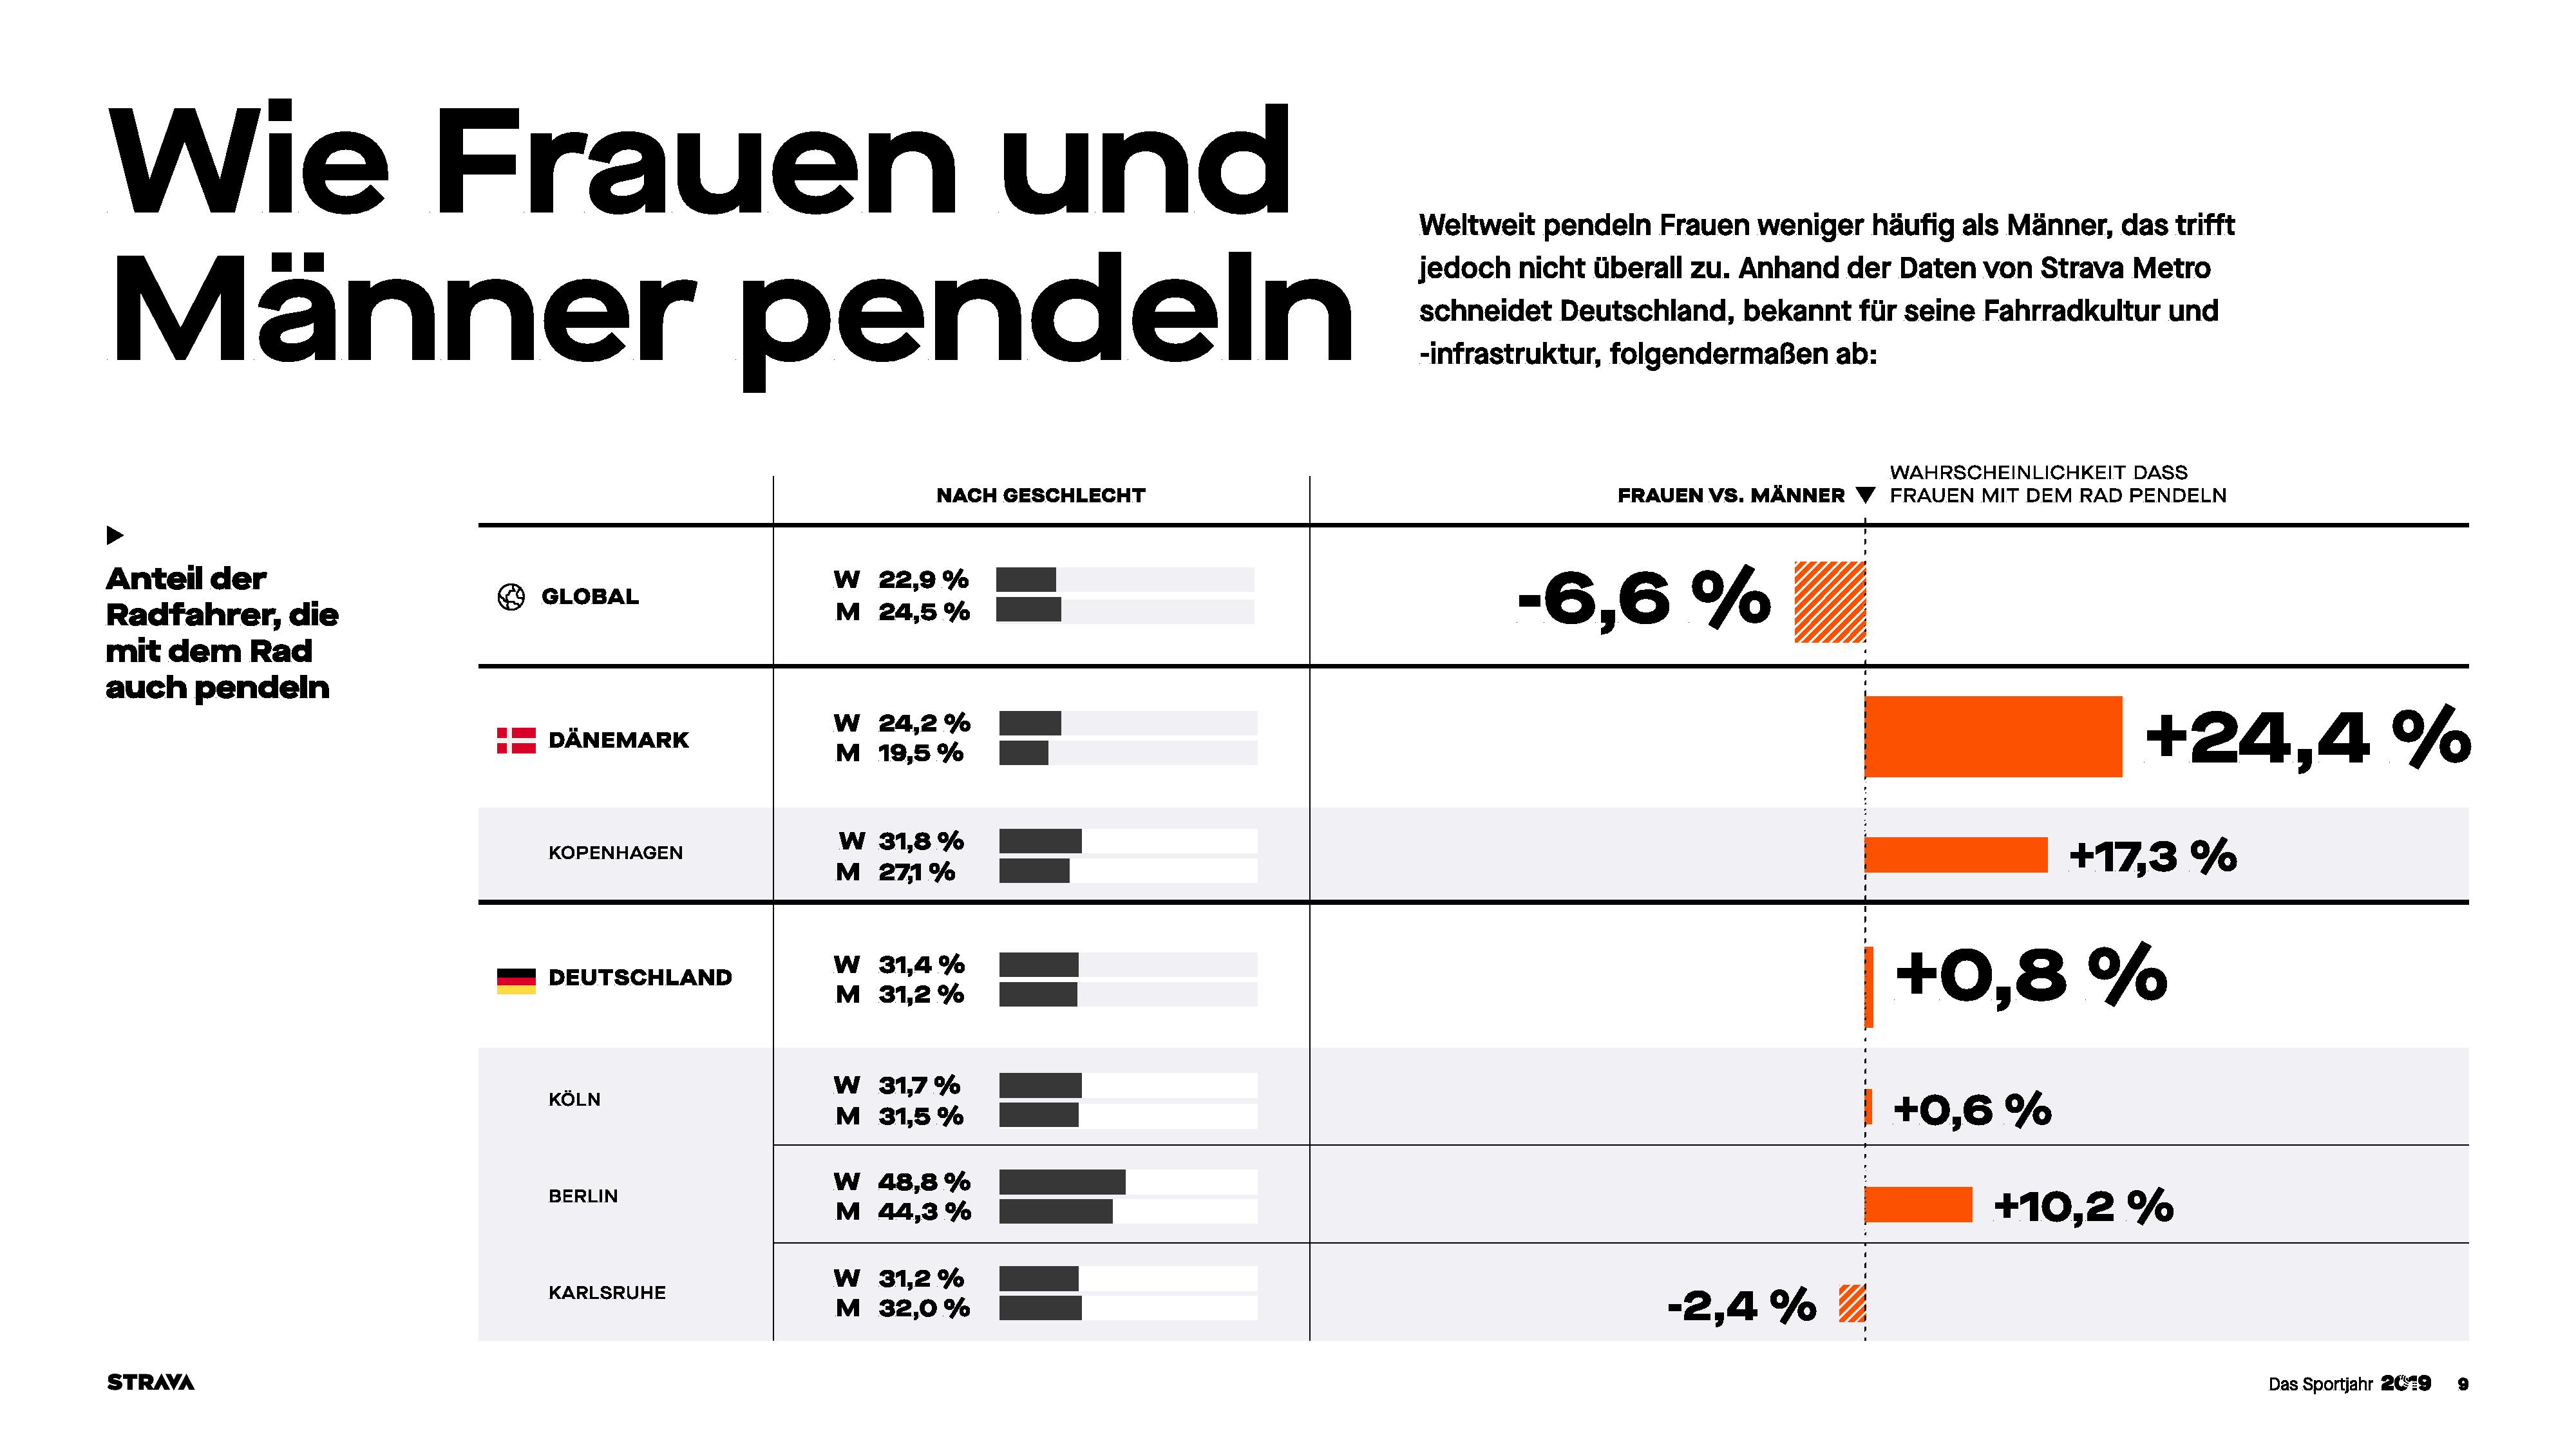
As with past years, you see the commuter stats skewed away from countries that have such regular views around bike commuting that they don’t even bother to record it with Strava. In this slide discussing the commuter gender gap they point out that Denmark has more females than males commuting. But more interesting is the Copenhagen stats.
They show about 27-31% of folks in that city will log their ride on Strava. However, we know that city-wide the actual measured number is much higher – around 62% of people commute daily by bicycle. Undoubtedly the number of athletic-focused Strava members is even higher than that. But like many other popular cycling cities – most people don’t log short commutes.
Here in Amsterdam, for example, I rarely see people logging their commutes within the city. I virtually never record my 2.8km long commute each way. I’d get laughed at if I listed that as public every single day, each way.
But, it also works the other way – if we’re looking at US numbers, then having 44% of Strava users in Portland, or 21% in LA commuting by bike is actually incredibly impressive. Way better than I would have expected.

In any event, there’s a pile of other slides for those that want to go through them. I’ve uploaded the entire decks of a few countries into galleries below. First up is the US set:


And then here’s the UK/Ireland set:


And then since German readers are among the biggest groups here, here’s that set:


And finally, I’ve put up the others here: Brazil, France, and Japan.
As always, looking forward to next year. And of course, picking out just the perfect calendar for Strava.
Thanks for reading!
FOUND THIS POST USEFUL? SUPPORT THE SITE!
Hopefully, you found this post useful. The website is really a labor of love, so please consider becoming a DC RAINMAKER Supporter. This gets you an ad-free experience, and access to our (mostly) bi-monthly behind-the-scenes video series of “Shed Talkin’”.
Support DCRainMaker - Shop on Amazon
Otherwise, perhaps consider using the below link if shopping on Amazon. As an Amazon Associate, I earn from qualifying purchases. It doesn’t cost you anything extra, but your purchases help support this website a lot. It could simply be buying toilet paper, or this pizza oven we use and love.


Calendar suggestions:
This one suits as it’s 16 month calendar for 2020
Llamacorns: The World’s Most Magical Unicorns 2020 Wall Calendar:
(link to amazon.com)
And this one seems on topic.
link to cafepress.com.au
So in 2015, 49% of Strava users logged almost exclusively runs, while 67% of users logged almost exclusively rides. Those are some remarkable success metrics 😉
(they probably took “users that logged on least one activity of type X” as base, not all users, perhaps to make their slow start with runners less obvious, but it still looks weird)
Is it possible to actually download and read the report or is it a press-only document?
The entire report are the 13 slides in the galleries I included above. Plus the various country ones I linked.
I found it after a quick search. Strava’s announcement is here and the link (strava.zip) is at the top of the page, which leads to a 13 page pdf document.
Ah, ok, thanks. I thought there might be one for Australia…
Did they include stats on the percentage of users who used bluetooth sensors?
Further to that, a calendar featuring bluetooth devices would be appropriate (I tried searching, but that’s not a very helpful search term…)
Are the galleries or reports working for folks on mobile? I’m on a Pixel 3a, Android, and when I try to look at the reports, I just get the jpg cover.
Interesting to see that the fastest/longest gear groups do not overlap. Seems there’s no perfect solution that’s fast AND comfortable?
Not surprising: of two equally “fast” bikes, that which discourages long distance use more would see higher average speeds. On top of that, short+fast vs long+steady are quite different cultures which is why you see technologically driven brands ok the speed side and mostly tradition driven brands on the distance side.
Typo, unless there’s a bike show I’m missing. I do need an n+1 🙂
“Now, to Strava’s credit here – they did put useful information around the bikes and shows.”
Meanwhile I think you need to get back to basics with the calendar, they clearly need this:
link to amazon.co.uk
😉
Some of those stats might be skewed / incorrect. A friend has been having trouble with his Apple Watch where it’s not recording the correct activity. We definitely cycled outside, but it was uploaded to Strava as indoor cycling.
I live most of the year in a smallish Japanese city. In my casual hobby jogger run club, virtually all do marathons. I know this since we jiko shokai before each practice and everyone announces their last race and next race.
One other consideration: many non runner Japanese call ANY distance a “marathon”. Even a 5k some will call a “marathon”.
I suspect the high percentage is a combo of these cultural differences
I shocked by how low those average speeds are for bikes. If your the sort of person who can justify a top end TT bike I’d have thought you’d only be using for training for TTs or racing them, can’t imagine they’re being used to go to the shops or work. 17ish MPH would see you at the bottom end of any local TT even the long ones
If you’re training, it depends if you drive to where you want to train, or slog out of the city/’burb on the bike. If it’s the latter, and you record the whole thing as one acitvity, your avg will be low.
The 17ish mph presumably includes warm-ups, cool-downs, and rest periods between intervals. I don’t have a TT bike, but my structured workouts usually have low-ish average speeds.
Don’t forget that not all bike rides are on pavement or on TT bikes. 17mph on gravel with 100′ of gain per mile average is stout. On a MTB riding singletrack trail, it is impossible. On a fat bike in the snow 10mph would be considered flying. Of my >8000 miles yearly I only ride about 1500 miles on pavement.
Agreed but those stats are for TT bikes. I don’t see many people riding their P5 on gravel
The challenge as I outlined is really around road usage. Even in all of my IM training days, with a typical bike split of roughly 5:25 (20MPH, on IM Canada no less) – or a 70.3 split of roughly 23MPH – my training days almost never were higher than 20MPH. It’s just near impossible to do on real roads solo – at least in the US.
And the vast majority of long course triathletes train solo. Sure, if you’re in a roadie group ride you’ll be cruising along above 20MPH no prob. But solo on a TT bike watching out for cars? Rarely netting an average entire ride speed of 20MPH once you account for stop-lights, traffic, etc…
For commuter miles, there should be a threshold on whether to include in Strava. I understand if it’s under 5 mi, it’s absurd to include the commute, but I have friends commuting 30-50 mi per day. It’s legit to post those rides.
I’d also like to know the regional breakouts for early morning rides. At least in the DC-area, group rides are primarily in the early evening and 7-9am on the weekends.
Totally agree on 30-50 mi rides. Heck, even 30KM is legit in my opinion.
I’m not sure what the threshold is either. But I’m pretty sure it’s not 1.8mi.
Come on, you’re both actually being snobby about an activity being too short to post on Strava? The age of dick-swinging is over.
Not a single activity, no. But 2x a day activities of the exact same route every single day that’s not even 2 miles? Yeah.
If I ride a meter on the bike, it gets uploaded. Every meter I’ve ever ridden (currently 35,616,200 of them) is logged, and I’d like to keep it that way. Surely as a data geek, you can appreciate this concept, Ray…..
I don’t have any issue recording it. My point is that if I were to actually make public all my rides, it’s typically 6-8 rides per day, mostly between 800m and 3KM. To the grocery and back, to drop-off the kids at school, to grab lunch, etc… And then I’d have my actual workout in there with a normal stat.
That’s all.
I’m surprised that the Specialized Tarmac made it to the list of bikes with longest rides. It seemed pretty unforgiving when I took one for a test ride. Maybe this Strava insight could be an excuse for me to get one 😛
Thanks for sharing! Any reason why they adopted the US government Fiscal Year?
One imagines so that they have time to prepare the pretty report for mid-December release.
I guess my challenge with that is that it shouldn’t take 3 months to prep this data. They should be able to have these reports decided on back in September, with daily reports that give them the exact stats, and then it just pulls it into a final report on the day they release.
What they’re doing really isn’t hard. Big tech and non-tech companies do this day in and day out for all sorts of things. There’s frankly zero reason this data needs to be that far askew.
Maybe the dependency is on the lead time for the book they send out.
There is no book.
That’s literally just me printing out the first page of a PDF and putting it on a random book.
Ha! That is funny! It looks so legit in the first photo. Nice job!
Ok, I have no more ideas as to why they don’t just wait until January. 🙂
This article reinforces why this here is the only website for fitness tech analysis. Somebody understands the basic nuance of growth rates versus units, and has an abundance of common sense product knowledge.
Runners World is out here concluding Polar Vantage M is the year’s most used running watch. Cycling Tips is colored surprised the ROAM didn’t outsell Edge 530.
The freelanc-ization of media. Few true experts are left.
Quoth Trump. SAD!
I’d find this report interesting if I had any confidence the data is legit, which I don’t.
Just looked at my individual report and it said I ran 900 and something km for the year. Utter bullshit, I did 2500. Very disappointing. All my runs are all there, uploaded to my Strava account, any ideas why this report would be so completely wrong?