COVID-19: How mortality rates in 2020 compare with past decades and centuries
Despite some of the most severe restrictions ever endured by the UK, there has been an almost unparalleled loss of life.

Tuesday 12 January 2021 11:17, UK

How bad has this pandemic been? How does it compare with other decades and centuries? Where does it stand in relation to the seasonal flu pandemics of the 20th century, or indeed the flu, smallpox and cholera epidemics of the 19th century? Is this really a worse period for mortality, as some have suggested, than in the world wars?
Up until now, it has been hard to get even close to an answer to these questions. Most obviously, this is an ongoing pandemic, from which thousands of people are still dying each week. We do not yet know the final toll, and it will take some time before we do.
That goes, by the way, for the economic as well as the direct mortality consequences. We can be pretty sure that, in at least one sense, this pandemic has been like no other in history: while other diseases have sparked sporadic restrictions and changes in behaviour, we have never experienced the kinds of lockdowns implemented over the past year. Never. This is completely without precedent.
Bearing all this in mind, however, we are nonetheless now able to draw some early conclusions about the scale of what we are living (or indeed dying) through. This is not an enjoyable exercise, but it is important.
Some have suggested that COVID-19 is barely more dangerous than the flu - and others say that this represents danger of an order that we have rarely seen before.
Now we have pretty much all the data for the first calendar year of the pandemic, we can start to draw some meaningful comparisons.
In this case we are looking at data for England and Wales, collected by the Office for National Statistics (ONS) since 1960, and contained in the Human Mortality Database for between 1841 and 1960.
It's worth pointing out that the numbers for Scotland have been broadly similar, if slightly less severe than for England and Wales. And note that we're talking here not about "COVID-19 deaths" but about all deaths from all causes in England and Wales during a given year.
Now, there is no single definitive measure of mortality - especially when one attempts to compare different periods of history. But let us begin with the simplest of all numbers: the sum total of people who died in 2020.
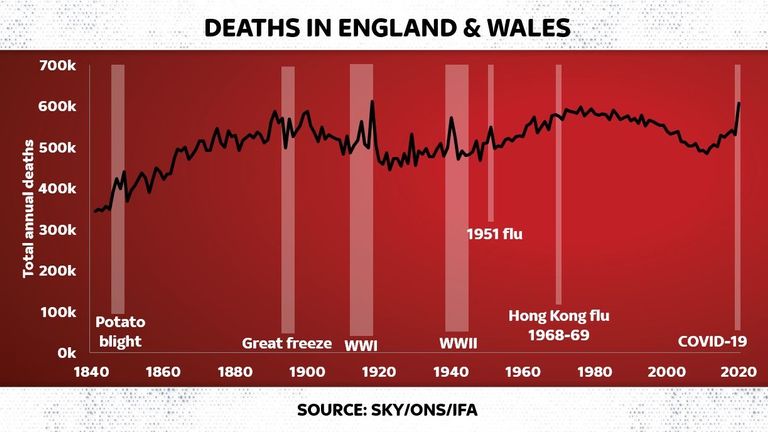
In the 52 weeks to Christmas Day, 604,045 deaths were registered in England and Wales. It's worth saying this almost certainly understates the likely 2020 total, since it includes a few days of late 2019, when deaths were running at far lower levels than they were this winter.
Even so, this number is nonetheless nearly without precedent. If you look at civilian deaths, the only other year in which more than 600,000 people died in England and Wales was 1918, when the final year of World War One coincided with the Spanish Flu.
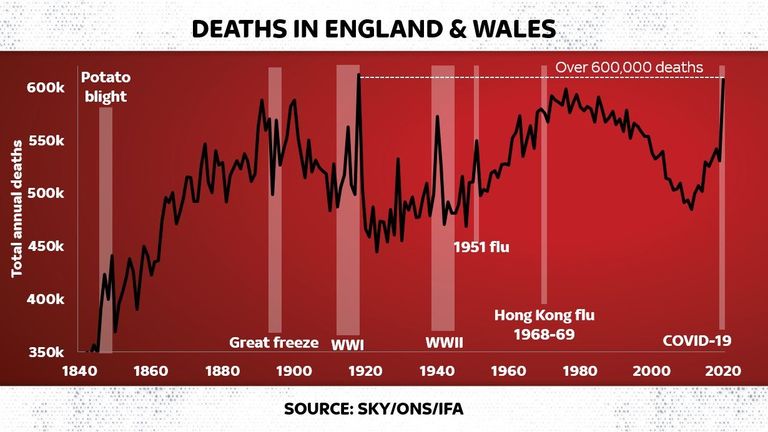
In other words, this is more than in any year of the Second World War or any other pandemic - ever. (Records for the Black Death are very shaky, but save for years of military conflict that might be the only other contender in terms of sheer numbers of deaths.)
However, it's worth underlining that these historical numbers are only civilian deaths - so do not reflect the enormous military loss of life during the world wars.
You've probably already realised the main problem with comparing these two numbers: the UK population is far bigger today than it was in 1918, or indeed any year of any previous century.
To get a more comparable number, we need to divide the number of deaths by the total population in England and Wales. When we do so, we come to a less terrifying number. In fact, the number of deaths per 1,000 is 10.2. This is significantly up from the levels of previous years (in 2019, for instance, it was 8.9), but it's still only the highest crude mortality rate since 2003.
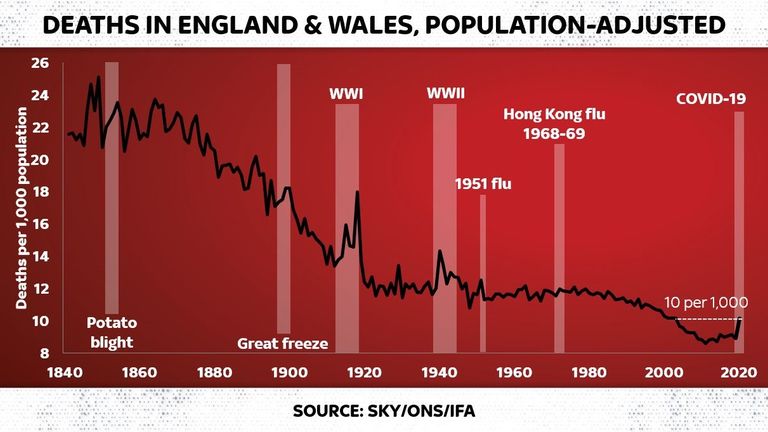
This doesn't quite sound so bad does it? Fewer people dying per 1,000 than in 2003, and pretty much any year before. But there's a clue here as to why this isn't an especially meaningful comparison.
Crude mortality rates, which is what we're talking about here, have been falling for most of the 20th and 21st century as medical science has advanced and people have lived longer. So casting this number as telling us "it's only as bad as 2003" isn't quite right.
A far better yardstick (since we're trying to judge this year versus similar years) is to see how this crude mortality rate compares with the years before it. Are things getting better or worse, in other words? These are what the ONS calls excess death rates (a term you're doubtless already familiar with), and when you look at these population adjusted excess death rates, a very different picture presents itself.
In 2020 the number of excess deaths, as a proportion of the population, rose by 12.1% compared with the average of the previous five years.
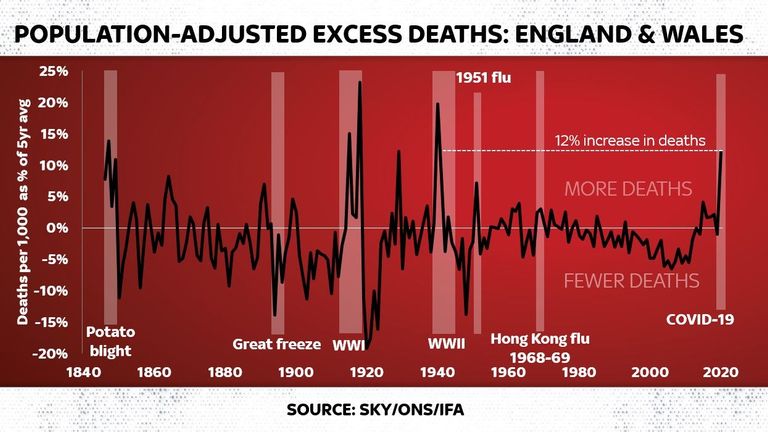
To put that in perspective, that's the biggest leap in any year since 1940. Bigger than during the 1951 flu epidemic. Bigger than during the Asian flu in the 1950s or the Hong Kong flu in the 1960s. In fact the only other years that come close - save for 1940 - are 1929, in which there was a global flu pandemic on top of an economic crash; 1918, year of the Spanish flu; and 1915, during the First World War.
It's worth underlining that these are not projections and these are not numbers dependent on diagnoses - they are cold hard numbers of those who have died of all causes. And they underline that even though this pandemic is still not over, it has already exerted an extraordinary cost in terms of lives lost.
However, excess deaths are not really the most comprehensive way of comparing these deaths, as while we've adjusted for the growing population size, we haven't adjusted for the fact that the population is ageing.
This really matters. Consider two imaginary countries: one where the majority of the population is over 80, the other where the majority is under 30. Now, you would always expect the country with an older population to see more people dying each year - even if the people there are comparatively healthier and have comparatively longer lives than those in the younger country.
So actuaries have devised a measure called age-standardised mortality. This is perhaps the gold standard of mortality measurements - so what happens when one examines 2020 in terms of standardised mortality?
Well, according to analysis carried out for Sky News by the Continuous Mortality Investigation of the Institute and Faculty of Actuaries, the deterioration in mortality during 2020 was almost without parallel.
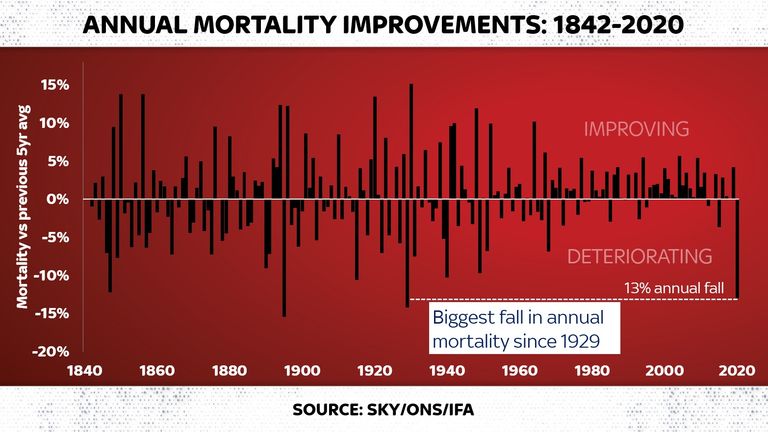
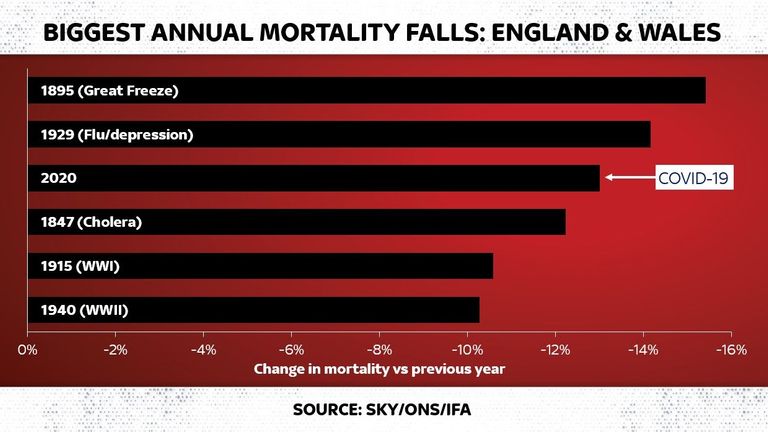
In this case, we're measuring mortality improvements, so anything in negative territory is bad. And the fall in mortality improvements during 2020, compared with the previous year, was the single biggest annual drop since 1929. In fact, if you were to put together a list of the worst years for annual changes in mortality improvements going all the way back to 1842, 2020 would be the third biggest annual fall in mortality improvements, after the Great Freeze of 1895 and the flu pandemic of 1929 (and somewhat worse than 1847, during which there was a severe cholera outbreak, and 1915, the midst of the Great War).
It's worth underlining again: this is only one prism through which to view these numbers. None are altogether definitive. And annual numbers such as these sometimes underplay pandemics that straddle more than one year - or indeed which come amid other periods of human loss, such as the world wars. However, it is plain, even with much of this pandemic still playing out, that this is already a moment of near unparalleled loss of life.
That this has happened in spite of some of the most severe lockdown restrictions ever endured by this country makes these numbers doubly striking. Some will ask whether they would have been many times higher were it not for the restrictions. Others will argue that mortality could be affected by these indirect decisions for many years to come. Either way, the toll of COVID-19 is becoming clearer, and the numbers are thoroughly depressing.