ANALYSING MALLARD’S RUN OF 3RD JULY 1938
Guest blog by David Andrews
Editor’s note: A few weeks ago the IMechE Library and Archive (@IMechELibrary) tweeted about Nigel Gresley and in doing so mentioned the Mallard’s 126 mph record breaking run in 1938. IMechE Member David Andrew replied to our tweet to share his opinion about the accuracy of the 126 mph measurement. We were intrigued and asked David if he would provide more information via a guest blog. David agreed and the text below is his analysis of Mallard’s record breaking run on 3rd July 1938. The opinions stated are his own.
David Andrews is a member of the Institution’s Engineering Heritage Committee. After seven years working as an archaeologist David became an engineer, designing first diesel engines and more recently lithium-ion batteries. He has a particular interest in railway history and steam locomotive speed records.

At some point in your life you became aware of your own mortality, you realise that life is finite and imperfect. That may have come as a shock. There were other disappointments yet to come. In your engineering education you realise that everything is imperfect. No piece of metal can be machined perfectly flat or perfectly smooth, it is never exactly the length it should be, and even if it were you would never know, as no measurement is exact. Everything has a tolerance; the world is flawed and we just have to accept it. So when you see the plaque on the blue flank of Mallard, proudly claiming the world record speed for steam traction of 126 miles an hour you should ask 126 plus or minus how much? What is the error band? How capable was the measurement system, when was it last calibrated?
The answer to these questions lie in the dynamometer car that was coupled behind Mallard. It too is preserved in the National Railway Museum at York. Varnished teak with a clerestory roof, it was built by the North Eastern Railway at Darlington in 1906.

The careful observer will see it has a ninth wheel, painted white. Through a system of gears this wheel pulls a roll of paper across a table, under pens that record time, work done and drawbar pull.

The original roll from Mallard’s run is preserved at York, a sacred relic. You may think a roll of paper a mundane thing but twice in my life I have been moved by the sight of yellowing paper uncurled on a long table. Once was seeing the manuscript of Kerouac’s On the Road on display in the British Library, once was seeing Mallard’s roll laid out in the National Railway Museum. On the second occasion I had a pair of Vernier calipers in my hand. Editor’s note: Please have a conversation with your Archivist before approaching archive material with a pair of calipers.
The roll does not show a ready-made speed curve. Rather a pen connected to a clock marks half seconds as a square wave on the paper in red ink. The greater the distance between the waves the higher the speed. There are also ticks for work done and distance travelled together with annotations done by hand. Quickly pencilled notes made as the paper ran past at 24 inches to the mile, calculations marked on the margins. More formal notes in red ink made in the drawing office when the roll was laid out after the run.
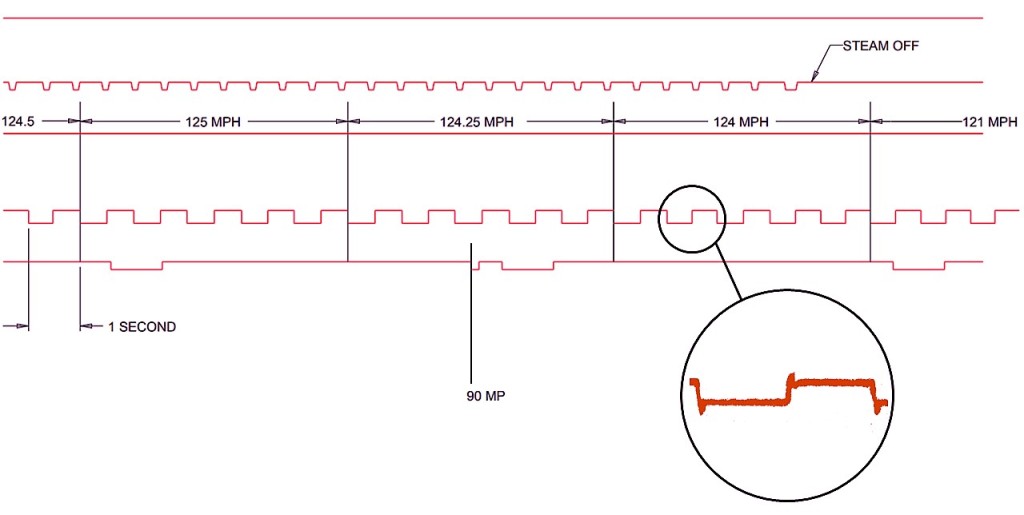
The fastest section was divided into five second blocks, each one labelled with the speed in bold red ink. And you can work through the roll, the speed increasing, falling then rising again until you reach the maximum; “125”. That’s right, 125 miles an hour, not the 126 in the record books. In 1938 the maximum claimed was an average based on the distance run in five seconds. Some draughtsmen claimed they could see 126 for a single second but Sir Nigel Gresley would not allow that. One second occupies some 21 mm of paper at that speed, the difference between 125 and 126 mph is 170 microns, comparable to the width of the inked line. The square wave is not square at that speed, the pen takes a finite time to travel and each movement is subtly different as the friction changes between nib and paper. A result calculated over such a short distance is not a robust measurement.
In 1941 Gresley died. Seven years later the railways were nationalised and Mallard was prepared for the locomotive exchange trials where she would run on foreign lines. Foreign meaning the Great Western line to Plymouth, the Southern line to Exeter and the London Midland to Carlisle. This was a chance to proclaim the glories of Gresley and the London and North Eastern Railway to their rivals and so plaques were fixed on each side of the locomotive. The figure chosen for those plaques was 126, ever since that has been the speed associated with Mallard.
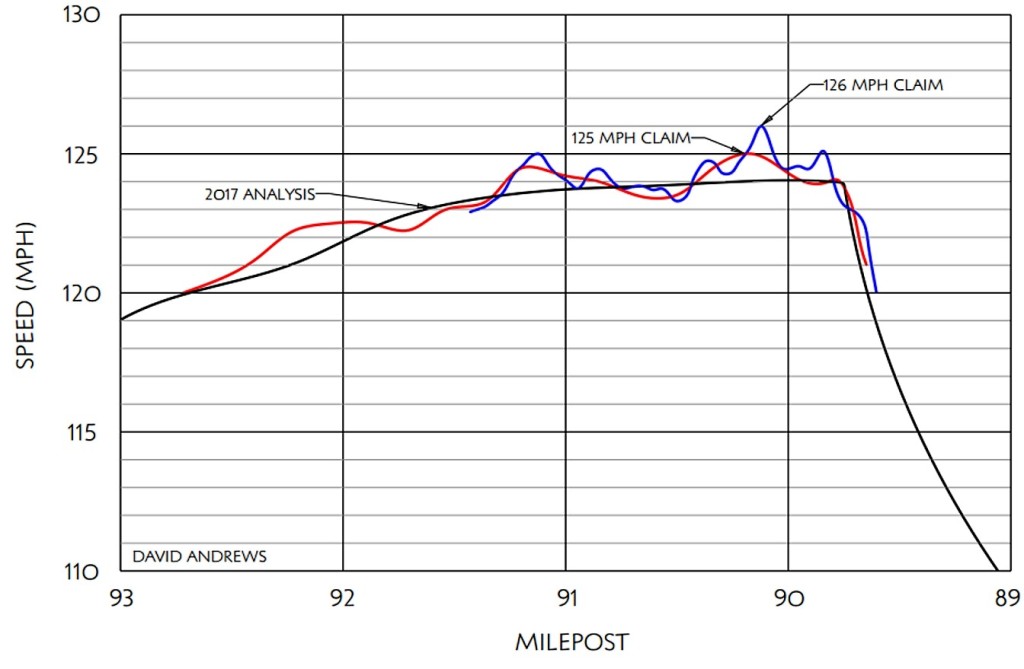
The National Railway Museum hold a speed curve plotted in 1964 when the locomotive entered the collection. It shows the 126 mile an hour peak but it also shows the nonsense of the claim. The trace fluctuates wildly, the speed going up and down second by second in a way impossible with a 400 ton train. For the curve does not show the speed actually run, it shows the noise in the measurement method. Engineers know the value of “graphing” data, information hidden in tables leaps out when the eye can see it on a chart.
The speeds averaged over Gresley’s preferred five second intervals are five times as accurate, plot those speeds and the result is a smooth curve. It still varies to a surprising amount though, rising and falling every mile. Even that more gentle variation is surprising for a train of that weight and the peaks and troughs are suspiciously regular.
The roll was studied to investigate these peaks and troughs, did the speed of the train really vary that much or were they an artefact of the measurement system? There are distance marks on the paper, automatic ones made every quarter mile and ones made when the train passed lineside features such as mileposts. Observers on either side of the dynamometer car held push buttons which generated a mark on the paper. The distance between these mileposts was checked over a long stretch (12 miles or 24 feet of paper) and this showed the paper was moving at an average rate of 24 inches per mile with an error of less than five parts per ten thousand (Impressive as some of that must be due to errors in the author’s own measurements and to errors in the positioning of the lineside mileposts – nothing is perfect).
The velocity of the train was calculated for the preceding 15 miles. This instantaneous speed was divided by the average speed over that mile and when plotted showed an underlying trend of speed rising and falling every mile.
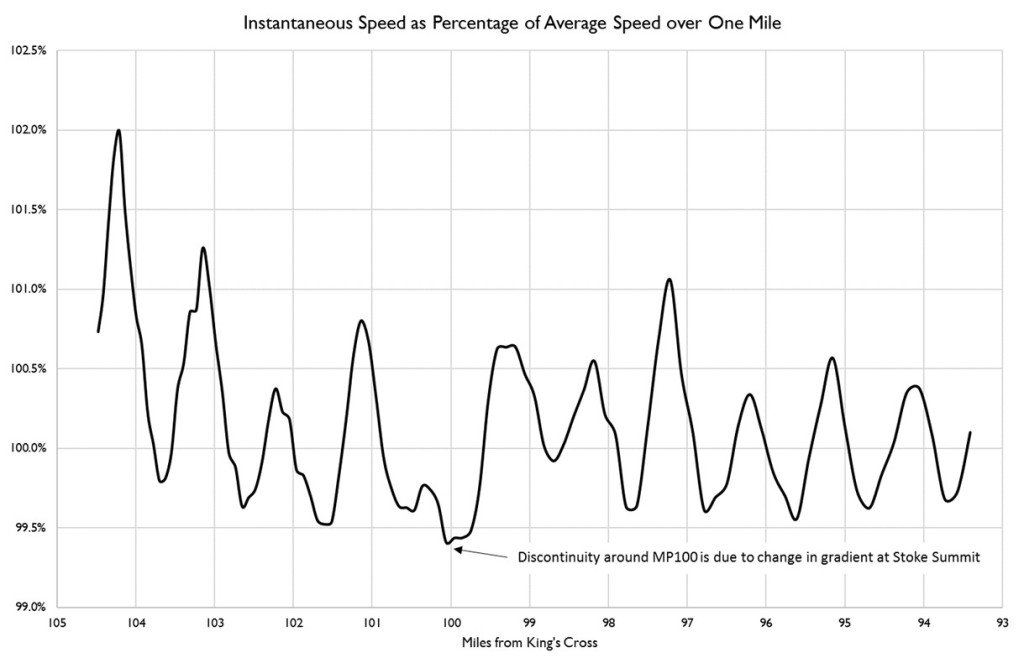
This regular variation would have been caused by the measurement system, likely one of the gears that drove the paper was mounted slightly eccentrically. When this sine wave was subtracted from Mallard’s speed curve the constantly rising and falling trace disappeared. What was left behind was an even acceleration until a speed of 124 miles an hour was reached. This speed was sustained for more than half a mile, much more impressive than 126 for one second or 125 for five. A testament to the design of the locomotive and the determination of the crew on the footplate.