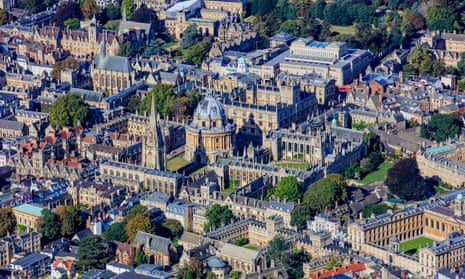
Home affordability in Britain is at its worst level since 2008, with Oxford, London and Winchester the UK’s most unaffordable places to buy. Affordability ratings, which compare the costs of buying a home in an area with the average regional pay, say that the cost of homeownership in five cities is now more than 10 times the average local income, thanks to a rapid growth in house prices, combined with slower wage growth.
An annual analysis by Lloyds Bank once again pinpointed Oxford as the least affordable city in the UK. The average house price of £385,372 is now 10.7 times the average annual gross earnings in the city, of £36,033.
At the other end of the scale, the former Scottish capital of Stirling is the UK’s most affordable city. At £173,847, the average property price is just 3.7 times average local earnings. Londonderry in Northern Ireland is the UK’s second most affordable city.
Two other Northern Ireland cities, Belfast and Lisburn, are also within the top 10 most affordable cities. The others are across the Midlands and northern England (Hereford, Bradford, Sunderland and Durham), Scotland (Glasgow) and Wales (Swansea). None of the 10 most affordable locations require more than five times average local earnings to buy an average-priced local home.
The analysis, first compiled by Lloyds in 2004, shows that the affordability crisis has engulfed much of southern England.
Across the UK, the average house price has risen by 32% over the past five years, from £169,966 in 2012 to its highest ever level of £224,926 in 2017. But average annual city earnings have not kept pace, rising only 7% in the same period, to £32,796.
This means affordability has deteriorated, with house prices rising as a multiple of average annual earnings from 5.5 in 2012 to 6.9 in 2017.
Over the past decade, the cathedral city of St Albans in Hertfordshire has recorded the biggest price gains – 65%. That compares to an average increase, across all UK cities, of 21% over the same period. Winchester has witnessed the second biggest price gains, with a rise of 59%, followed by Chelmsford (54%), Brighton & Hove (46%) and Cambridge (46%).
Over the past five years, London has experienced the fastest house price growth, with average prices up 57%. Chelmsford, the county town of Essex that was granted city status to mark the Queen’s Diamond Jubilee in 2012, had the second highest gains, with prices up 55%.
Other cities with the fastest-rising house prices over the past five years include Bristol, Coventry, Gloucester and Ely, where prices have risen more than 45% since 2012. Prices have only risen by more than 45% over the past five years in one city in the north — Salford, the home of Media City, where prices have climbed 51%.
York and Leicester are identified in the survey as having affordability issues because wages have not kept up with house prices – homes cost 7.6 times average local incomes.
Andy Mason, Lloyds Bank mortgage products director, said: “City living is becoming increasingly expensive. Affordability levels have worsened for four consecutive years as average city house prices continue to rise more steeply than average wage growth.”
