How to Check Memory Usage in Linux?
Checking memory usage is an essential task for system administrators and users of any operating system. Knowing the amount of memory used and available on a system is crucial for maintaining system performance and avoiding resource-related issues. In Linux, we can use several command-line and graphical user interface (GUI) system monitor tools to check memory usage. Let us explore some ways we can use to check Linux memory usage.
Terminal Commands to Check Memory Usage
There are various command line utilities through which we can check Linux memory usage. The common ways to check Linux memory usage are as follows -
Using /proc/meminfo File
The /proc/meminfo file is a system file in Linux that provides detailed information about the system's memory usage. It is a virtual file that is created by the Linux kernel on the fly and contains dynamic information about the system's memory usage. We can use the cat command to monitor memory usage using the /proc/meminfo file.
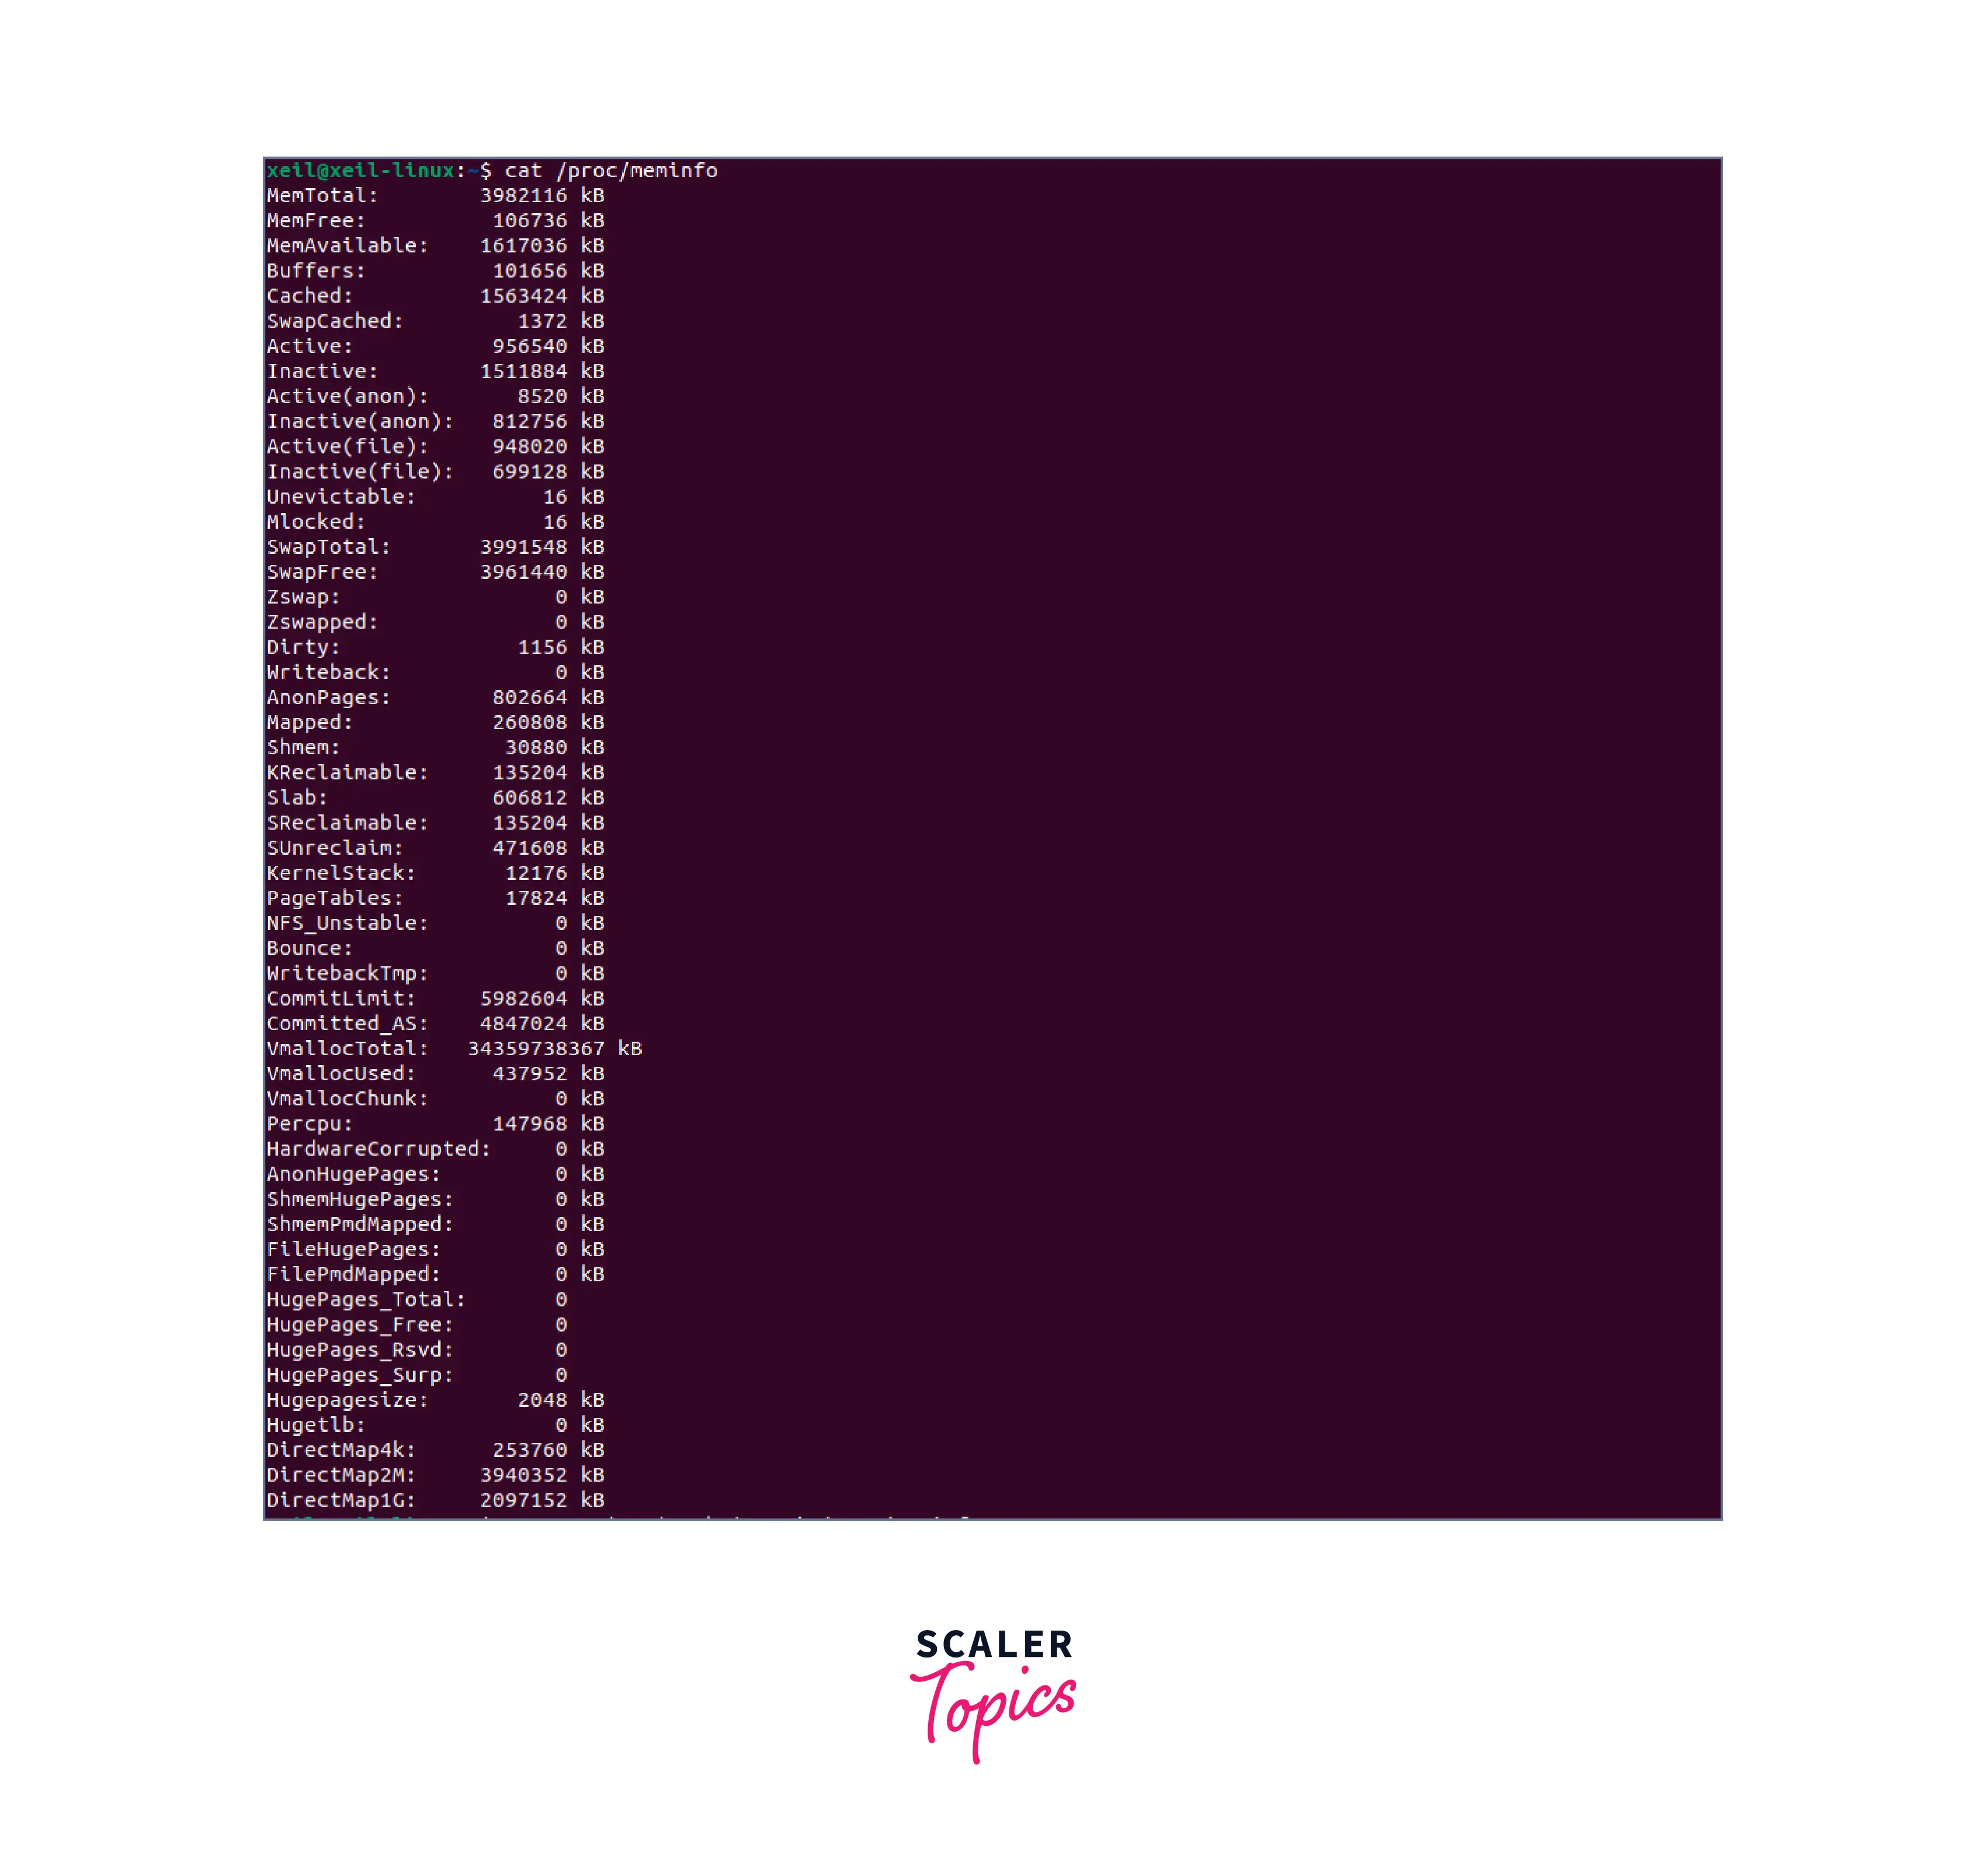
The /proc/meminfo file contains key information regarding multiple aspects of the system's memory usage including-
- Total memory available in the system.
- Total amount of free memory in the system.
- Total amount of memory used by the kernel.
- Total amount of memory used by programs and processes.
- Total amount of memory used for disk caching.
To get a filtered output of the /proc/meminfo file, we can use the grep command.
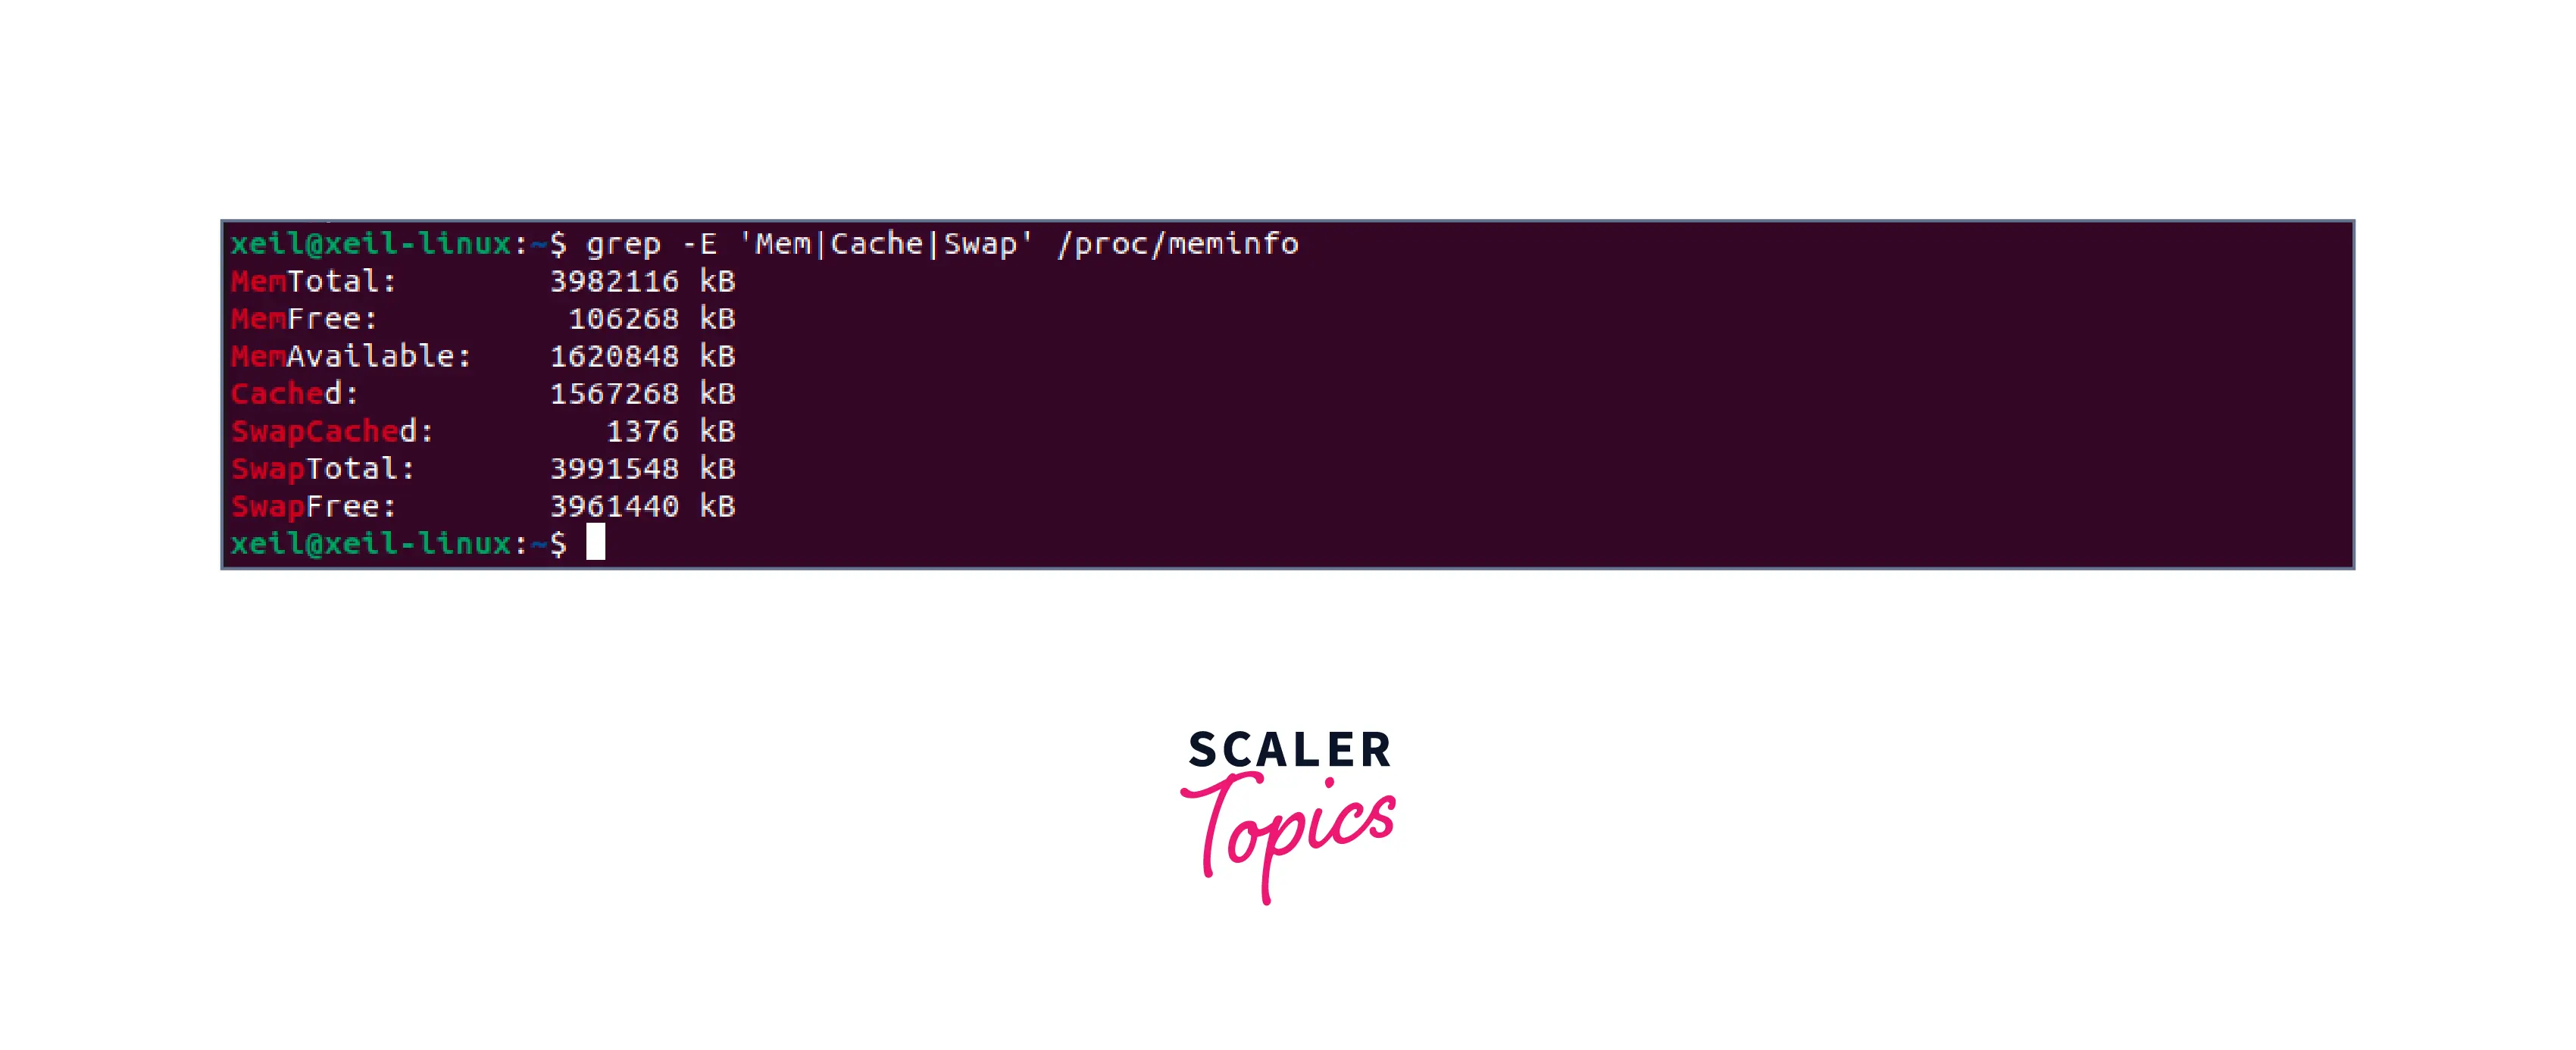
The output of the grep -E command will display only the lines that match the specified regular expressions, providing a more concise and focused overview of the system's memory usage.
Using Free Command
The free command is a Linux utility that can also be used to gather information about the system's memory usage, including the total amount of memory, used memory, free memory, and memory buffers/cache. It is a terminal-based tool that displays a static view of the system's memory usage at a specific point in time.
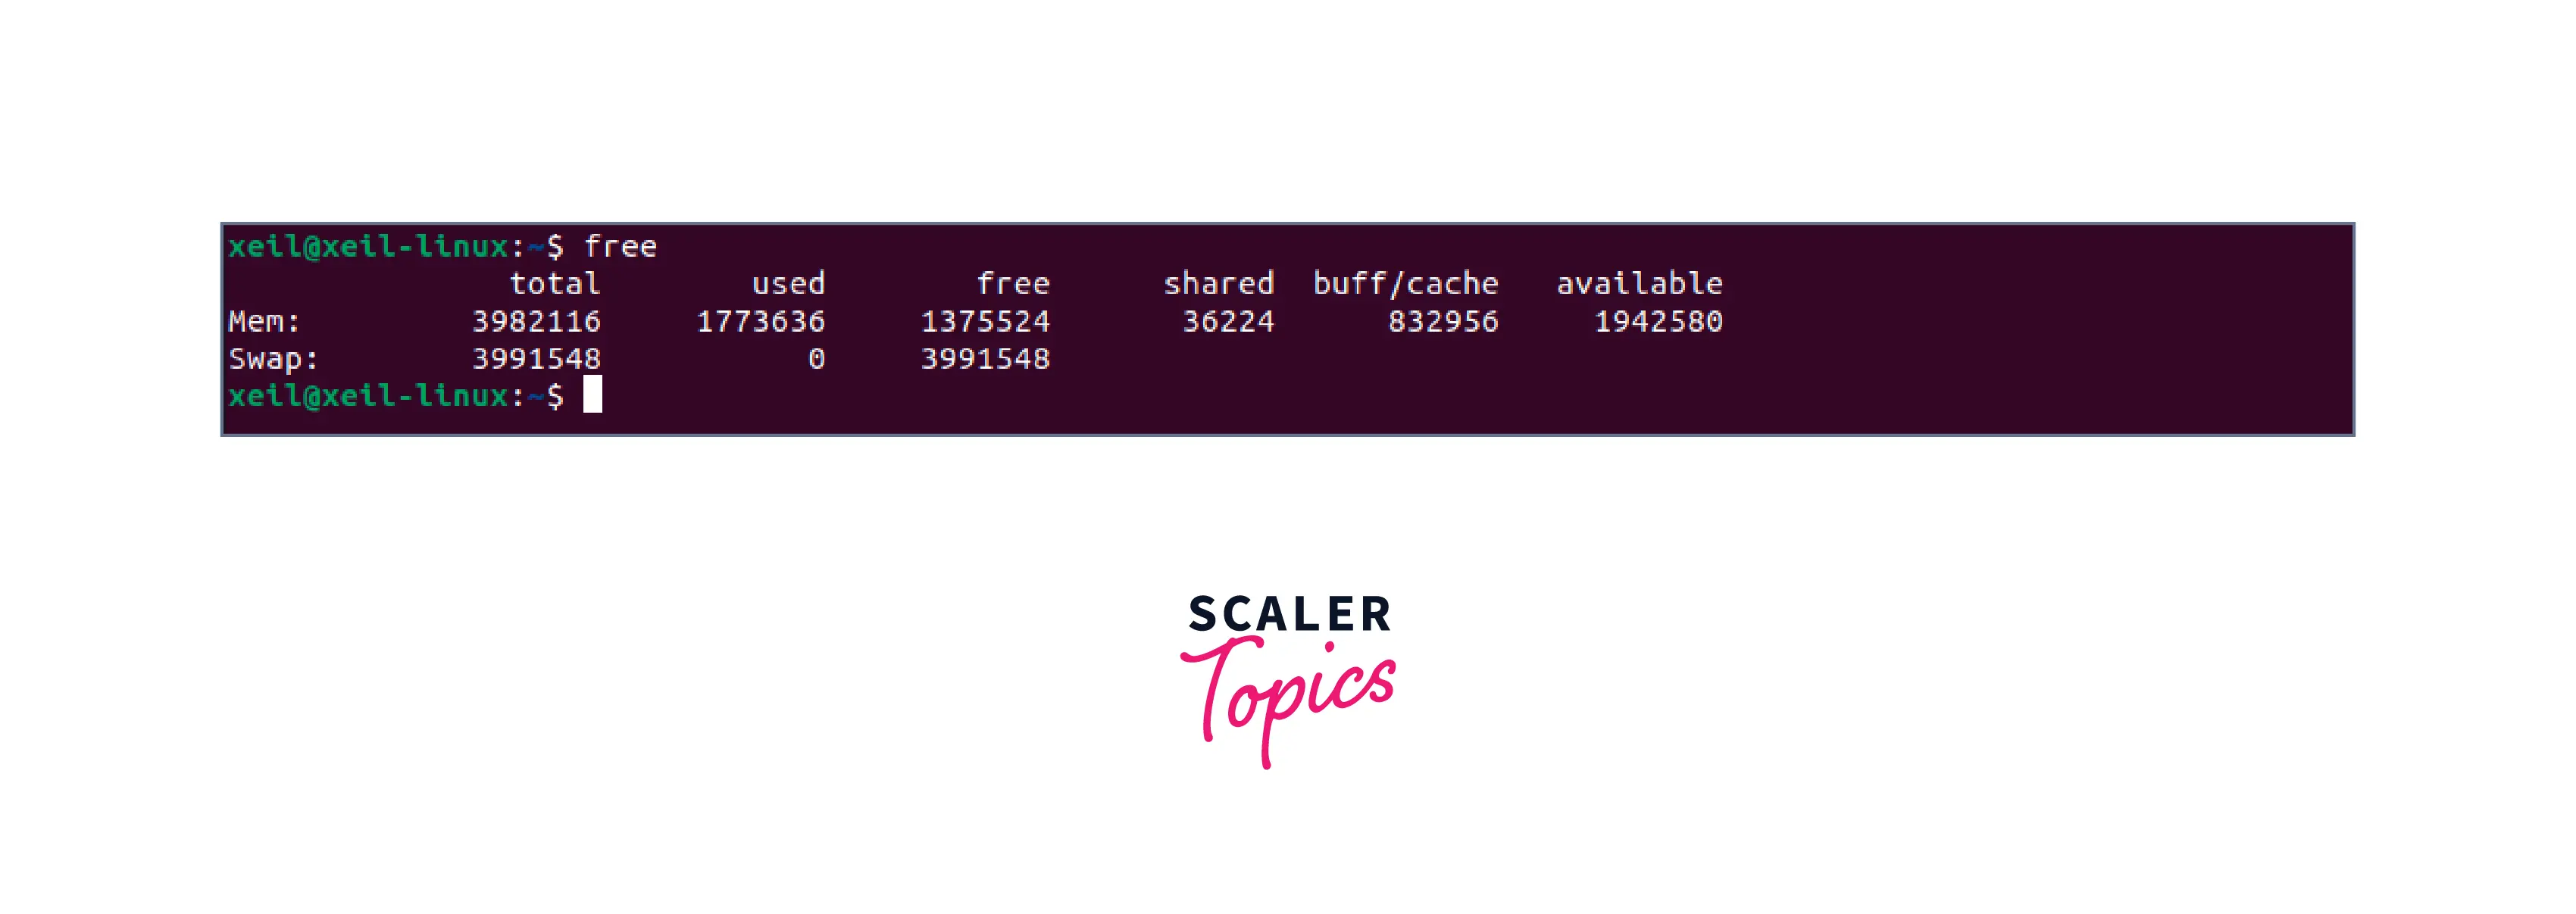
In the above output we can see that the free command displays a summary of the system's memory usage (in kilobytes by default) through the following sections -
- total: The total amount of physical memory in the system.
- used: The amount of memory currently in use by programs and processes.
- free: The amount of memory that is currently available for use by programs and processes.
- shared: The amount of memory that is shared between different processes.
- buff/cache: The amount of memory used for buffers and cache in kilobytes.
- available: The amount of memory that is available for use by programs and processes, taking into account the memory used for buffers and cache.
To customize the output of the free command, we can use several options. Some of the commonly used free options are listed here.
| Options | Description |
|---|---|
| -b | Displays the memory usage in bytes instead of the default kilobytes. |
| -k | Displays the memory usage in bytes instead of the default kilobytes. |
| -m | Displays the memory usage in megabytes. |
| -g | Displays the memory usage in gigabytes. |
| -t | Displays a summary of the total memory usage, including both physical memory and swap space. |
| -s | Displays the memory usage at regular intervals, specified in seconds. |
| -c | Specifies the number of times to display the memory usage at the specified interval. |
Using vmstat Command
The vmstat command provides a comprehensive overview of system performance, including memory usage, CPU activity, and I/O operations, all in a single command.
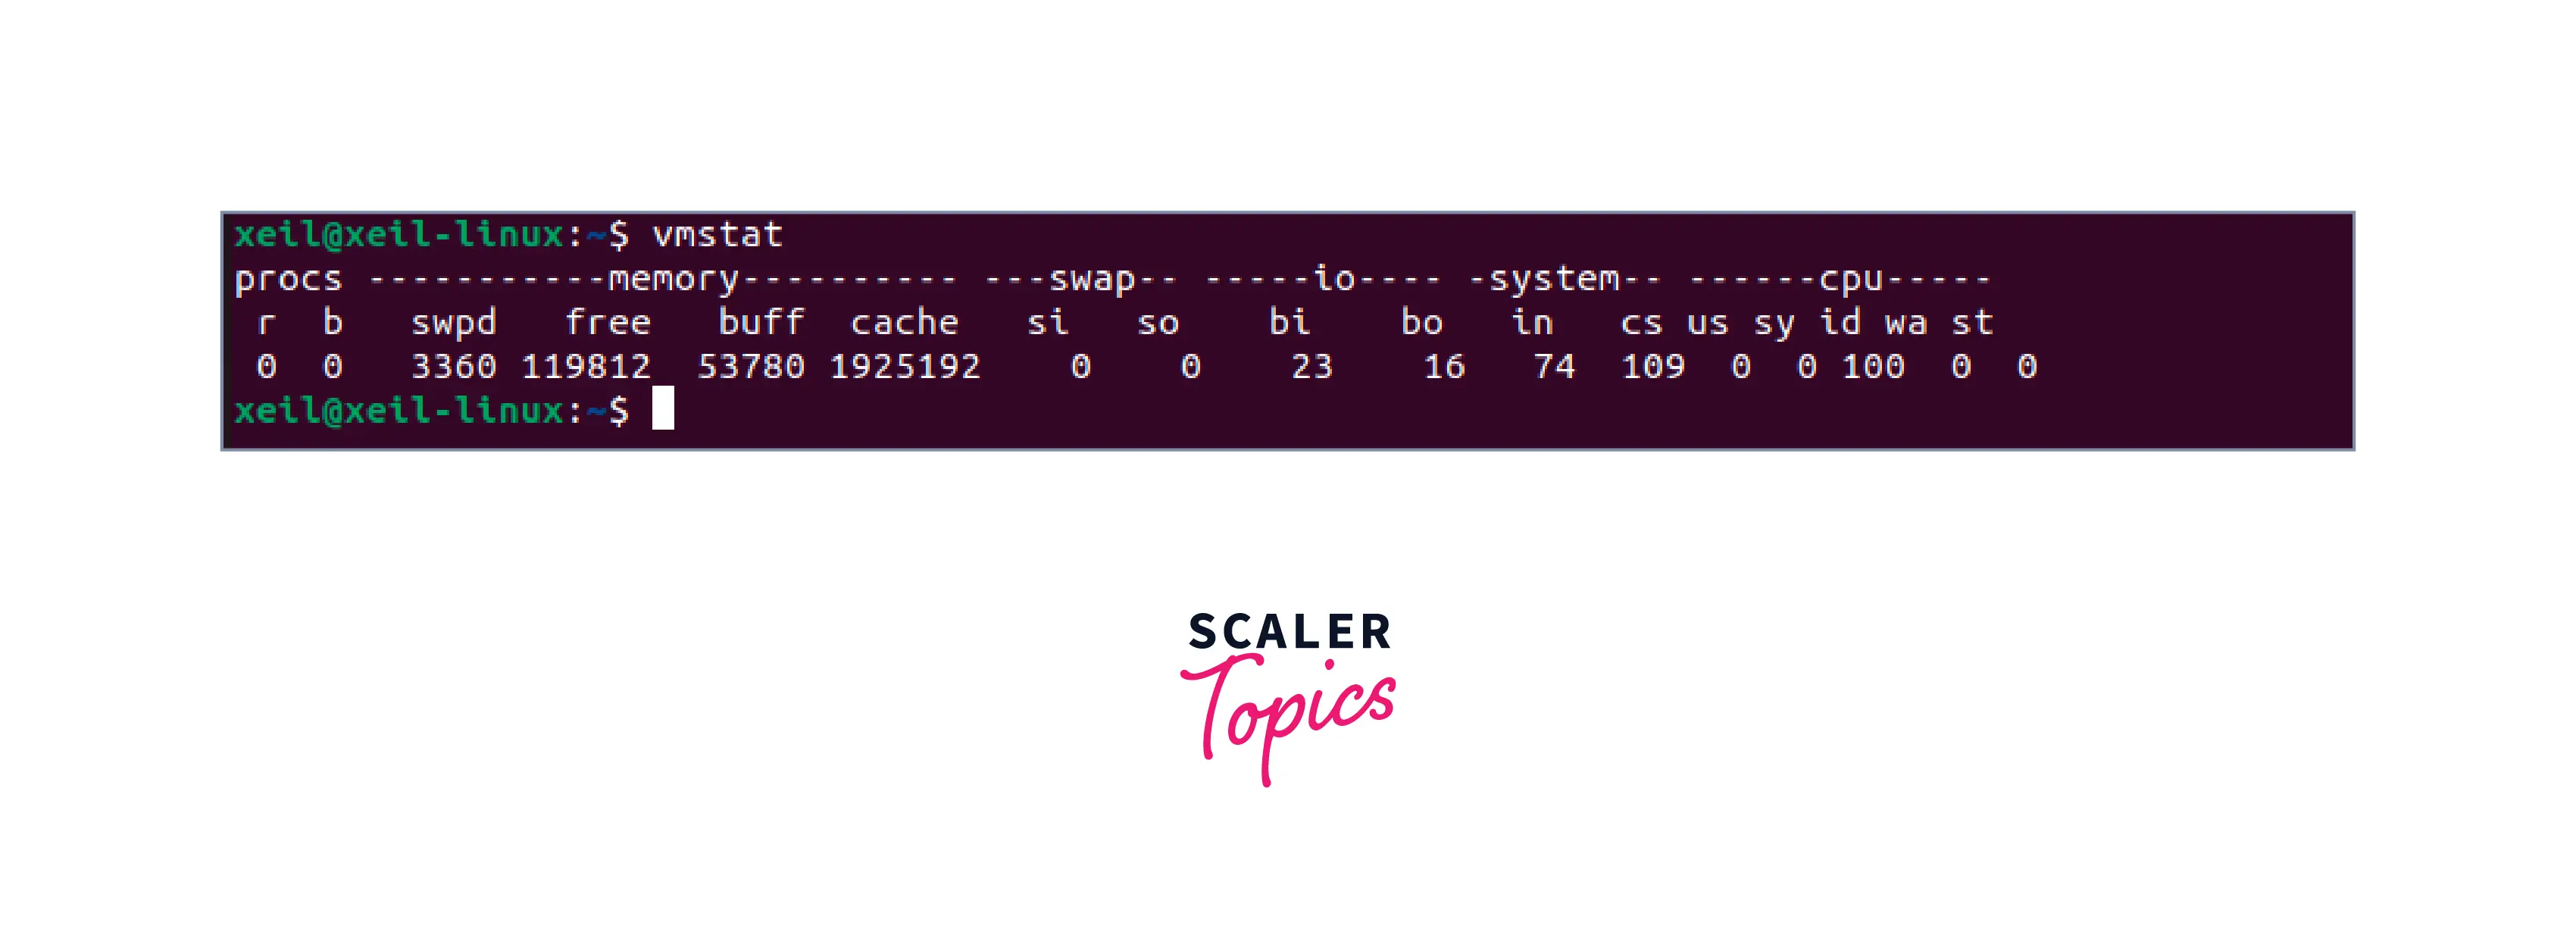
A detailed explanation of the output of the vmstat command is given below -
-
Procs: This section provides information about the current state of processes on the system.
- r: The number of processes waiting for CPU time.
- b: The number of processes blocked on I/O or other resources.
-
Memory: This section provides information about system memory usage.
- swpd: The amount of virtual memory used.
- free: The amount of idle memory.
- buff: The amount of memory used for buffer caches.
- cache: The amount of memory used for page caches.
-
Swap: This section provides information about swap space usage.
- si: The amount of memory swapped in from the disk.
- so: The amount of memory swapped out to disk.
-
IO: This section provides information about input/output (I/O) operations.
- bi: The number of blocks read from a block device.
- bo: The number of blocks written to a block device.
-
System: This section provides information about system activity.
- in: The number of interrupts per second.
- cs: The number of context switches per second.
-
CPU: This section provides information about CPU usage.
- us: The percentage of CPU time spent in user mode.
- sy: The percentage of CPU time spent in system (kernel) mode.
- id: The percentage of CPU time spent idle.
- wa: The percentage of CPU time spent waiting for I/O.
- st: The percentage of CPU time stolen by a hypervisor in a virtualized environment.
To customize the output of the vmstat command we can use several available options. Some of the commonly used vmstat options are as follows -
| Option | Description |
|---|---|
| -a | Displays active and inactive memory. |
| -f | Displays the number of forks since the system was booted. |
| -d | Displays disk statistics. |
| -s | Displays the table of various event counters and memory statistics. |
| -t | Adds a timestamp to each line of output. |
| -n | Displays only one header line. |
Using top Command
Another Linux utility that provides real-time monitoring of the system's performance is the top command.
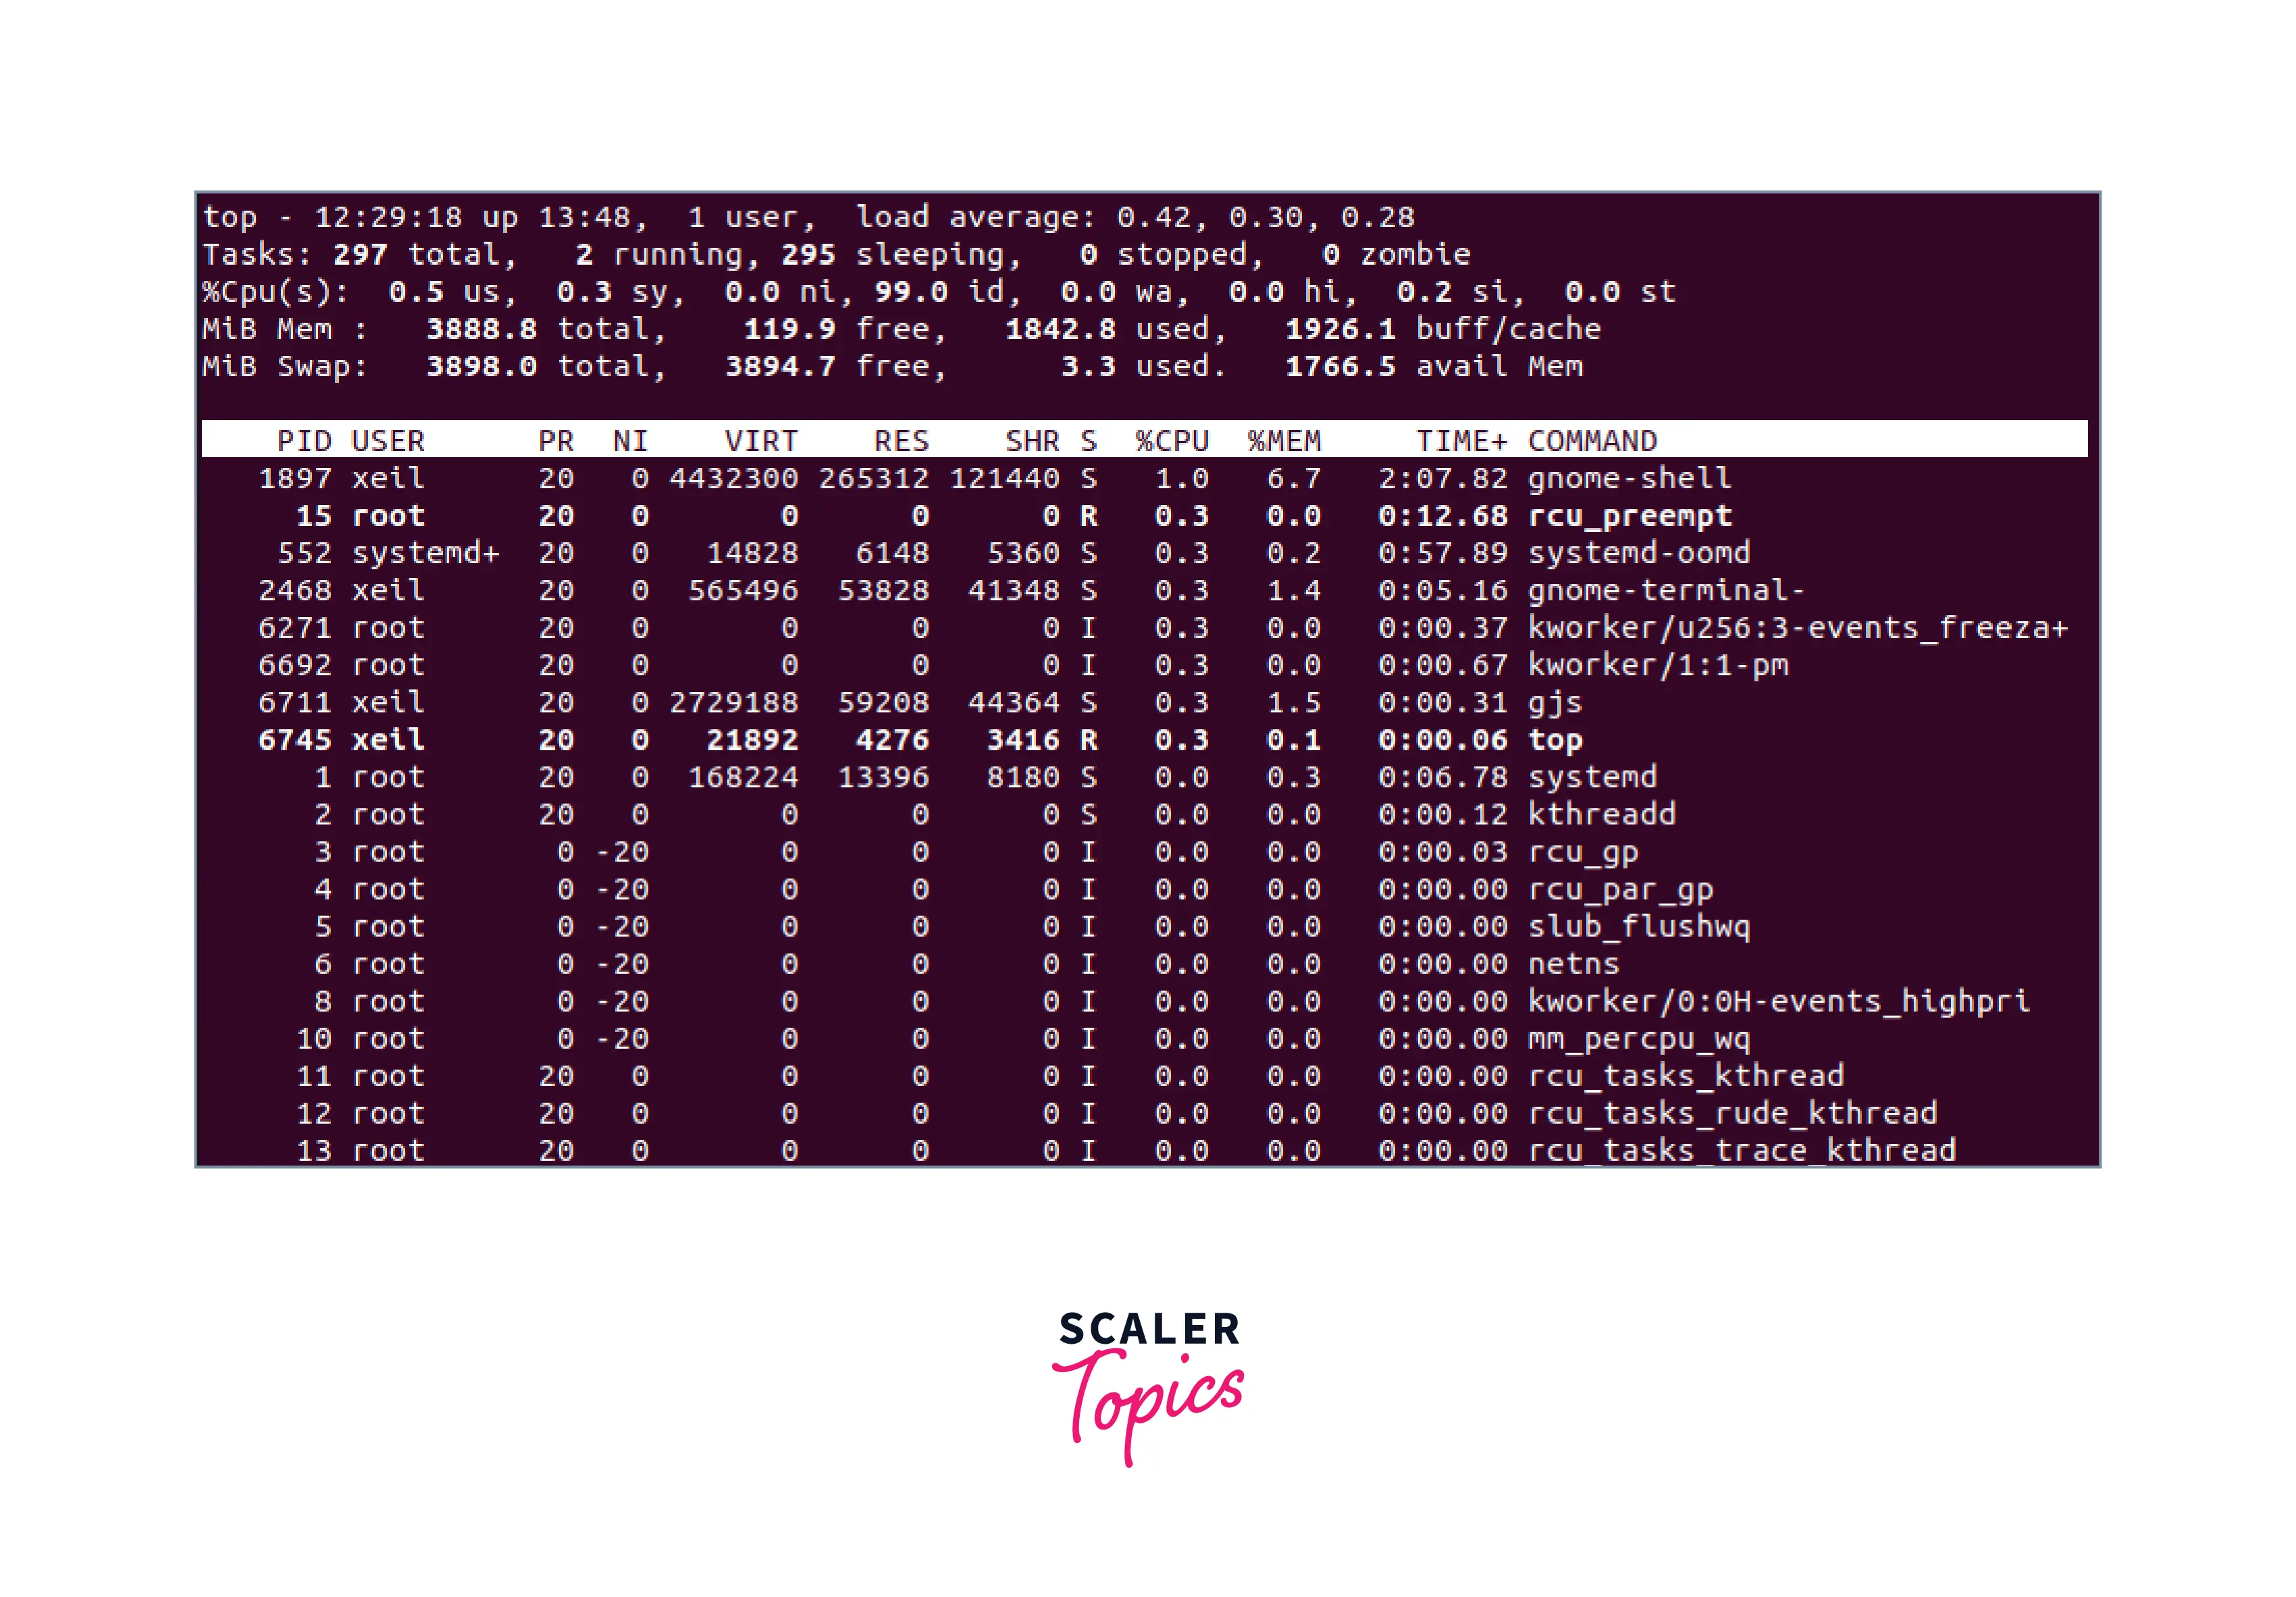
When the top command is run in the terminal, it displays a dynamic table that shows the processes running on the system, their resource usage, and the overall system resource usage. The table is divided into the following columns -
- PID: The process ID of the running process.
- USER: The user who started the process.
- PR: The priority of the process.
- NI: The "nice" value of the process, which is a measure of its priority.
- VIRT: The amount of virtual memory the process is using.
- RES: The amount of physical memory the process is using.
- SHR: The amount of shared memory the process is using.
- S: The status of the process (running, sleeping, etc.).
- %CPU: The percentage of CPU usage by the process.
- %MEM: The percentage of memory usage by the process.
- TIME+: The total CPU time used by the process.
- COMMAND: The name of the command that started the process
Using the dmidecode Command
The dmidecode command in Linux is a tool that can be used to retrieve hardware information, including memory usage. It requires root privileges and reads the system's DMI (Desktop Management Interface) table, which contains detailed information about its hardware components. This can include details about the motherboard, processor, BIOS, and memory.
To check memory usage with dmidecode, you can use the following command:
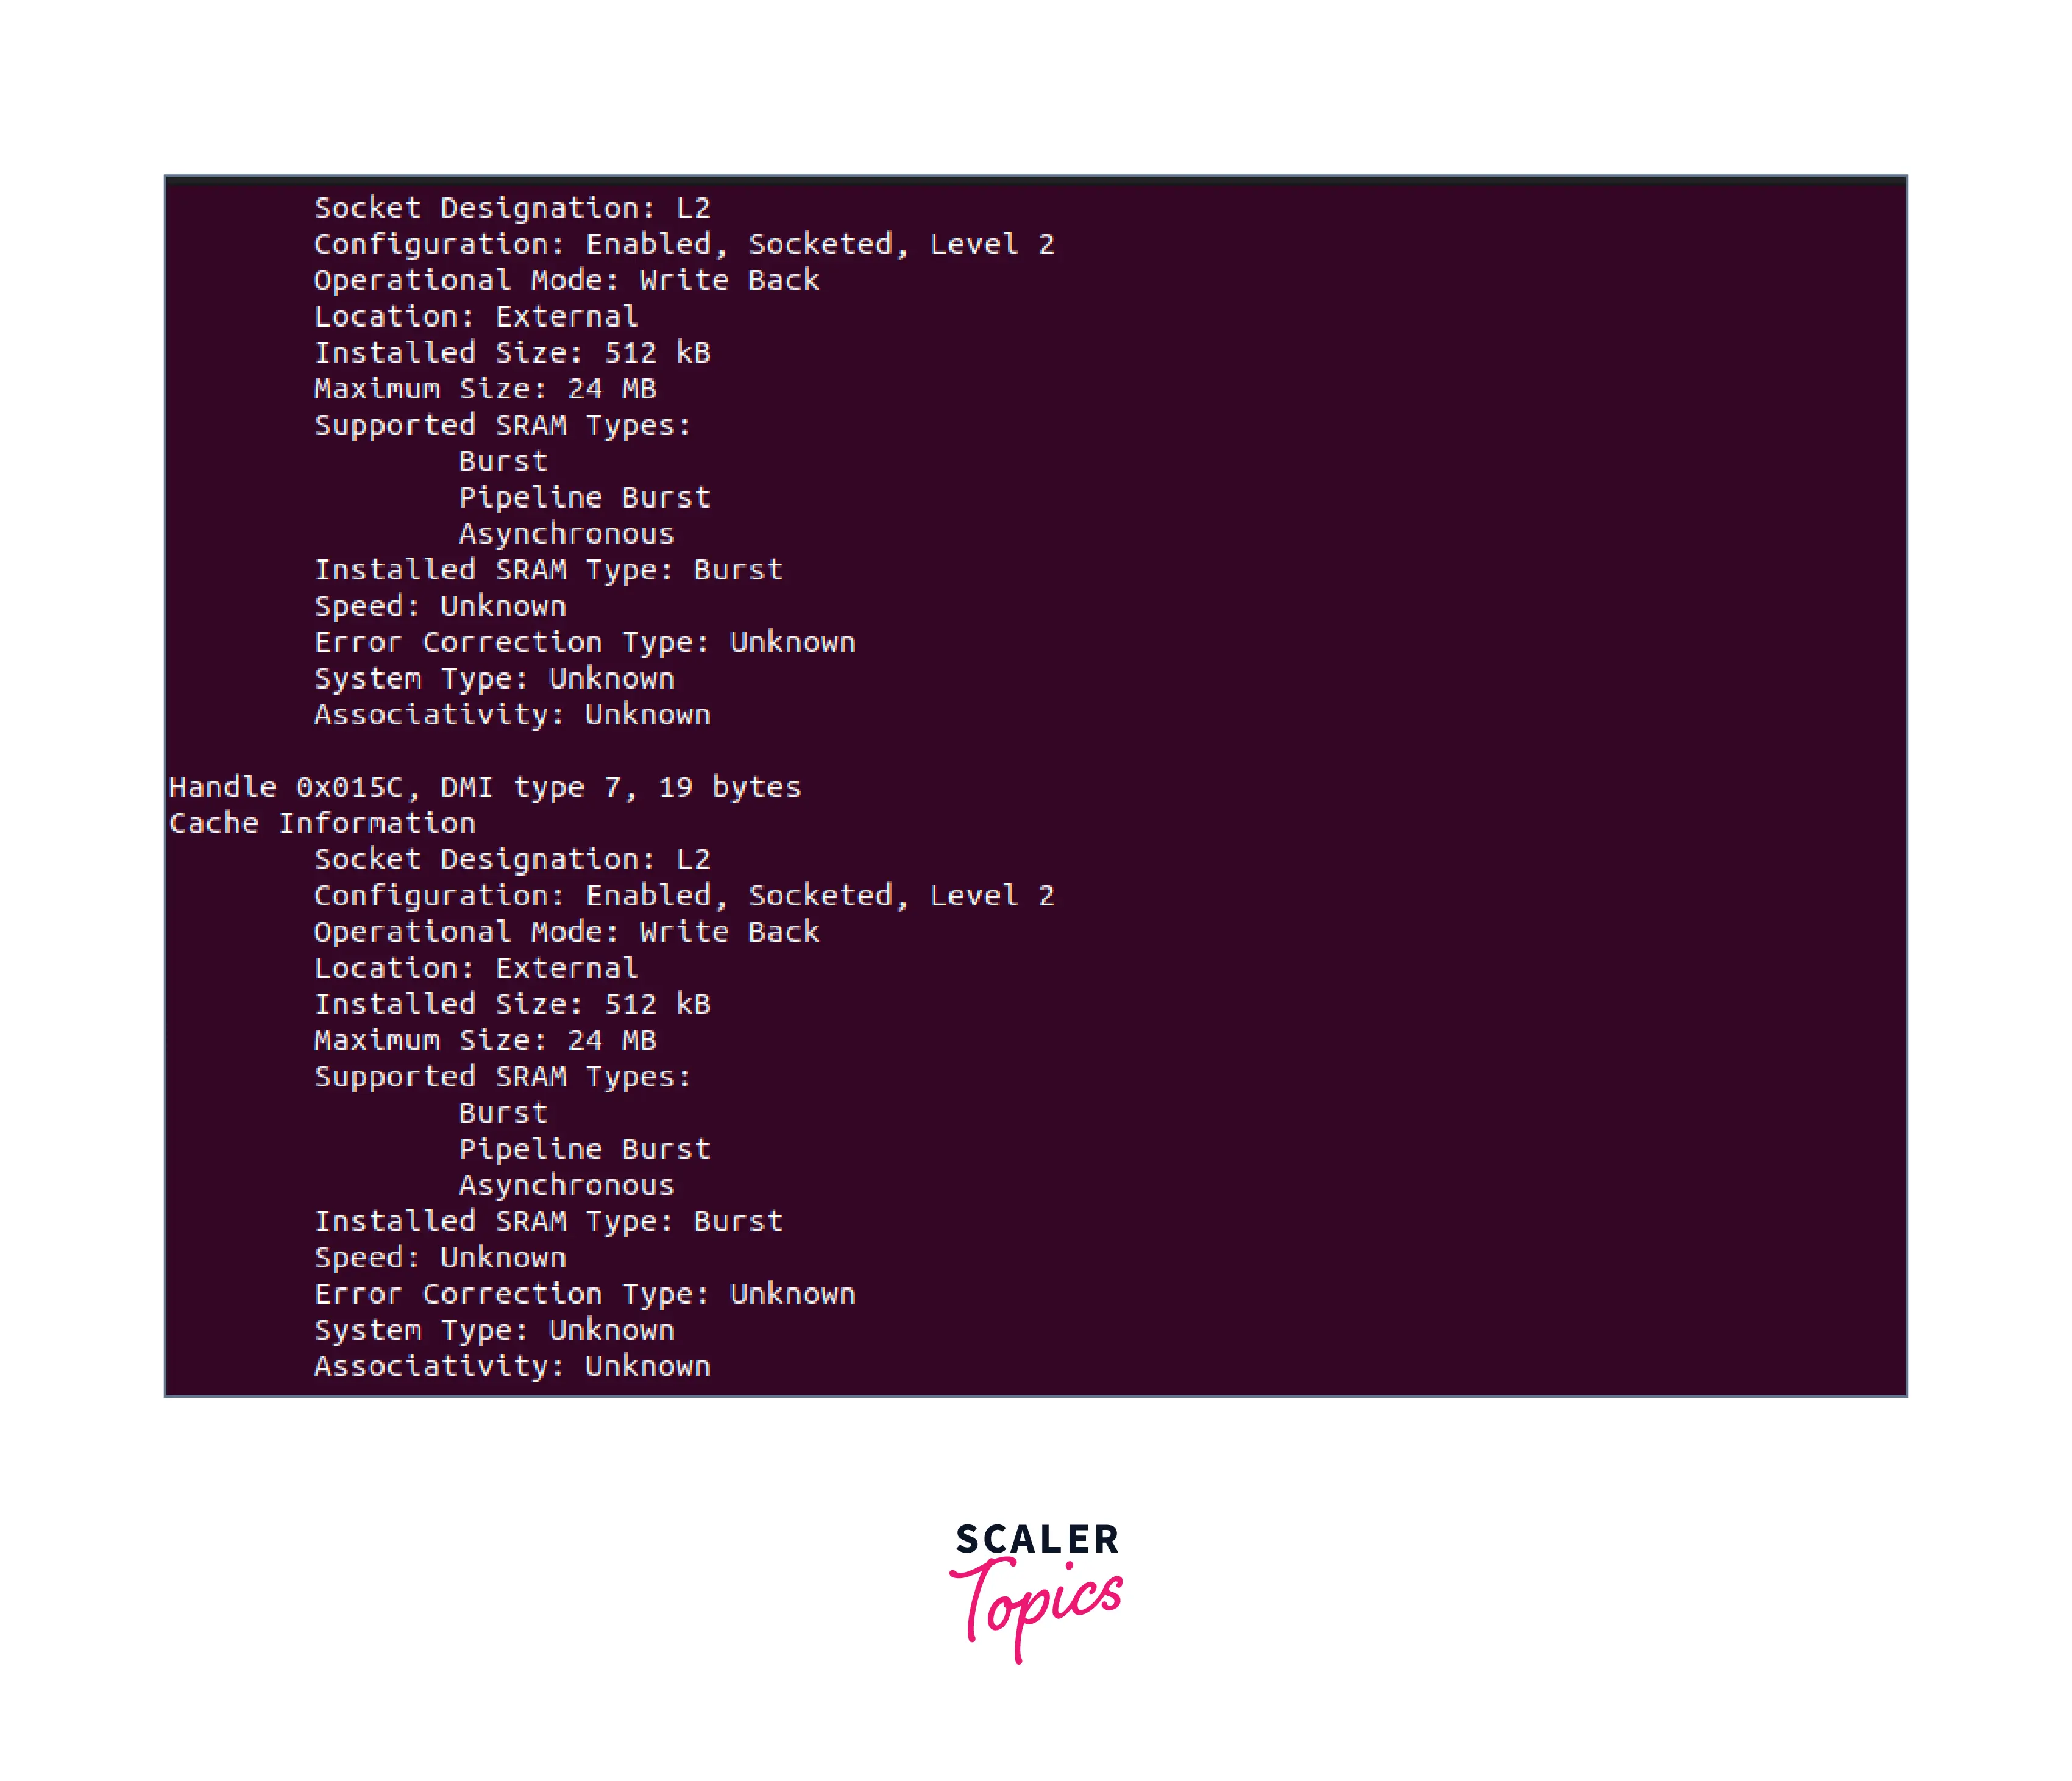
The command will display information about the memory modules installed in the system, including the type, speed, and size of each module.
In the above example, the sudo command is used to provide root privileges to dmidecode. The -t option is used to specify the type of hardware information to retrieve and 17 is the type number that corresponds to the memory module type in the DMI table.
Checking Memory Usage in Linux Using the GUI
In Linux, you can also check memory usage using a graphical user interface (GUI) system monitor tool that provides an intuitive graphical representation of system resource utilization.
One of the popular GUI tools for monitoring memory usage is the GNOME System Monitor. It is available on most Linux distributions with a GNOME desktop environment. To open the GNOME System Monitor, go to the Applications menu and search for "System Monitor".
Once opened, it will display detailed information about the system's resource usage, including memory usage.
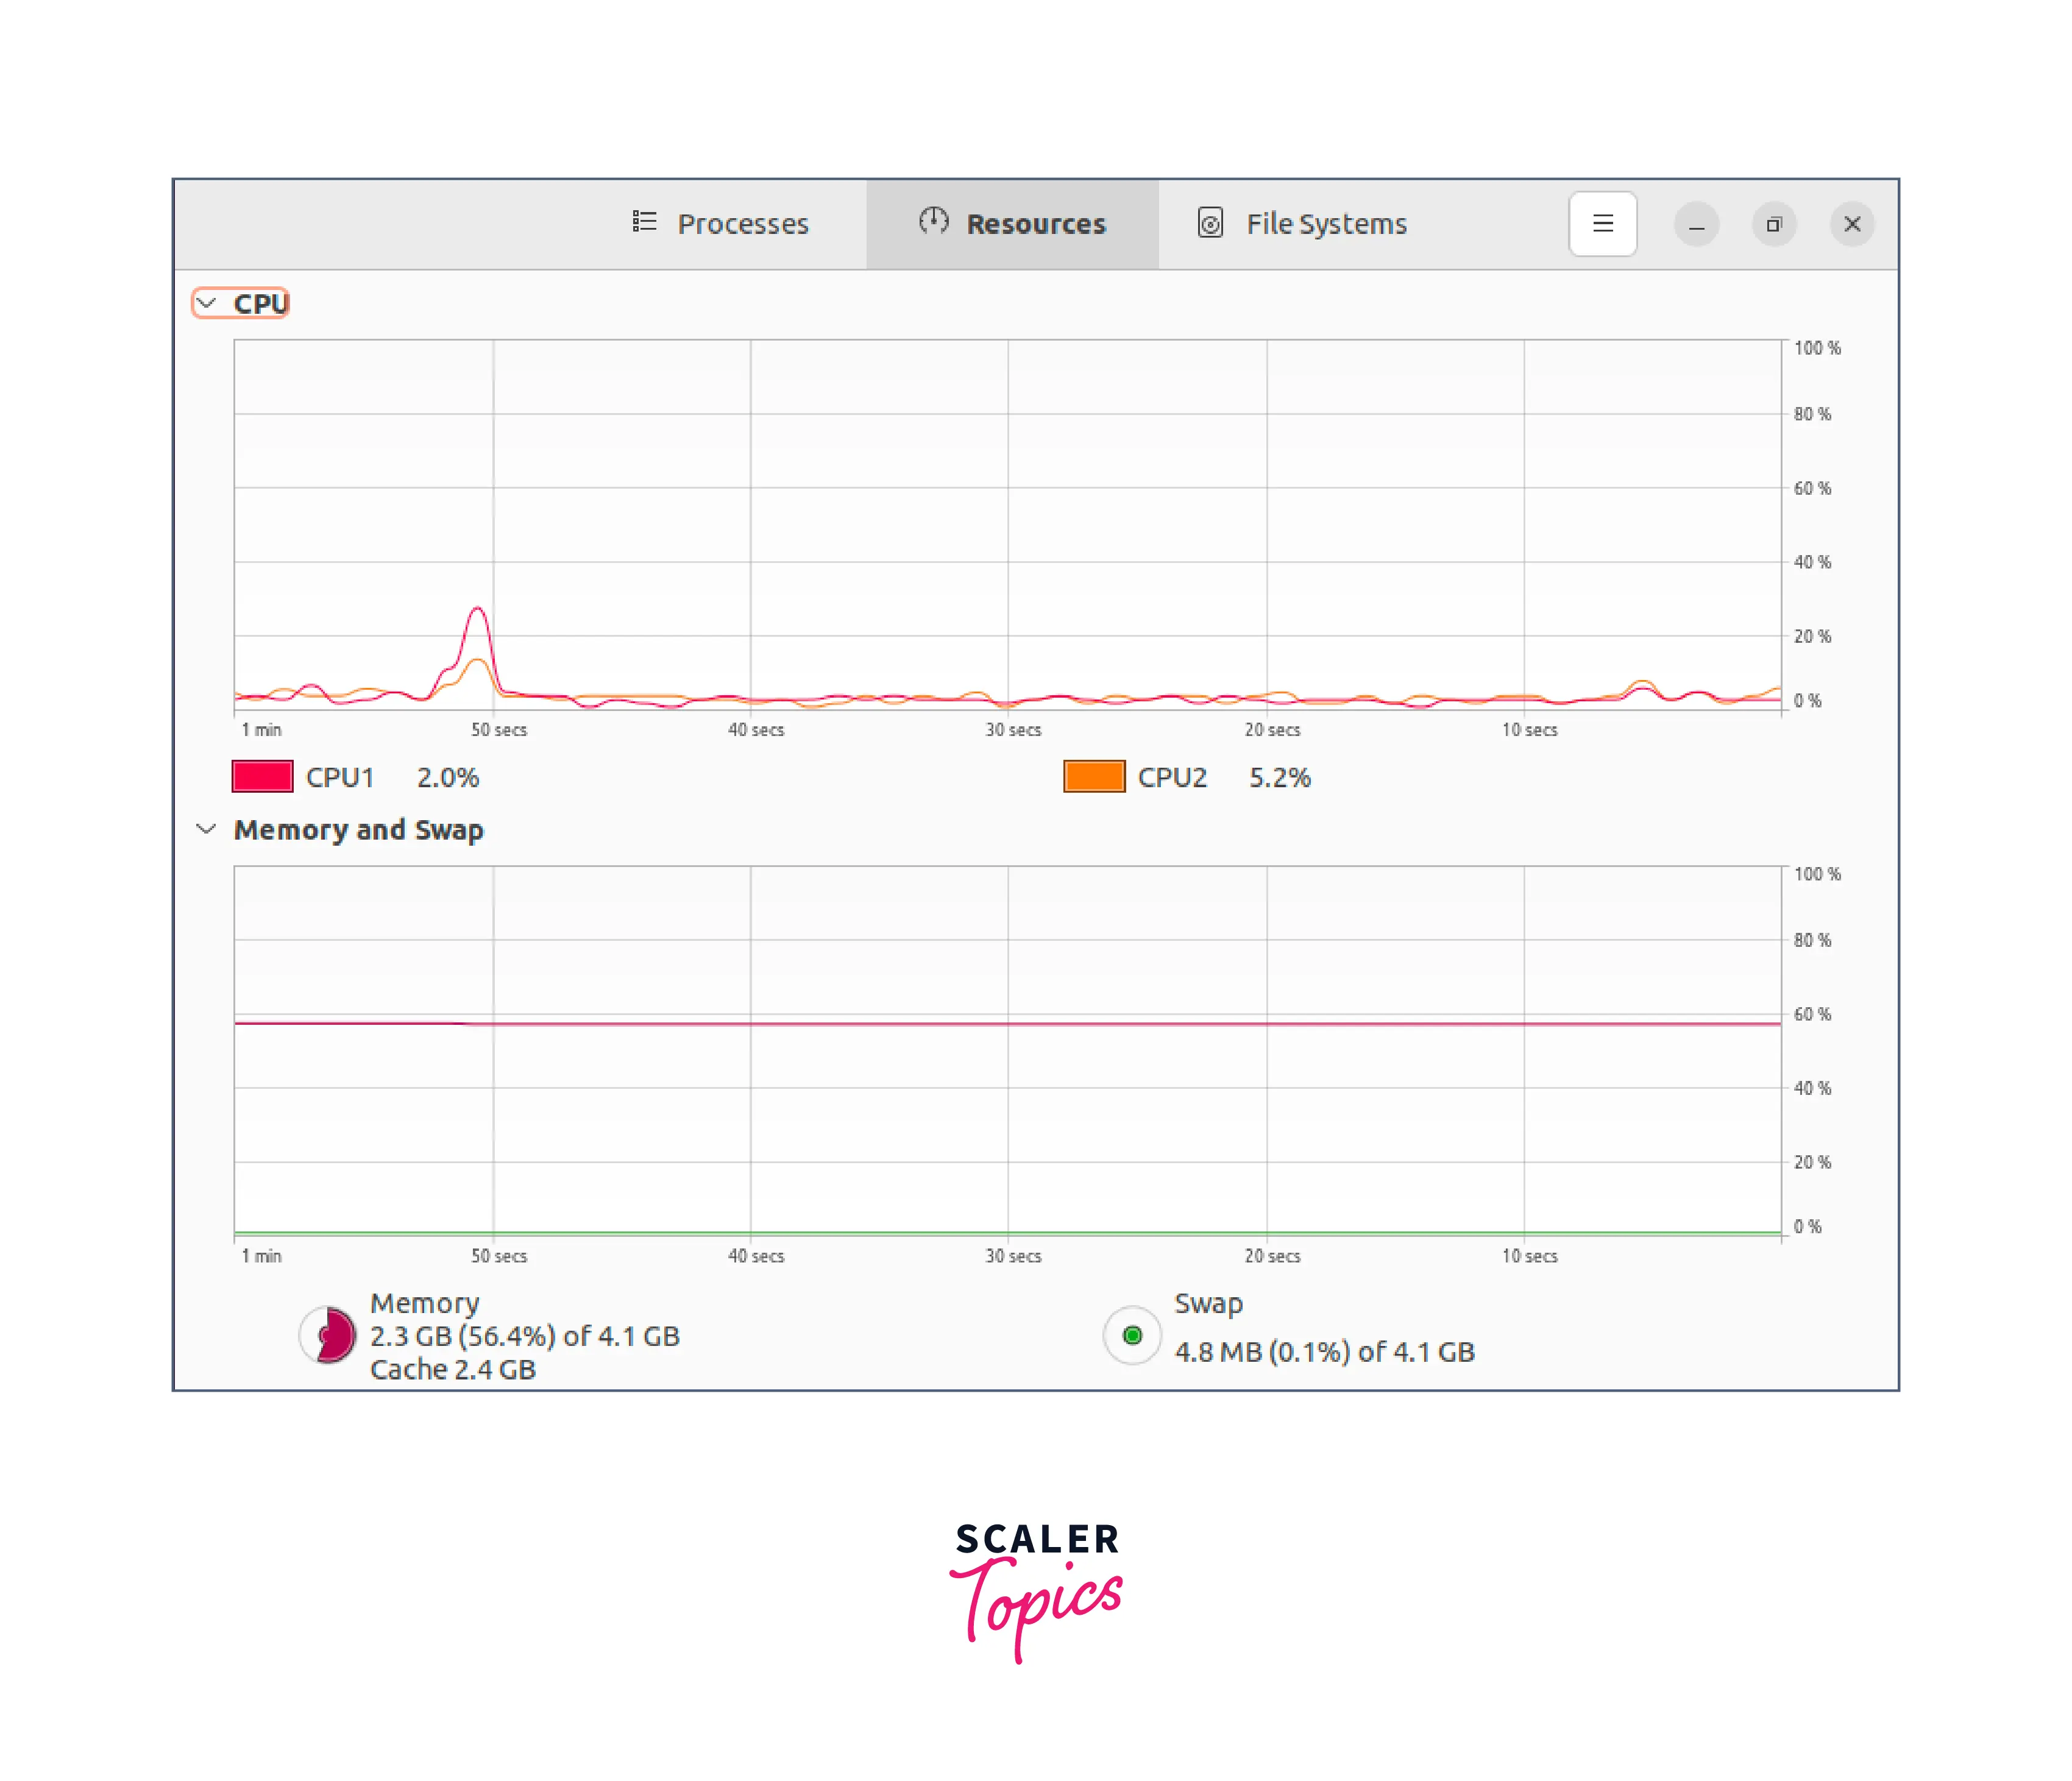
The above example is the graphical representation of the memory usage information, available in the "Resources" tab of the System Monitor.
Conclusion
- It is essential for us to check the memory usage of our operating systems to ensure their smooth functioning.
- To check Linux memory usage, various command line tools are available, such as top, free, vmstat, and dmidecode.
- Using the top and vmstat, we can monitor memory usage in real-time from the terminal itself.
- We can also check Linux memory usage from the GUI using tools such as the GENOME System Monitor.