WO2016041073A1 - Device and method for monitoring fat balance - Google Patents
Device and method for monitoring fat balance Download PDFInfo
- Publication number
- WO2016041073A1 WO2016041073A1 PCT/CA2015/050897 CA2015050897W WO2016041073A1 WO 2016041073 A1 WO2016041073 A1 WO 2016041073A1 CA 2015050897 W CA2015050897 W CA 2015050897W WO 2016041073 A1 WO2016041073 A1 WO 2016041073A1
- Authority
- WO
- WIPO (PCT)
- Prior art keywords
- light
- blood
- ttg
- baseline
- another embodiment
- Prior art date
Links
Classifications
-
- A—HUMAN NECESSITIES
- A61—MEDICAL OR VETERINARY SCIENCE; HYGIENE
- A61B—DIAGNOSIS; SURGERY; IDENTIFICATION
- A61B5/00—Measuring for diagnostic purposes; Identification of persons
- A61B5/48—Other medical applications
- A61B5/4836—Diagnosis combined with treatment in closed-loop systems or methods
-
- A—HUMAN NECESSITIES
- A61—MEDICAL OR VETERINARY SCIENCE; HYGIENE
- A61B—DIAGNOSIS; SURGERY; IDENTIFICATION
- A61B5/00—Measuring for diagnostic purposes; Identification of persons
- A61B5/145—Measuring characteristics of blood in vivo, e.g. gas concentration, pH value; Measuring characteristics of body fluids or tissues, e.g. interstitial fluid, cerebral tissue
- A61B5/1455—Measuring characteristics of blood in vivo, e.g. gas concentration, pH value; Measuring characteristics of body fluids or tissues, e.g. interstitial fluid, cerebral tissue using optical sensors, e.g. spectral photometrical oximeters
-
- A—HUMAN NECESSITIES
- A61—MEDICAL OR VETERINARY SCIENCE; HYGIENE
- A61B—DIAGNOSIS; SURGERY; IDENTIFICATION
- A61B5/00—Measuring for diagnostic purposes; Identification of persons
- A61B5/48—Other medical applications
- A61B5/4866—Evaluating metabolism
-
- A—HUMAN NECESSITIES
- A61—MEDICAL OR VETERINARY SCIENCE; HYGIENE
- A61B—DIAGNOSIS; SURGERY; IDENTIFICATION
- A61B5/00—Measuring for diagnostic purposes; Identification of persons
- A61B5/48—Other medical applications
- A61B5/4869—Determining body composition
- A61B5/4872—Body fat
Definitions
- a method, and a wearable device that can provides an objective and accurate data regarding user caloric balance, in real time, is highly needed. This data will enable the user to control his food amount and type for the day, and to know whether he had burned more energy than consumed.
- the real time daily feedback is a powerful tool for changing habits and acquiring a healthier life style regarding nutrition and physical activity.
- This invention provides a new method and device for providing a real time feedback to an individual regarding the balance between the amount and type of food consumed, and his physical activity intensity and duration, in order to reduce the access amount of fat stored in the body or to prevent accumulation of fat.
- the new method is based on continues or sequential measurement or estimation of triglycerides (TG) concentration in blood or total triglycerides (TTG) concentration in blood or TG-rich lipoproteins (TRL) particles (e.g. chylomicrons (CM), very low density lipoproteins (VLDL)) concentration in blood.
- TTG triglycerides
- TTG-rich lipoproteins (TRL) particles e.g. chylomicrons (CM), very low density lipoproteins (VLDL)
- TRL Consumption of excess fat increases TRL and TTG blood levels, the increase start about 1 hour after fat consumption, and reach to a peak value after 2-3 hours (Richard B et al. 2003).
- Liponeogenesis is the conversion of the carbohydrate excess, mainly by the liver, to TG, and its secretion as VLDL to the blood circulation system for transfer to long term storage in fat tissue. Increase in physical activity causes faster clearance of TRL from the blood vessels and reduced VLDL production.
- TRL and TTG blood levels at any given time represent the bottom line of the excess fats and carbohydrate consumed, that are about to be cleared from the blood circulation and stored in the fat tissue.
- the triglycerides in the fat tissue are firstly degrade to a small fatty acid fragment that travel in the circulation, not as lipoprotein particles, and later oxidized in the cells. Therefore, continues monitoring of TTG or TRL levels in the blood can be used as biomarker for the balance between the amount carbohydrate and fats consumed and physical activity intensity and duration. This biomarker assists in preventing accumulation of fat in the body, or reducing the amount of fat stored in the fat tissues.
- TTG or TRL in this invention can be done at least once in
- the baseline level of the TTG or TRL is defined as TTG or TRL level that is measured in the early morning time before wake up, or before the first meal of the day during the morning time, for example, at between 2 am to 6am.
- the first baseline measurement is done after the user was in fasting of at least 6 hours or at least 8 hours, or at least 10 hours before the baseline measurement, and this value can be further used as a reference baseline for comparison to the following baseline measurements.
- a baseline level is measured and set at early morning time.
- the baseline value is then subtracted from the following measurements of the day, and the net TTG values (TTG value after subtraction of the baseline) for the following measurement are accumulated, i.e. an integral is calculated of the area confined between the net TTG and the baseline level, see figure 2.
- This net accumulated TTG value (NATTG), is affected by the daily food consumption and activity balance and acts as a biomarker for food versus activity balance.
- the NATTG is calculated over the baseline value that is zero. In yet another embodiment of the invention the NATTG is calculated based on a reference baseline values that was measured after fasting.
- a reference NATTG accumulation graph for every time of the day is set by calculation of the average NATTG values recorded in a group of apparently healthy individuals, during at least one full day, in which they were balanced regarding the caloric intake and caloric expenditure.
- a reference baseline value is set by calculation of the average baseline values recorded in a group of apparently healthy individuals, during at least one full day, in which they were balanced regarding the caloric intake and caloric expenditure.
- the user By comparing the individual NATTG value of the user, as measured in a certain time point to a reference NATTG value measured in the same time, the user gets a feedback for the given time, regarding how far he is from a balance point for the time passed from setting the baseline value.
- the reference is set as the NATTG profile of the user in a former day, in yet another embodiment as an average value of the user for past several days, at least 3 days, at least 10 days, at least 30 days or at least 365.
- the user is comparing the daily baseline value to a references baseline TTG value that was calculated as the average TTG value of a group of apparently healthy individuals that were balanced in the day before measurement regarding caloric intake and expenditure.
- the value is calculated based on the average baseline of the user in former day, in the former days for at least 3 days, at least 10 days, at least 30 days, or at least 365.
- the measured baseline and NATTG values are used to direct the user how to manage his food consumption versus his physical activity in order to maintain or lose weight by maintaining or decreasing the amount of fat tissue in his body.
- the objective of the user is to achieve NATTG value that will not be higher than the reference value. If the NATTG is above reference value, the user has to increase his physical activity and/or decrease his fats and carbohydrates consumption. If the user wants to reduce weight he has to maintain NATTG values lower than the NATTG reference value for at least one day, or at least one week or at least one month.
- the objective of the user is to achieve baseline TTG value that will not be higher than the reference baseline TTG value.
- the user has to increase his physical activity and/or decrease his fats and carbohydrates consumption during the following day. If the user wants to maintain weight he has to maintain, each day, baseline TTG values that are similar to the reference baseline. If the user wants to reduce weight he has to maintain each day, a lower baseline TTG then the reference baseline TTG.
- Figure 3 describes the flowchart of the method.
- the estimation of TTG blood level can be done non-invasivcly by measurement of light scattering coefficient of the blood in a blood vessel near the skin. Increase in concentration and size TRL particles increases the blood light scattering coefficient.
- the measurement of the blood light scattering coefficient can be done by an implemented device located under the skin nee by a blood vessel.
- the estimation of the blood light scattering coefficient can be done by illuminating continuous light at a point on the skin just above a blood vessel that is close to the skin surface, and measuring the intensity of the backscattered light at another point with the distance p from the light source, above the same blood vessel.
- the backscattered light detection point is located above the same blood vessel, in such a way the backscatter light passed mostly through the interior of the said blood vessel .
- S 0 , ⁇ s , ⁇ ⁇ are the intensity of the light source, the (reduced) scattering coefficient and the absorption coefficient of the blood, respectively. If S 0 , ⁇ ⁇ and p are fixed during repeated measurements, the changes in R (p) correlated to the charges in the light scattering coefficient of the blood. Increase in R(p) indicates decrease in the and vice versa.
- the measurement of the changes in the blood scattering coefficient in done by using one light source and one detector at distance of 3-30 mm, or 5- 15mm between them. See figure 4 A.
- the estimation of blood scattering coefficient will be achieved by taking two measurement at once from two different detectors placed at different distances from one light source, See figure 4 B .
- the estimation will be achieved by taking two measurements using one detector and two light sources each placed at different distance from the detector.
- the measurements from each light source is separated by time, e,g, the light sources are illuminating at different times, and the measurements recorded using the same light detector but in different times, see figure 4C.
- the noninvasive measurement of TTG or TRL can done by a wearable device, which contains a light source that produces light at defined wave length of 700nm to 900nm (in the near infra-red band) with a directional light emission.
- the light source can be a light emitting diode (LED), a laser, or a laser diode.
- the light detector can be a photo diode.
- the light emission is directed to the blood vessel, or to the skin.
- the wearable device is located on the body in such a way that the light source is located above a blood vessel near the skin.
- the blood vessel is a vain
- the device is worn as a bracelet.
- the device includes a first light detector with a detection range of 700nm-900nm, located above the said blood vessel that the light source is located on, at a distance of 5- 15 mm from the light sources.
- the device includes as well a second light detector at a distance of 15-25 mm from the first light detector.
- the device includes two light sources and one detector and the measurements are separated by time. The light source and the light detectors are located in such a way that the light that is detected by the detectors passes mostly through the interior of the blood vessel (figure 4).
- the device includes a control unit that includes memory device, an electric power source, a clock and a communication module that is used to transmit the processed data to a smart phone or computer.
- the device can have a display unit to display the accumulated fat balance factor and the baseline TTG level (see Figure 4 D).
- the device includes as well a 3 dimensional accelerometer to identify the time periods where the user does not move in order to allow starting a new measurement. See figure 4 D.
- the device is an implantable device and is implanted in the body, in parallel to a blood vessel in such a way that the scattered light detected by the detector passes through the interior of the blood vessel.
- the light scattering sensor includes another set light sources (500-600 nm wavelength) and light detector (500-600 nm wavelength) used the verify that the light sources and detectors (700-900 nm wavelength) are located exactly above the said blood vessel, in such a way that the light emitted from the light source passes through the blood vessel and scattered within it before it is detected by the detectors. This is done to make sure that the light source (700-900 nm wavelength) and the light detector (700-900 nm wavelength) or, the light source (700-900 nm wavelength) and the two detectors (700-900 nm wavelength), or the 2 light sources
- a second directional light source emitting light at 500-600 nm wavelength is located adjacent to the first light source at a distance of no more than 0.5mm or 1 mm from it, and a light detector unit that detects the scattered light at 500-600 nm wavelength is located adjacent to the first light detector unit of 700-900nm at a distance of no more than 0.5mm or ] mm from it.
- the second set of light sources and detectors at 500-600nm is used to identify if a blood vessel is located just below the light source.
- the absorbance coefficient of blood at 500-600nm wave length range is extremely high, thus allowing only low amount of backscattering light to be detected, if the light source and the light detector are above a blood vessel having diameter of at least 0.5mm, or at least 1 mm, or at least 2 mm, or at least 5 mm. If the backscattering light (level at 500-600nm wave length range, detected by the detector is below certain trash hold, the trash hold was set by measurement the backscattering when the light source and detector were located directly above a blood vessel.
- the levels is compared to the backscattering light from an adjacent set of light source, that is not located above a blood vessel having diameter of at least 1 mm than it means that the first light source and detectors are located directly above the blood vessel.
- the device is an implantable device and is implanted in parallel to a blood vessel in such a way that the scattered light that detected by the detector passed through the interior of the blood vessel.
- the blood light scattering sensor is an array of 2 or more sensors each sensor includes at least one light detector and one light source (See figure 5).
- Figure 1 A illustrates the sources and path of carbohydrate and TTG in the blood circulation system;
- Figure 1 B illustrates the factors that affect TTG blood levels.
- Figure 2. Shows regular profile of TTG during 2 days, and the base line, and how the NATTG is calculated.
- Figure 3 Presents block diagram describing the flow chart of the method for daily management of food consumption vs physical activity based on sequential measurements of TTG blood concentration.
- Figure 4 Presents schematic blocks diagram of the device and sensor for non-invasive or implanted measurement of TTG concentrating in blood based on light scattering.
- Figure 5 Presents schematic description of the different option for arrangement of the light sources and detectors in sensor for noninvasive measurement of blood light scattering.
- Figure 6 Presents flow chart for overcoming movement artifacts in measurement blood light scattering coefficient.
- Lipoproteins are complex aggregates of lipids and proteins that render the lipids compatible with the aqueous environment of body fluids and enable their transport throughout the body of all vertebrates via blood circulation system to tissues where they are required.
- the most abundant lipid constituents are iriacylglycerol (that are named triglycerides as well), free cholesterol, cholesterol esters and phospholipids.
- Lipoproteins particles are classified as chylomicrons (CM), very-low-density lipoproteins (VLDL), low-densi ty lipoproteins (LDL) and high-density lipoproteins (HDL), Compositional details are listed in Table 1 .
- Lipoproteins particles are synthesized mainly in intestine and the liver and transported to the blood circulations system. Within the circulation, these aggregates are in a state of constant flux, changing in composition and physical structure as the peripheral tissues take up the various components before the remnants return to the liver, a reference is made to figure 2 A.
- the main macronutrient types in the human food are proteins, carbohydrate and fats.
- food is processed, and degraded to the basic building blocks: protein to amino acids, carbohydrate to mono saccharides (mainly glucose and fructose), and fats to fatty acids, all transported to the blood circulation.
- CM transport dietary lipids from the intestine to storage in the fat tissues throughout the body,
- CM half life time in the circulation is about 1 hour.
- VLDL particles are assembled in the liver from endogenous lipids (mainly triglycerides) and transported via blood circulation to the fat tissues. VLDL particles have a half life time of several hours. CM and VLDL metabolism and regulation is affected by the amount of carbohydrate consumed. High levels of carbohydrate Triglyceride levels vary quite a bit over short time periods. A meal containing high levels of sugar, fat, or alcohol can raise the triglyceride level drastically.
- Light scattering coefficient is the fractional rate in the transmission of radiation through a scattering medium (as of light through fog) at which the flux density of radiation decreases by scattering in respect to the thickness of the medium traversed.
- the scattering properties are mainly determined by the size of the scattering particles relative to the wavelength of light, and by the refractive index mismatch between the scattering particles and the surrounding medium.
- the scattering centers are cells and cellular organelles.
- cellular organelles In the medical spectral window (700-900 nm), cellular organelles have dimensions comparable to the wavelength, and their index of refraction is relatively close to that of the cytosol and extracellular fluid.
- light scattering in tissue is mainly forward directed (i.e. the scattering angle ⁇ is less than
- I/I ! s is the average distance traveled by a photon between successive scattering events.
- This invention provides a new method and device for providing a real time feedback to an individual regarding the balance between the amount and type of food consumed, and his physical activity intensity and duration, in order to reduce the access amount of fat stored in the body or to prevent accumulation of fat.
- This invention provides a new method and device for providing a real time feedback to an individual regarding the balance between the amount and type of food consumed, and his physical activity intensity and duration, in order to reduce the access amount of fat stored in the body or to prevent accumulation of fat.
- the new method is based on continues or sequential measurement or estimation of triglycerides (TG) concentration in blood or total triglycerides (TTG) concentration in blood or TG-rich lipoproteins (TRL) particles (e.g. chylomicrons (CM), very low density lipoproteins (VLDL)) concentration in blood.
- TTG triglycerides
- TTG-rich lipoproteins (TRL) particles e.g. chylomicrons (CM), very low density lipoproteins (VLDL)
- TRL Consumption of excess fat increases TRL and TTG blood levels, the increase start about 1 hour after fat consumption, and reach to a peak value after 2-3 hours (Richard B et al. 2003). Consumption of excess carbohydrate or alcohol increases TRL levels by increasing the liponeogenesis (Regina M McDevitt et al. 2001 , Kevin Jacheson et al.
- Liponeogenesis is the conversion of the carbohydrate excess, mainly by the liver, to TG, and its secretion as VLDL to the blood circulation system for transfer to long term storage in fat tissue.
- Increase in physical activity causes faster clearance of TRL from the blood vessels and reduced VLDL production.
- Increase in physical activity causes a decrease in the fasting TTG level in the morning after the day where the activity was performed (Elena Bellou et al. 2013), sec figure 1 A and B.
- the TRL and TTG blood levels at any given time represent the bottom line of the excess fats and carbohydrate consumed, that are about to be cleared from the blood circulation and stored in the fat tissue.
- the triglycerides in the fat tissue are firstly degrade to a small fatty acid fragment that travel in the circulation, not as lipoprotein particles, and later oxidized in the cells. Therefore, continues monitoring of TTG or TRL levels in the blood can be used as biomarker for the balance between the amount carbohydrate and fats consumed and physical activity intensity and duration. This biomarker assists in preventing accumulation of fat in the body, or reducing the amount of fat stored in the fat tissues.
- TTG or TRL in this invention can be done at least once in
- the baseline level of the TTG or TRL is defined as TTG or TRL level that is measured in the early morning time before wake up, or before the first meal of the day during the morning time, for example, at between
- the first baseline measurement is done after the user was in fasting of at least 6 hours or at least 8 hours, or at least 10 hours before the baseline measurement, and this value can be further used as a reference baseline for comparison to the following baseline measurements.
- a baseline level is measured and set at early morning time.
- the baseline value is then subtracted from the following measurements of the day, and the net TTG values (TTG value after subtraction of the baseline) for the following measurement are accumulated, i.e. an integral is calculated of the area confined between the net TTG and the baseline level, see figure 2.
- This net accumulated TTG value (NATTG), is affected by the daily food consumption and activity balance and acts as a biomarker for food versus activity balance.
- the NATTG is calculated over the baseline value that is zero. In yet another embodiment of the invention the NATTG is calculated based on a reference baseline values that was measured after fasting.
- a reference NATTG accumulation graph for every time of the day is set by calculation of the average NATTG values recorded in a group of apparently healthy individuals, during at least one full day, in which they were balanced regarding the caloric intake and caloric expenditure.
- a reference baseline value is set by calculation of the average baseline values recorded in a group of apparently healthy individuals, during at least one full day, in which they were balanced regarding the caloric intake and caloric expenditure.
- the user By comparing the individual NATTG value of the user, as measured in a certain time point to a reference NATTG value measured in the same time, the user gets a feedback for the given time, regarding how far he is from a balance point for the time passed from setting the baseline value.
- the reference is set as the
- NATTG profile of the user in a former day in yet another embodiment as an average value of the user for past several days, at least 3 days, at least 10 days, at least 30 days or at least 365.
- the user is comparing the daily baseline value to a references baseline TTG value that was calculated as the average TTG value of a group of apparently healthy individuals that were balanced in the day before measurement regarding caloric intake and expenditure.
- the value is calculated based on the average baseline of the user in former day, in the former days for at least 3 days, at least 10 days, at least 30 days, or at least 365.
- the measured baseline and NATTG values are used to direct the user how to manage his food consumption versus his physical activity in order to maintain or lose weight by maintaining or decreasing the amount of fat tissue in his body.
- the objective of the user is to achieve NATTG value that will not be higher than the reference value. If the NATTG is above reference value, the user has to increase his physical activity and/or decrease his fats and carbohydrates consumption. If the user wants to reduce weight he has to maintain NATTG values lower than the NATTG reference value for at least one day, or at least one week or at least one month.
- the objective of the user is to achieve baseline TTG value that will not be higher than the reference baseline TTG value.
- the user has to increase his physical activity and/or decrease his fats and carbohydrates consumption during the following day. If the user wants to maintain weight he has to maintain, each day, baseline TTG values that are similar to the reference baseline. If the user wants to reduce weight he has to maintain each day, a lower baseline TTG then the reference baseline TTG.
- Figure 3 describes the flowchart of the method.
- the estimation of TTG blood level can be done non-invasively by measurement of light scattering coefficient of the blood in a blood vessel near the skin. Increase in concentration and size TRL particles increases the blood light scattering coefficient.
- the measurement of the blood light scattering coefficient can be done by an implemented device located under the skin nee by a blood vessel.
- the estimation of the blood light scattering coefficient can be done by illuminating continuous light at a point on the skin just above a blood vessel that is close to the skin surface, and measuring the intensity of the backscattered light at another point with the distance p from the light source, above the same blood vessel.
- the backscattered light detection point is located above the same blood vessel, in such a way the backscatter light passed mostly through the interior of the said blood vessel.
- the estimation of blood scattering coefficient will be achieved by taking two measurement at once from two different detectors placed at different distances from one light source, see figure 4 B .
- the estimation will be achieved by taking two measurements using one detector and two light sources each placed at different distance from the detector.
- the measurements from each light source is separated by time, e,g, the light sources are illuminating at different times, and the measurements recorded using the same light detector but in driftnet times, see figure 4C.
- TRL can done by a wearable device, which contains a light source that produces light at defined wave length of 700nm to 900nm (in the near infra-red band) with a directional light emission.
- the light source can be a light emitting diode (LED), a laser, or a laser diode.
- the light detector can be a photo diode.
- the light emission is directed to the blood vessel, or to the skin.
- the wearable device is located on the body in such a way that the light source is located above a blood vessel near the skin.
- the blood vessel is a vain
- the device is worn as a bracelet.
- the device includes a first light detector with a detection range of 700nm-900nm, located above the said blood vessel that the light source is located on, at a distance of 5-15 mm from the light sources.
- the device includes as well a second light detector at a distance of 15-25 mm from the first light detector.
- the device includes two light sources and one detector and the measurements are separated by time. The light source and the light detectors are located in such a way that the light that is detected by the detectors passes mostly through the interior of the blood vessel (figure 4).
- the device includes a control unit that includes memory device, an electric power source, a clock and a communication module that is used to transmit the processed data to a smart phone or computer.
- the device can have a display unit to display the accumulated fat balance factor and the baseline TTG level (see Figure 4 D).
- the device includes as well a 3 dimensional accelerometer to identify the time periods where the user does not move in order to allow starting a new measurement, see figure 4 D.
- the device is an implantable device and is implanted in the body, in parallel to a blood vessel in such a way that the scattered light detected by the detector passes through the interior of the blood vessel.
- the light scattering sensor includes another set light sources (500-600 nm wavelength) and light detector (500-600 nm wavelength) used the verify that the light sources and detectors (700-900 nm wavelength) are located exactly above the said blood vessel, in such a way that the light emitted from the light source passes through the blood vessel and scattered within it before it is detected by the detectors. This is done to make sure that the light source (700-900 nm wavelength) and the light detector (700-900 nm wavelength) or, the light source (700-900 nm wavelength) and the two detectors (700-900 nm wavelength), or the 2 light sources
- a second directional light source emitting light at 500-600 nm wavelength is located adjacent to the first light source at a distance of no more than 0.5mm or 1 mm from it, and a light detector unit that detects the scattered light at 500-600 nm wavelength is located adjacent to the first light detector unit of 700-900nm at a distance of no more than 0.5mm or 1 mm from it.
- the second set of light sources and detectors at 500-600nm is used to identify if a blood vessel is located just below the light source.
- the absorbance coefficient of blood at 500-600nm wave length range is extremely high, thus allowing only low amount of backscattering light to be detected, if the light source and the light detector are above a blood vessel having diameter of at least 0.5mm, or at least 1 mm, or at least 2 mm, or at least 5 mm. If the backscattering light (level at 500-600nm wave length range, detected by the detector is below certain trash hold, the trash hold was set by measurement the backscattering when the light source and detector were located directly above a blood vessel .
- the levels is compared to the backscattering light from an adjacent set of light source, that is not located above a blood vessel having diameter of at least 1 mm than it means that the first light source and detectors are located directly above the blood vessel, (figures 4 E and 5).
- the device also includes a control unit, an electric power source, a memory device, a clock and a communication module, used to transmit the processed data to a smart phone or computer.
- the device can have a display unit to display the accumulated fat balance factor and the baseline TTG level (figure 4 - block diagram).
- the control unit e.g., a microprocessor, is responsible for real-time quantitative analysis of light scattering coefficient.
- the control unit drives light source to emit light in accordance with various emission parameters, such as duty cycle (e.g., number and/or timing of hours of operation per day) and amplitudes.
- duty cycle e.g., number and/or timing of hours of operation per day
- amplitudes e.g., amplitude of light intensity in the detector position.
- the power source is coupled to the device to supply power for the control units, light sources and detectors and additional modules attached (like 3D accelerometer).
- the power source can be a battery, a rechargeable battery, or a power source that harvest kinetic, thermal or solar energy.
- the display unit e.g. LCD is used to display primary measures and display alerts and status of the user's caloric balance.
- a communication module e.g., Bluetooth or wired interface, is able to transmit measures, alerts and statuses to an external display module or a PC. Also it able to receive relevant data needed to calibrate the analysis process in the control unit.
- the device includes a support on which the light source and detectors are mounted, in another embodiment the control unit and electrical source power, the memory unit, and communication units are also attached to the support.
- any measurement that involves electromagnetic radiation into living bodies by a wearable device is prone to movement artifact.
- the two main sources are: 1 , the relative movement of the device or sensor relatively to the body, and 2, changes in the tissue due to the body movement, e.g. pressure wave in the blood circulation system that affect volume and shape of blood vessels during the movement.
- the device includes as well a 3 dimensional accelerometer to identify the time period where the user dose not moves his hand. If the acceleration values in all 3 axes shows very low variation, that can be quantified for example as the coefficient of variance (100* Standard deviation/Average) of the multiple reading within a certain time frame, that is below 10%, below 3% or below 1 % this is an indication the device and the body are not moving.
- a 3 dimensional accelerometer to identify the time period where the user dose not moves his hand. If the acceleration values in all 3 axes shows very low variation, that can be quantified for example as the coefficient of variance (100* Standard deviation/Average) of the multiple reading within a certain time frame, that is below 10%, below 3% or below 1 % this is an indication the device and the body are not moving.
- Figure 6 describe the flowchart for identifying time period where the subject is not moving and the sensor is located above a suitable blood vessel for reliable measurement of the changes in blood scattering coefficient.
- the device is an implantable device and is implanted in parallel to a blood vessel in such a way that the scattered light that detected by the detector passed through the interior of the blood vessel.
- the blood light scattering sensor is an array of 2 or more sensors each sensor includes at least one light detector and one light source (see figure 5).
- Kazuya linaga Takeshi Namita, Member, IEEE, Toshihiro Sakurai, Hitoshi Chiba, and Koichi Shimizu, Attempt for Noninvasive Evaluation of in vivo Triglyceride in Blood* IEEE35th Annual International Conference of the IEEE EMBS Osaka, Japan, 3 - 7 July, 2013.
Abstract
A Device and method for monitoring the balance between the amount and type of food consumed versus the physical activity.
Description
DEVICE AND METHOD FOR MONITORING FAT BALANCE
BACKGROUND
[0001] Many Individuals both adults and children worldwide (especially in the industrialized societies) are overweight or obese. Overweight and obesity are major risk factors for cardiac diseases, cancer, diabetes and other diseases. Obesity is due to a sustained positive energy balance, i.e. in which an individual energy intake is greater than his energy expenditure for long time periods (weeks, months, years). Weight gain is typically coupled with low levels of physical activity and sedentary lifestyles, together with over consumption of food containing high levels of carbohydrates and fats. In order to maintain weight, one have to balance his energy intake versus energy expenditure, and in order to lose weight one have to keep his energy intake lower than his energy expenditure for long time period (weeks to months). In order to do so there is a need for providing an objective and continues feedback to the person regarding his energy balance during each day, and at the end of each day enabling him manage his food consumption versus his activity, for achieving an energy gap or the balance needed for weight loss or control.
[0002] Due to the importance of the problem, many solutions were suggested; however no good solution has been founded yet. Current solutions are based on using a wearable device that estimates user's energy expenditure 24/7, using an accelerometer. The accelerometer identifies body movements and estimation of energy expenditure is done, based on movement's pattern. Devices that provide energy expenditure estimation based
on heart rate pulse, and/or Global Positioning Systems are also available. For estimating energy intake, the user has to log manually the amount and type of food he consumed and to estimate the caloric value of the food consumed. Since both estimations of energy expenditure and energy consumption are extremely non accurate, it is prohibit calculating the true caloric balance on a daily or an hourly interval, thus prohibiting from providing the needed feedback for managing the energy balance. Therefore, a method, and a wearable device, that can provides an objective and accurate data regarding user caloric balance, in real time, is highly needed. This data will enable the user to control his food amount and type for the day, and to know whether he had burned more energy than consumed. The real time daily feedback is a powerful tool for changing habits and acquiring a healthier life style regarding nutrition and physical activity.
BRIEF SUMMARY OF THE INVENTION
[0003] This invention provides a new method and device for providing a real time feedback to an individual regarding the balance between the amount and type of food consumed, and his physical activity intensity and duration, in order to reduce the access amount of fat stored in the body or to prevent accumulation of fat.
[0004] The new method is based on continues or sequential measurement or estimation of triglycerides (TG) concentration in blood or total triglycerides (TTG) concentration in blood or TG-rich lipoproteins (TRL) particles ( e.g. chylomicrons (CM), very low density lipoproteins (VLDL)) concentration in blood. Blood TTG are known to be a surrogate for
TRL. Consumption of excess fat increases TRL and TTG blood levels, the increase start about 1 hour after fat consumption, and reach to a peak value after 2-3 hours (Richard B
et al. 2003). Consumption of excess carbohydrate or alcohol increases TRL levels by increasing the liponeogenesis (Regina M McDevitt et al. 2001 , Kevin Jacheson et al. 1988). Liponeogenesis is the conversion of the carbohydrate excess, mainly by the liver, to TG, and its secretion as VLDL to the blood circulation system for transfer to long term storage in fat tissue. Increase in physical activity causes faster clearance of TRL from the blood vessels and reduced VLDL production. Increase in physical activity causes a decrease in the fasting TTG level in the morning after the day where the activity was performed (Elena Bellou et al. 2013), see figure 1 A and B. The TRL and TTG blood levels at any given time represent the bottom line of the excess fats and carbohydrate consumed, that are about to be cleared from the blood circulation and stored in the fat tissue. When there is a need for using the fat as energy, the triglycerides in the fat tissue are firstly degrade to a small fatty acid fragment that travel in the circulation, not as lipoprotein particles, and later oxidized in the cells. Therefore, continues monitoring of TTG or TRL levels in the blood can be used as biomarker for the balance between the amount carbohydrate and fats consumed and physical activity intensity and duration. This biomarker assists in preventing accumulation of fat in the body, or reducing the amount of fat stored in the fat tissues.
[0005] The measurement of TTG or TRL in this invention can be done at least once in
24 hours, or at least twice in 24 hours, or at least every 6 hours, or at least every 3 hours.
The results are recorded and analyzed as follows: The baseline level of the TTG or TRL is defined as TTG or TRL level that is measured in the early morning time before wake up, or before the first meal of the day during the morning time, for example, at between 2 am to 6am. In another embodiment of the invention the first baseline measurement is
done after the user was in fasting of at least 6 hours or at least 8 hours, or at least 10 hours before the baseline measurement, and this value can be further used as a reference baseline for comparison to the following baseline measurements. In each of the following days, a baseline level is measured and set at early morning time. The baseline value is then subtracted from the following measurements of the day, and the net TTG values (TTG value after subtraction of the baseline) for the following measurement are accumulated, i.e. an integral is calculated of the area confined between the net TTG and the baseline level, see figure 2. This net accumulated TTG value (NATTG), is affected by the daily food consumption and activity balance and acts as a biomarker for food versus activity balance.
[0006] In yet another embodiment of the invention the NATTG is calculated over the baseline value that is zero. In yet another embodiment of the invention the NATTG is calculated based on a reference baseline values that was measured after fasting. A reference NATTG accumulation graph for every time of the day is set by calculation of the average NATTG values recorded in a group of apparently healthy individuals, during at least one full day, in which they were balanced regarding the caloric intake and caloric expenditure. A reference baseline value is set by calculation of the average baseline values recorded in a group of apparently healthy individuals, during at least one full day, in which they were balanced regarding the caloric intake and caloric expenditure. By comparing the individual NATTG value of the user, as measured in a certain time point to a reference NATTG value measured in the same time, the user gets a feedback for the given time, regarding how far he is from a balance point for the time passed from setting the baseline value. In yet another embodiment of the invention the reference is set as the
NATTG profile of the user in a former day, in yet another embodiment as an average value of the user for past several days, at least 3 days, at least 10 days, at least 30 days or at least 365. In yet another embodiment of the invention the user is comparing the daily baseline value to a references baseline TTG value that was calculated as the average TTG value of a group of apparently healthy individuals that were balanced in the day before measurement regarding caloric intake and expenditure. In yet another embodiment the value is calculated based on the average baseline of the user in former day, in the former days for at least 3 days, at least 10 days, at least 30 days, or at least 365.
[0007] The measured baseline and NATTG values are used to direct the user how to manage his food consumption versus his physical activity in order to maintain or lose weight by maintaining or decreasing the amount of fat tissue in his body. The objective of the user is to achieve NATTG value that will not be higher than the reference value. If the NATTG is above reference value, the user has to increase his physical activity and/or decrease his fats and carbohydrates consumption. If the user wants to reduce weight he has to maintain NATTG values lower than the NATTG reference value for at least one day, or at least one week or at least one month. In yet another embodiment of the invention the objective of the user is to achieve baseline TTG value that will not be higher than the reference baseline TTG value. If the baseline TTG is above reference value in the following day, the user has to increase his physical activity and/or decrease his fats and carbohydrates consumption during the following day. If the user wants to maintain weight he has to maintain, each day, baseline TTG values that are similar to the reference baseline. If the user wants to reduce weight he has to maintain each day, a
lower baseline TTG then the reference baseline TTG. Figure 3 describes the flowchart of the method.
[0008] In one embodiment of this invention the estimation of TTG blood level can be done non-invasivcly by measurement of light scattering coefficient of the blood in a blood vessel near the skin. Increase in concentration and size TRL particles increases the blood light scattering coefficient. In yet another embodiment the measurement of the blood light scattering coefficient can be done by an implemented device located under the skin nee by a blood vessel.
[0009] The estimation of the blood light scattering coefficient can be done by illuminating continuous light at a point on the skin just above a blood vessel that is close to the skin surface, and measuring the intensity of the backscattered light at another point with the distance p from the light source, above the same blood vessel. The backscattered light detection point is located above the same blood vessel, in such a way the backscatter light passed mostly through the interior of the said blood vessel .
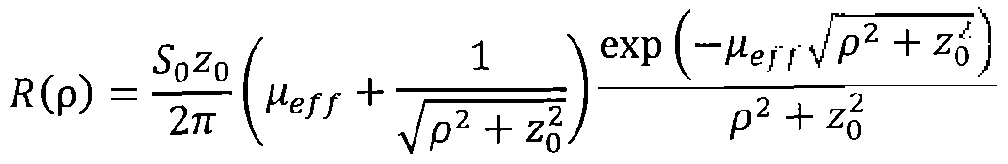
[00010] From the diffusion equation, the distribution of the backscattered light detected at distance p, ( R(p)) from the light source, is given by:

Where
1
z0 - / - Heff - \l 3μα (μ5' + μα) .
[00011] S0, ^s, μα are the intensity of the light source, the (reduced) scattering coefficient and the absorption coefficient of the blood, respectively. If S0, μα and p are fixed during repeated measurements, the changes in R (p) correlated to the charges in the light scattering coefficient of the blood. Increase in R(p) indicates decrease in the and vice versa. In one embodiment of the invention the measurement of the changes in the blood scattering coefficient in done by using one light source and one detector at distance of 3-30 mm, or 5- 15mm between them. See figure 4 A.
[00012] Using some algebra and approximation, the previous equation is reduced to
Ώ ( ηΛ _ so 3 ½ exp(^g p)
R (pj - ^ -? ·
[00013] Now, if we take two independent measures from two distinct distances from the light source Rip^, R (p2), we can estimate the scattering coefficient as described in (Kazuya Iinaga et al. 2013).:
3 , t 'n pffl(p2)
[00014] Therefore, in yet another embodiment of the invention, the estimation of blood scattering coefficient will be achieved by taking two measurement at once from two different detectors placed at different distances from one light source, See figure 4 B .
[00015] In yet another embodiment of the invention, the estimation will be achieved by taking two measurements using one detector and two light sources each placed at different distance from the detector. The measurements from each light source is
separated by time, e,g, the light sources are illuminating at different times, and the measurements recorded using the same light detector but in different times, see figure 4C.
[00016] In one embodiment of the invention the noninvasive measurement of TTG or TRL can done by a wearable device, which contains a light source that produces light at defined wave length of 700nm to 900nm (in the near infra-red band) with a directional light emission. The light source can be a light emitting diode (LED), a laser, or a laser diode. The light detector can be a photo diode. In yet another embodiment of the invention, the light emission is directed to the blood vessel, or to the skin. The wearable device is located on the body in such a way that the light source is located above a blood vessel near the skin. In yet another embodiment of the invention the blood vessel is a vain, in yet another embodiment the device is worn as a bracelet. The device includes a first light detector with a detection range of 700nm-900nm, located above the said blood vessel that the light source is located on, at a distance of 5- 15 mm from the light sources. In yet another embodiment the device includes as well a second light detector at a distance of 15-25 mm from the first light detector. In yet another embodiment the device includes two light sources and one detector and the measurements are separated by time. The light source and the light detectors are located in such a way that the light that is detected by the detectors passes mostly through the interior of the blood vessel (figure 4).
[00017] The device includes a control unit that includes memory device, an electric power source, a clock and a communication module that is used to transmit the processed data to a smart phone or computer. Alternatively the device can have a display unit to display the accumulated fat balance factor and the baseline TTG level (see Figure 4 D).
[00018] In another embodiment of the invention the device includes as well a 3 dimensional accelerometer to identify the time periods where the user does not move in order to allow starting a new measurement. See figure 4 D.
[00019] In yet another embodiment the device is an implantable device and is implanted in the body, in parallel to a blood vessel in such a way that the scattered light detected by the detector passes through the interior of the blood vessel.
[00020] In yet another embodiment of the invention the light scattering sensor includes another set light sources (500-600 nm wavelength) and light detector (500-600 nm wavelength) used the verify that the light sources and detectors (700-900 nm wavelength) are located exactly above the said blood vessel, in such a way that the light emitted from the light source passes through the blood vessel and scattered within it before it is detected by the detectors. This is done to make sure that the light source (700-900 nm wavelength) and the light detector (700-900 nm wavelength) or, the light source (700-900 nm wavelength) and the two detectors (700-900 nm wavelength), or the 2 light sources
(700-900 nm wavelength) and one detector (700-900 nm wavelength) are located exactly above the said blood vessel, in such a way that the light emitted from the light source
(700-900 nm wavelength) passes through the blood vessel and scattered within it before it is detected by the detectors (700-900 nm wavelength). See figure 4 E.
[00021] In another embodiment of the invention a second directional light source emitting light at 500-600 nm wavelength is located adjacent to the first light source at a distance of no more than 0.5mm or 1 mm from it, and a light detector unit that detects the scattered light at 500-600 nm wavelength is located adjacent to the first light detector unit of 700-900nm at a distance of no more than 0.5mm or ] mm from it. The second set of
light sources and detectors at 500-600nm is used to identify if a blood vessel is located just below the light source. The absorbance coefficient of blood at 500-600nm wave length range is extremely high, thus allowing only low amount of backscattering light to be detected, if the light source and the light detector are above a blood vessel having diameter of at least 0.5mm, or at least 1 mm, or at least 2 mm, or at least 5 mm. If the backscattering light (level at 500-600nm wave length range, detected by the detector is below certain trash hold, the trash hold was set by measurement the backscattering when the light source and detector were located directly above a blood vessel. In yet another embodiment the levels is compared to the backscattering light from an adjacent set of light source, that is not located above a blood vessel having diameter of at least 1 mm than it means that the first light source and detectors are located directly above the blood vessel. (Figures 4 E and 5).
[00022] In yet another embodiment the device is an implantable device and is implanted in parallel to a blood vessel in such a way that the scattered light that detected by the detector passed through the interior of the blood vessel.
1.00023] In yet another embodiment of the invention the blood light scattering sensor is an array of 2 or more sensors each sensor includes at least one light detector and one light source (See figure 5).
BRIEF DESCRIPTION OF THE DRAWINGS
[00024] Figure 1. Figure 1 A illustrates the sources and path of carbohydrate and TTG in the blood circulation system; Figure 1 B illustrates the factors that affect TTG blood levels.
[00025] Figure 2. Shows regular profile of TTG during 2 days, and the base line, and how the NATTG is calculated.
[00026] Figure 3. Presents block diagram describing the flow chart of the method for daily management of food consumption vs physical activity based on sequential measurements of TTG blood concentration.
[00027] Figure 4. Presents schematic blocks diagram of the device and sensor for non-invasive or implanted measurement of TTG concentrating in blood based on light scattering.
[00028] Figure 5. Presents schematic description of the different option for arrangement of the light sources and detectors in sensor for noninvasive measurement of blood light scattering.
[00029] Figure 6. Presents flow chart for overcoming movement artifacts in measurement blood light scattering coefficient.
DETAILED DESCRIPTION AND BEST MODE OF IMPLEMENTATION
[00030] Lipoproteins are complex aggregates of lipids and proteins that render the lipids compatible with the aqueous environment of body fluids and enable their transport throughout the body of all vertebrates via blood circulation system to tissues where they are required. The most abundant lipid constituents are iriacylglycerol (that are named triglycerides as well), free cholesterol, cholesterol esters and phospholipids. Lipoproteins particles are classified as chylomicrons (CM), very-low-density lipoproteins (VLDL), low-densi ty lipoproteins (LDL) and high-density lipoproteins (HDL), Compositional details are listed in Table 1 .
I I
Table 1. Physical properties and lipid compositions of lipoprotein classes.
CM VLDL LDL HDL
Density (g/ml) < 0.94 0.94-1.006 1 006-1.063 1.063-1.210
Diameter (A) 6000-2000 600 250 70-120
Total lipid (wt%) * 99 91 80 44
Triacylglycerols 85 55 10 6
Cholesterol esters 3 18 50 40
Cholesterol 2 7 1 1 7
Phospholipids 8 20 29 46
[00031] Lipoproteins particles are synthesized mainly in intestine and the liver and transported to the blood circulations system. Within the circulation, these aggregates are in a state of constant flux, changing in composition and physical structure as the peripheral tissues take up the various components before the remnants return to the liver, a reference is made to figure 2 A. The main macronutrient types in the human food are proteins, carbohydrate and fats. In the intestine, food is processed, and degraded to the basic building blocks: protein to amino acids, carbohydrate to mono saccharides (mainly glucose and fructose), and fats to fatty acids, all transported to the blood circulation. CM transport dietary lipids from the intestine to storage in the fat tissues throughout the body,
CM half life time in the circulation is about 1 hour. VLDL particles are assembled in the liver from endogenous lipids (mainly triglycerides) and transported via blood circulation
to the fat tissues. VLDL particles have a half life time of several hours. CM and VLDL metabolism and regulation is affected by the amount of carbohydrate consumed. High levels of carbohydrate Triglyceride levels vary quite a bit over short time periods. A meal containing high levels of sugar, fat, or alcohol can raise the triglyceride level drastically.
[00032] Light scattering coefficient is the fractional rate in the transmission of radiation through a scattering medium (as of light through fog) at which the flux density of radiation decreases by scattering in respect to the thickness of the medium traversed.
The scattering properties are mainly determined by the size of the scattering particles relative to the wavelength of light, and by the refractive index mismatch between the scattering particles and the surrounding medium. In biological tissues, the scattering centers are cells and cellular organelles. In the medical spectral window (700-900 nm), cellular organelles have dimensions comparable to the wavelength, and their index of refraction is relatively close to that of the cytosol and extracellular fluid. As a result, light scattering in tissue is mainly forward directed (i.e. the scattering angle□ is less than
90°) and shows a weak wavelength dependence. The scattering properties of tissues are described by two parameters; (1 ) the scattering coefficient ( s), defined as the inverse of the average photon path length between successive scattering events, and (2) the average cosine of the scattering angle (f 1 = <cosg>). From the definition of s, it follows that
I/I !s is the average distance traveled by a photon between successive scattering events.
Even though each scattering event is mainly forward directed, after a number of collisions a photon loses its original direction of propagation. Under these conditions, we can say that the photon has experienced an effectively isotropic scattering event.
Lipoprotein particles have a major effect on the blood light scattering coefficient. The higher the number of this particle and the larger their size is, light passing through the blood will be more scattered, and the blood scattering coefficient will be larger. The CM and VLDL are the largest type of lipoproteins particle and therefore have the largest effect on the blood scattering coefficient.
[00033] This invention provides a new method and device for providing a real time feedback to an individual regarding the balance between the amount and type of food consumed, and his physical activity intensity and duration, in order to reduce the access amount of fat stored in the body or to prevent accumulation of fat.
[00034] This invention provides a new method and device for providing a real time feedback to an individual regarding the balance between the amount and type of food consumed, and his physical activity intensity and duration, in order to reduce the access amount of fat stored in the body or to prevent accumulation of fat.
[00035] The new method is based on continues or sequential measurement or estimation of triglycerides (TG) concentration in blood or total triglycerides (TTG) concentration in blood or TG-rich lipoproteins (TRL) particles (e.g. chylomicrons (CM), very low density lipoproteins (VLDL)) concentration in blood. Blood TTG are known to be a surrogate for
TRL. Consumption of excess fat increases TRL and TTG blood levels, the increase start about 1 hour after fat consumption, and reach to a peak value after 2-3 hours (Richard B et al. 2003). Consumption of excess carbohydrate or alcohol increases TRL levels by increasing the liponeogenesis (Regina M McDevitt et al. 2001 , Kevin Jacheson et al.
1988). Liponeogenesis is the conversion of the carbohydrate excess, mainly by the liver, to TG, and its secretion as VLDL to the blood circulation system for transfer to long term
storage in fat tissue. Increase in physical activity causes faster clearance of TRL from the blood vessels and reduced VLDL production. Increase in physical activity causes a decrease in the fasting TTG level in the morning after the day where the activity was performed (Elena Bellou et al. 2013), sec figure 1 A and B. The TRL and TTG blood levels at any given time represent the bottom line of the excess fats and carbohydrate consumed, that are about to be cleared from the blood circulation and stored in the fat tissue. When there is a need for using the fat as energy, the triglycerides in the fat tissue are firstly degrade to a small fatty acid fragment that travel in the circulation, not as lipoprotein particles, and later oxidized in the cells. Therefore, continues monitoring of TTG or TRL levels in the blood can be used as biomarker for the balance between the amount carbohydrate and fats consumed and physical activity intensity and duration. This biomarker assists in preventing accumulation of fat in the body, or reducing the amount of fat stored in the fat tissues.
[00036] The measurement of TTG or TRL in this invention can be done at least once in
24 hours, or at least twice in 24 hours, or at least every 6 hours, or at least every 3 hours.
The results are recorded and analyzed as follows: The baseline level of the TTG or TRL is defined as TTG or TRL level that is measured in the early morning time before wake up, or before the first meal of the day during the morning time, for example, at between
2am to 6am. In another embodiment of the invention the first baseline measurement is done after the user was in fasting of at least 6 hours or at least 8 hours, or at least 10 hours before the baseline measurement, and this value can be further used as a reference baseline for comparison to the following baseline measurements. In each of the following days, a baseline level is measured and set at early morning time. The baseline
value is then subtracted from the following measurements of the day, and the net TTG values (TTG value after subtraction of the baseline) for the following measurement are accumulated, i.e. an integral is calculated of the area confined between the net TTG and the baseline level, see figure 2. This net accumulated TTG value (NATTG), is affected by the daily food consumption and activity balance and acts as a biomarker for food versus activity balance.
[00037] In yet another embodiment of the invention the NATTG is calculated over the baseline value that is zero. In yet another embodiment of the invention the NATTG is calculated based on a reference baseline values that was measured after fasting. A reference NATTG accumulation graph for every time of the day is set by calculation of the average NATTG values recorded in a group of apparently healthy individuals, during at least one full day, in which they were balanced regarding the caloric intake and caloric expenditure. A reference baseline value is set by calculation of the average baseline values recorded in a group of apparently healthy individuals, during at least one full day, in which they were balanced regarding the caloric intake and caloric expenditure. By comparing the individual NATTG value of the user, as measured in a certain time point to a reference NATTG value measured in the same time, the user gets a feedback for the given time, regarding how far he is from a balance point for the time passed from setting the baseline value. In yet another embodiment of the invention the reference is set as the
NATTG profile of the user in a former day, in yet another embodiment as an average value of the user for past several days, at least 3 days, at least 10 days, at least 30 days or at least 365. In yet another embodiment of the invention the user is comparing the daily baseline value to a references baseline TTG value that was calculated as the average TTG
value of a group of apparently healthy individuals that were balanced in the day before measurement regarding caloric intake and expenditure. In yet another embodiment the value is calculated based on the average baseline of the user in former day, in the former days for at least 3 days, at least 10 days, at least 30 days, or at least 365.
[00038] The measured baseline and NATTG values are used to direct the user how to manage his food consumption versus his physical activity in order to maintain or lose weight by maintaining or decreasing the amount of fat tissue in his body. The objective of the user is to achieve NATTG value that will not be higher than the reference value. If the NATTG is above reference value, the user has to increase his physical activity and/or decrease his fats and carbohydrates consumption. If the user wants to reduce weight he has to maintain NATTG values lower than the NATTG reference value for at least one day, or at least one week or at least one month. In yet another embodiment of the invention the objective of the user is to achieve baseline TTG value that will not be higher than the reference baseline TTG value. If the baseline TTG is above reference value in the following day, the user has to increase his physical activity and/or decrease his fats and carbohydrates consumption during the following day. If the user wants to maintain weight he has to maintain, each day, baseline TTG values that are similar to the reference baseline. If the user wants to reduce weight he has to maintain each day, a lower baseline TTG then the reference baseline TTG. Figure 3 describes the flowchart of the method.
[00039] In one embodiment of this invention the estimation of TTG blood level can be done non-invasively by measurement of light scattering coefficient of the blood in a blood vessel near the skin. Increase in concentration and size TRL particles increases the
blood light scattering coefficient. In yet another embodiment the measurement of the blood light scattering coefficient can be done by an implemented device located under the skin nee by a blood vessel.
[00040] The estimation of the blood light scattering coefficient can be done by illuminating continuous light at a point on the skin just above a blood vessel that is close to the skin surface, and measuring the intensity of the backscattered light at another point with the distance p from the light source, above the same blood vessel. The backscattered light detection point is located above the same blood vessel, in such a way the backscatter light passed mostly through the interior of the said blood vessel.
[00041] From the diffusion equation, the distribution of the backscattered light detected at distance p, ( R(p)) from the light source, is given by:
Where,
[00042] 5O</ < ½ A e the intensity of the light source, the (reduced) scattering coefficient and the absorption coefficient of the blood, respectively. If 50, α and p are fixed during repeated measurements, the changes in R (p) correlated to the charges in the light scattering coefficient of the blood. Increase in ff (p) indicates decrease in the and vice versa. In one embodiment of the invention the measurement of the changes in the
blood scattering coefficient in done by using one light source and one detector at distance of 3-30 mm, or 5- 15mm between them. See figure 4 A.
[00043] Using some algebra and approximation, the previous equation is reduced to
P 2π με// p2
[00044] Now, if we take two independent measures from two distinct distances from the light source R (p1), R (p2)-, we can estimate the scattering coefficient as described in (Kazuya linaga et al. 2013).:
S 3μα ^p2- i pj«(p2)
[00045] Therefore, in yet another embodiment of the invention, the estimation of blood scattering coefficient will be achieved by taking two measurement at once from two different detectors placed at different distances from one light source, see figure 4 B .
[00046] In yet another embodiment of the invention, the estimation will be achieved by taking two measurements using one detector and two light sources each placed at different distance from the detector. The measurements from each light source is separated by time, e,g, the light sources are illuminating at different times, and the measurements recorded using the same light detector but in driftnet times, see figure 4C.
[00047] In one embodiment of the invention the noninvasive measurement of TTG or
TRL can done by a wearable device, which contains a light source that produces light at defined wave length of 700nm to 900nm (in the near infra-red band) with a directional light emission. The light source can be a light emitting diode (LED), a laser, or a laser diode. The light detector can be a photo diode. In yet another embodiment of the
invention, the light emission is directed to the blood vessel, or to the skin. The wearable device is located on the body in such a way that the light source is located above a blood vessel near the skin. In yet another embodiment of the invention the blood vessel is a vain, in yet another embodiment the device is worn as a bracelet. The device includes a first light detector with a detection range of 700nm-900nm, located above the said blood vessel that the light source is located on, at a distance of 5-15 mm from the light sources. In yet another embodiment the device includes as well a second light detector at a distance of 15-25 mm from the first light detector. In yet another embodiment the device includes two light sources and one detector and the measurements are separated by time. The light source and the light detectors are located in such a way that the light that is detected by the detectors passes mostly through the interior of the blood vessel (figure 4).
[00048] The device includes a control unit that includes memory device, an electric power source, a clock and a communication module that is used to transmit the processed data to a smart phone or computer. Alternatively the device can have a display unit to display the accumulated fat balance factor and the baseline TTG level (see Figure 4 D).
[00049] In another embodiment of the invention the device includes as well a 3 dimensional accelerometer to identify the time periods where the user does not move in order to allow starting a new measurement, see figure 4 D.
[00050] In yet another embodiment the device is an implantable device and is implanted in the body, in parallel to a blood vessel in such a way that the scattered light detected by the detector passes through the interior of the blood vessel.
[00051] In yet another embodiment of the invention the light scattering sensor includes another set light sources (500-600 nm wavelength) and light detector (500-600 nm
wavelength) used the verify that the light sources and detectors (700-900 nm wavelength) are located exactly above the said blood vessel, in such a way that the light emitted from the light source passes through the blood vessel and scattered within it before it is detected by the detectors. This is done to make sure that the light source (700-900 nm wavelength) and the light detector (700-900 nm wavelength) or, the light source (700-900 nm wavelength) and the two detectors (700-900 nm wavelength), or the 2 light sources
(700-900 nm wavelength) and one detector (700-900 nm wavelength) are located exactly above the said blood vessel, in such a way that the light emitted from the light source
(700-900 nm wavelength) passes through the blood vessel and scattered within it before it is detected by the detectors (700-900 nm wavelength). See figure 4 E.
[00052] In another embodiment of the invention a second directional light source emitting light at 500-600 nm wavelength is located adjacent to the first light source at a distance of no more than 0.5mm or 1 mm from it, and a light detector unit that detects the scattered light at 500-600 nm wavelength is located adjacent to the first light detector unit of 700-900nm at a distance of no more than 0.5mm or 1 mm from it. The second set of light sources and detectors at 500-600nm is used to identify if a blood vessel is located just below the light source. The absorbance coefficient of blood at 500-600nm wave length range is extremely high, thus allowing only low amount of backscattering light to be detected, if the light source and the light detector are above a blood vessel having diameter of at least 0.5mm, or at least 1 mm, or at least 2 mm, or at least 5 mm. If the backscattering light (level at 500-600nm wave length range, detected by the detector is below certain trash hold, the trash hold was set by measurement the backscattering when the light source and detector were located directly above a blood vessel . In yet another
embodiment the levels is compared to the backscattering light from an adjacent set of light source, that is not located above a blood vessel having diameter of at least 1 mm than it means that the first light source and detectors are located directly above the blood vessel, (figures 4 E and 5).
[00053] The device also includes a control unit, an electric power source, a memory device, a clock and a communication module, used to transmit the processed data to a smart phone or computer. Alternatively the device can have a display unit to display the accumulated fat balance factor and the baseline TTG level (figure 4 - block diagram).
[00054] The control unit, e.g., a microprocessor, is responsible for real-time quantitative analysis of light scattering coefficient. Typically, the control unit drives light source to emit light in accordance with various emission parameters, such as duty cycle (e.g., number and/or timing of hours of operation per day) and amplitudes. In some applications of the present invention, light source is actuated by the control unit whenever a measurement take palace and the light intensity measured at the detector is sampled by the control unit to gain a quantitative measurement of the light intensity in the detector position.
[00055] The power source is coupled to the device to supply power for the control units, light sources and detectors and additional modules attached (like 3D accelerometer). The power source can be a battery, a rechargeable battery, or a power source that harvest kinetic, thermal or solar energy.
[00056] The display unit, e.g. LCD is used to display primary measures and display alerts and status of the user's caloric balance.
[00057] A communication module, e.g., Bluetooth or wired interface, is able to transmit measures, alerts and statuses to an external display module or a PC. Also it able to receive relevant data needed to calibrate the analysis process in the control unit.
[00058] In some embodiment of the invention the device includes a support on which the light source and detectors are mounted, in another embodiment the control unit and electrical source power, the memory unit, and communication units are also attached to the support.
[00059] Any measurement that involves electromagnetic radiation into living bodies by a wearable device is prone to movement artifact. The two main sources are: 1 , the relative movement of the device or sensor relatively to the body, and 2, changes in the tissue due to the body movement, e.g. pressure wave in the blood circulation system that affect volume and shape of blood vessels during the movement.
[00060] In yet another embodiment of the invention the device includes as well a 3 dimensional accelerometer to identify the time period where the user dose not moves his hand. If the acceleration values in all 3 axes shows very low variation, that can be quantified for example as the coefficient of variance (100* Standard deviation/Average) of the multiple reading within a certain time frame, that is below 10%, below 3% or below 1 % this is an indication the device and the body are not moving.
[00061] Figure 6 describe the flowchart for identifying time period where the subject is not moving and the sensor is located above a suitable blood vessel for reliable measurement of the changes in blood scattering coefficient.
(00062] In yet another embodiment the device is an implantable device and is implanted in parallel to a blood vessel in such a way that the scattered light that detected by the detector passed through the interior of the blood vessel.
[00063] In yet another embodiment of the invention the blood light scattering sensor is an array of 2 or more sensors each sensor includes at least one light detector and one light source (see figure 5).
References:
atsuyuki Nakajima, Takamitsu Nakano, Yoshiharu Tokita, Takeaki Nagamine, Akihiro Inazu, Junji Kobayashi, Hiroshi Mabuchi, Kimber Mitsuyo Okazaki, Masumi A, and Akira Tanaka. Postprandial lipoprotein metabolism; VLDL vs chylomicrons Clin Chim Acta. 201 1 July 15; 412(15- 16): 1306-1318.
Regina M McDcvitt, Sarah J Bott, Marilyn Harding, W Andrew Coward, Leslie J Bluck, and Andrew Prentice. De novo lipogenesis during controlled overfeeding with sucrose or glucose in lean and obese women. Am J Clin Nutr 2001 ;74:737-46.
Kevin Jacheson; Yves Schutz; Thiery Besard; Krishna Anantbaramanand Keith N. Frayn. Glycogen storage capacity and de novo lipogenesis during masive carbohydrate overfeding in man Jean-Piere Flail; and Eric J quier. Am J Clin Nutr 198;48:240-7.
Richard B. Heath, Fredrik Karpe, Ross W. Milne, Graham C. Burdge, Stephen A. Wootton. Selective partitioning of dietary fatty acids into the VLDL TG pool in the early postprandial period. Journal of Lipid Research Volume 44, 2003, pp 2065-2070.
Elena Bellou, Aikaterina Siopi, Maria Galani, Maria Maraki, Yiannis E. Tsekouras, Demosthenes B. Panagiotakos, Stavros A. avouras, Faidon Magkos, and Labros S. Sidossis. Acute effects of exercise and calorie restriction on triglyceride metabolism in women.Med Sci Sports Exerc. 2013 March ; 45(3): 455-461.
Kazuya linaga, Takeshi Namita, Member, IEEE, Toshihiro Sakurai, Hitoshi Chiba, and Koichi Shimizu, Attempt for Noninvasive Evaluation of in vivo Triglyceride in Blood* IEEE35th Annual International Conference of the IEEE EMBS Osaka, Japan, 3 - 7 July, 2013.
Claims
1. A method for monitoring the balance between the amount and type of food consumed versus the physical activity based on level changes of TRL in the blood.
2. A wearable device for noninvasive monitoring the changes in blood TRL concentration based on changes in blood light scattering coefficient.
Applications Claiming Priority (2)
| Application Number | Priority Date | Filing Date | Title |
|---|---|---|---|
| US201462051341P | 2014-09-17 | 2014-09-17 | |
| US62/051,341 | 2014-09-17 |
Publications (1)
| Publication Number | Publication Date |
|---|---|
| WO2016041073A1 true WO2016041073A1 (en) | 2016-03-24 |
Family
ID=55532385
Family Applications (1)
| Application Number | Title | Priority Date | Filing Date |
|---|---|---|---|
| PCT/CA2015/050897 WO2016041073A1 (en) | 2014-09-17 | 2015-09-16 | Device and method for monitoring fat balance |
Country Status (1)
| Country | Link |
|---|---|
| WO (1) | WO2016041073A1 (en) |
Cited By (6)
| Publication number | Priority date | Publication date | Assignee | Title |
|---|---|---|---|---|
| JP6029128B1 (en) * | 2016-05-18 | 2016-11-24 | メディカルフォトニクス株式会社 | Blood lipid concentration measuring device and operating method thereof |
| WO2018151150A1 (en) * | 2017-02-14 | 2018-08-23 | メディカルフォトニクス株式会社 | Device and method for measuring scattered body concentration |
| EP3492013A1 (en) * | 2017-12-01 | 2019-06-05 | Samsung Electronics Co., Ltd. | Apparatus and method for measuring bio-information |
| US10722125B2 (en) | 2016-10-31 | 2020-07-28 | Livemetric (Medical) S.A. | Blood pressure signal acquisition using a pressure sensor array |
| CN112040867A (en) * | 2018-04-26 | 2020-12-04 | 医疗光电设备有限公司 | Lipid concentration measuring apparatus and method therefor |
| US11000193B2 (en) | 2017-01-04 | 2021-05-11 | Livemetric (Medical) S.A. | Blood pressure measurement system using force resistive sensor array |
Citations (11)
| Publication number | Priority date | Publication date | Assignee | Title |
|---|---|---|---|---|
| WO2002005702A2 (en) * | 2000-07-18 | 2002-01-24 | Healthetech, Inc. | Closed loop glycemic index system |
| US6898451B2 (en) * | 2001-03-21 | 2005-05-24 | Minformed, L.L.C. | Non-invasive blood analyte measuring system and method utilizing optical absorption |
| WO2012093397A2 (en) * | 2011-01-09 | 2012-07-12 | Miki Raviv | Device and method for continuous energy expenditure measurement |
| US20140012118A1 (en) * | 2012-07-09 | 2014-01-09 | Dexcom, Inc. | Systems and methods for leveraging smartphone features in continuous glucose monitoring |
| US8647273B2 (en) * | 2007-06-21 | 2014-02-11 | RF Science & Technology, Inc. | Non-invasive weight and performance management |
| US20140142403A1 (en) * | 2012-06-22 | 2014-05-22 | Fitbit, Inc. | Biometric monitoring device with heart rate measurement activated by a single user-gesture |
| WO2014087825A1 (en) * | 2012-12-06 | 2014-06-12 | 国立大学法人北海道大学 | Non-invasive biolipid concentration meter, non-invasive biolipid metabolism measuring device, non-invasive method for measuring biolipid concentration, and non-invasive method for examining biolipid metabolism |
| US20140206955A1 (en) * | 2000-06-16 | 2014-07-24 | Bodymedia, Inc. | Wrist-worn body monitoring device |
| WO2014153200A1 (en) * | 2013-03-14 | 2014-09-25 | Echo Labs, Inc. | Systems and methods of multispectral blood measurement |
| US20140349256A1 (en) * | 2013-05-23 | 2014-11-27 | Robert A. Connor | Smart Watch and Human-to-Computer Interface for Monitoring Food Consumption |
| WO2015058286A1 (en) * | 2013-10-27 | 2015-04-30 | Blacktree Fitness Technologies Inc. | Portable devices and methods for measuring nutritional intake |
-
2015
- 2015-09-16 WO PCT/CA2015/050897 patent/WO2016041073A1/en active Application Filing
Patent Citations (11)
| Publication number | Priority date | Publication date | Assignee | Title |
|---|---|---|---|---|
| US20140206955A1 (en) * | 2000-06-16 | 2014-07-24 | Bodymedia, Inc. | Wrist-worn body monitoring device |
| WO2002005702A2 (en) * | 2000-07-18 | 2002-01-24 | Healthetech, Inc. | Closed loop glycemic index system |
| US6898451B2 (en) * | 2001-03-21 | 2005-05-24 | Minformed, L.L.C. | Non-invasive blood analyte measuring system and method utilizing optical absorption |
| US8647273B2 (en) * | 2007-06-21 | 2014-02-11 | RF Science & Technology, Inc. | Non-invasive weight and performance management |
| WO2012093397A2 (en) * | 2011-01-09 | 2012-07-12 | Miki Raviv | Device and method for continuous energy expenditure measurement |
| US20140142403A1 (en) * | 2012-06-22 | 2014-05-22 | Fitbit, Inc. | Biometric monitoring device with heart rate measurement activated by a single user-gesture |
| US20140012118A1 (en) * | 2012-07-09 | 2014-01-09 | Dexcom, Inc. | Systems and methods for leveraging smartphone features in continuous glucose monitoring |
| WO2014087825A1 (en) * | 2012-12-06 | 2014-06-12 | 国立大学法人北海道大学 | Non-invasive biolipid concentration meter, non-invasive biolipid metabolism measuring device, non-invasive method for measuring biolipid concentration, and non-invasive method for examining biolipid metabolism |
| WO2014153200A1 (en) * | 2013-03-14 | 2014-09-25 | Echo Labs, Inc. | Systems and methods of multispectral blood measurement |
| US20140349256A1 (en) * | 2013-05-23 | 2014-11-27 | Robert A. Connor | Smart Watch and Human-to-Computer Interface for Monitoring Food Consumption |
| WO2015058286A1 (en) * | 2013-10-27 | 2015-04-30 | Blacktree Fitness Technologies Inc. | Portable devices and methods for measuring nutritional intake |
Cited By (15)
| Publication number | Priority date | Publication date | Assignee | Title |
|---|---|---|---|---|
| JP6029128B1 (en) * | 2016-05-18 | 2016-11-24 | メディカルフォトニクス株式会社 | Blood lipid concentration measuring device and operating method thereof |
| CN109152558A (en) * | 2016-05-18 | 2019-01-04 | 医疗光电设备有限公司 | Lipid concentration measuring device and its operating method in blood |
| TWI722084B (en) * | 2016-05-18 | 2021-03-21 | 日商醫療光電股份有限公司 | Blood lipid concentration measuring device and its operation method |
| US10863934B2 (en) | 2016-05-18 | 2020-12-15 | Medical Photonics Co., Ltd. | Blood lipid concentration measurement device and method for operating same |
| US10722125B2 (en) | 2016-10-31 | 2020-07-28 | Livemetric (Medical) S.A. | Blood pressure signal acquisition using a pressure sensor array |
| US11000193B2 (en) | 2017-01-04 | 2021-05-11 | Livemetric (Medical) S.A. | Blood pressure measurement system using force resistive sensor array |
| JPWO2018151150A1 (en) * | 2017-02-14 | 2020-01-09 | メディカルフォトニクス株式会社 | Scatterer concentration measuring apparatus and method |
| WO2018151150A1 (en) * | 2017-02-14 | 2018-08-23 | メディカルフォトニクス株式会社 | Device and method for measuring scattered body concentration |
| CN109864744A (en) * | 2017-12-01 | 2019-06-11 | 三星电子株式会社 | The device and method for measuring biological information |
| KR20190065089A (en) * | 2017-12-01 | 2019-06-11 | 삼성전자주식회사 | Apparatus and method for measuring bio-information |
| EP3492013A1 (en) * | 2017-12-01 | 2019-06-05 | Samsung Electronics Co., Ltd. | Apparatus and method for measuring bio-information |
| US11331044B2 (en) | 2017-12-01 | 2022-05-17 | Samsung Electronics Co., Ltd. | Apparatus and method for measuring bio-information |
| CN109864744B (en) * | 2017-12-01 | 2022-07-01 | 三星电子株式会社 | Apparatus and method for measuring biological information |
| KR102522203B1 (en) | 2017-12-01 | 2023-04-14 | 삼성전자주식회사 | Apparatus and method for measuring bio-information |
| CN112040867A (en) * | 2018-04-26 | 2020-12-04 | 医疗光电设备有限公司 | Lipid concentration measuring apparatus and method therefor |
Similar Documents
| Publication | Publication Date | Title |
|---|---|---|
| WO2016041073A1 (en) | Device and method for monitoring fat balance | |
| Flanagan et al. | Calorie restriction and aging in humans | |
| Clark et al. | Plasma selenium and skin neoplasms: A case‐control study | |
| Wolever | Carbohydrate and the regulation of blood glucose and metabolism | |
| Lifshitz | Nutrition and growth | |
| Goris et al. | Energy balance in depleted ambulatory patients with chronic obstructive pulmonary disease: the effect of physical activity and oral nutritional supplementation | |
| Osmancevic et al. | Vitamin D production after UVB exposure–A comparison of exposed skin regions | |
| Haapala et al. | Associations of objectively measured physical activity and sedentary time with arterial stiffness in pre-pubertal children | |
| Saris et al. | PASSCLAIM–Physical performance and fitness | |
| King et al. | Inadequate dietary magnesium intake increases atherosclerotic plaque development in rabbits | |
| Osmancevic et al. | Effect of climate therapy at Gran Canaria on vitamin D production, blood glucose and lipids in patients with psoriasis | |
| Yun et al. | Smoking is associated with abdominal obesity, not overall obesity, in men with type 2 diabetes | |
| Fuse et al. | Brown adipose tissue density measured by near-infrared time-resolved spectroscopy in Japanese, across a wide age range | |
| Terada et al. | Test–retest reliability of a continuous glucose monitoring system in individuals with type 2 diabetes | |
| JP2014190914A (en) | Skin gas detection device | |
| Saeid et al. | Assessment of sodium and potassium intakes in children aged 6 to 18 years by 24 h urinary excretion in city of rabat, Morocco | |
| Yoshimura et al. | Relationship between intra-individual variability in nutrition-related lifestyle behaviors and blood glucose outcomes under free-living conditions in adults without type 2 diabetes | |
| Dye et al. | Correspondence of continuous interstitial glucose measurement against arterialised and capillary glucose following an oral glucose tolerance test in healthy volunteers | |
| Shukla et al. | Physiological variation of total-body potassium in man | |
| Fernández et al. | Fasting and refeeding cycles alter subcutaneous white depot growth dynamics and the morphology of brown adipose tissue in female rats | |
| Wang et al. | Mechanistic model of mass-specific basal metabolic rate: evaluation in healthy young adults | |
| Kumahara et al. | Inconspicuous assessment of diet-induced thermogenesis using whole-body indirect calorimetry | |
| Levitskaia et al. | Optical spectroscopy and multivariate analysis for biodosimetry and monitoring of radiation injury to the skin | |
| Thelin et al. | Type 2 diabetes among farmers and rural and urban referents: Cumulative incidence over 20 years and risk factors in a prospective cohort study | |
| Arslan et al. | Relationship between daily dietary fructose intake, body composition and biochemical parameters patients with type 2 diabetes |
Legal Events
| Date | Code | Title | Description |
|---|---|---|---|
| 121 | Ep: the epo has been informed by wipo that ep was designated in this application |
Ref document number: 15842740 Country of ref document: EP Kind code of ref document: A1 |
|
| NENP | Non-entry into the national phase |
Ref country code: DE |
|
| 122 | Ep: pct application non-entry in european phase |
Ref document number: 15842740 Country of ref document: EP Kind code of ref document: A1 |