WO2008140484A2 - Methods for diagnosing and monitoring the status of systemic lupus erythematosus - Google Patents
Methods for diagnosing and monitoring the status of systemic lupus erythematosus Download PDFInfo
- Publication number
- WO2008140484A2 WO2008140484A2 PCT/US2007/023675 US2007023675W WO2008140484A2 WO 2008140484 A2 WO2008140484 A2 WO 2008140484A2 US 2007023675 W US2007023675 W US 2007023675W WO 2008140484 A2 WO2008140484 A2 WO 2008140484A2
- Authority
- WO
- WIPO (PCT)
- Prior art keywords
- sle
- expression
- patient
- cluster
- genes
- Prior art date
Links
Classifications
-
- C—CHEMISTRY; METALLURGY
- C12—BIOCHEMISTRY; BEER; SPIRITS; WINE; VINEGAR; MICROBIOLOGY; ENZYMOLOGY; MUTATION OR GENETIC ENGINEERING
- C12Q—MEASURING OR TESTING PROCESSES INVOLVING ENZYMES, NUCLEIC ACIDS OR MICROORGANISMS; COMPOSITIONS OR TEST PAPERS THEREFOR; PROCESSES OF PREPARING SUCH COMPOSITIONS; CONDITION-RESPONSIVE CONTROL IN MICROBIOLOGICAL OR ENZYMOLOGICAL PROCESSES
- C12Q1/00—Measuring or testing processes involving enzymes, nucleic acids or microorganisms; Compositions therefor; Processes of preparing such compositions
- C12Q1/68—Measuring or testing processes involving enzymes, nucleic acids or microorganisms; Compositions therefor; Processes of preparing such compositions involving nucleic acids
- C12Q1/6809—Methods for determination or identification of nucleic acids involving differential detection
-
- C—CHEMISTRY; METALLURGY
- C12—BIOCHEMISTRY; BEER; SPIRITS; WINE; VINEGAR; MICROBIOLOGY; ENZYMOLOGY; MUTATION OR GENETIC ENGINEERING
- C12Q—MEASURING OR TESTING PROCESSES INVOLVING ENZYMES, NUCLEIC ACIDS OR MICROORGANISMS; COMPOSITIONS OR TEST PAPERS THEREFOR; PROCESSES OF PREPARING SUCH COMPOSITIONS; CONDITION-RESPONSIVE CONTROL IN MICROBIOLOGICAL OR ENZYMOLOGICAL PROCESSES
- C12Q1/00—Measuring or testing processes involving enzymes, nucleic acids or microorganisms; Compositions therefor; Processes of preparing such compositions
- C12Q1/68—Measuring or testing processes involving enzymes, nucleic acids or microorganisms; Compositions therefor; Processes of preparing such compositions involving nucleic acids
- C12Q1/6876—Nucleic acid products used in the analysis of nucleic acids, e.g. primers or probes
- C12Q1/6883—Nucleic acid products used in the analysis of nucleic acids, e.g. primers or probes for diseases caused by alterations of genetic material
-
- C—CHEMISTRY; METALLURGY
- C12—BIOCHEMISTRY; BEER; SPIRITS; WINE; VINEGAR; MICROBIOLOGY; ENZYMOLOGY; MUTATION OR GENETIC ENGINEERING
- C12Q—MEASURING OR TESTING PROCESSES INVOLVING ENZYMES, NUCLEIC ACIDS OR MICROORGANISMS; COMPOSITIONS OR TEST PAPERS THEREFOR; PROCESSES OF PREPARING SUCH COMPOSITIONS; CONDITION-RESPONSIVE CONTROL IN MICROBIOLOGICAL OR ENZYMOLOGICAL PROCESSES
- C12Q2600/00—Oligonucleotides characterized by their use
- C12Q2600/106—Pharmacogenomics, i.e. genetic variability in individual responses to drugs and drug metabolism
-
- C—CHEMISTRY; METALLURGY
- C12—BIOCHEMISTRY; BEER; SPIRITS; WINE; VINEGAR; MICROBIOLOGY; ENZYMOLOGY; MUTATION OR GENETIC ENGINEERING
- C12Q—MEASURING OR TESTING PROCESSES INVOLVING ENZYMES, NUCLEIC ACIDS OR MICROORGANISMS; COMPOSITIONS OR TEST PAPERS THEREFOR; PROCESSES OF PREPARING SUCH COMPOSITIONS; CONDITION-RESPONSIVE CONTROL IN MICROBIOLOGICAL OR ENZYMOLOGICAL PROCESSES
- C12Q2600/00—Oligonucleotides characterized by their use
- C12Q2600/112—Disease subtyping, staging or classification
Definitions
- the invention provides for the use of gene expression and statistical analysis to diagnose and monitor the status of systemic lupus erythematosus.
- SLE Systemic lupus erythematosus
- CNS central nervous system
- Symptoms include abnormal blood panels, arthralgias, atherosclerosis, CNS disorders, infections, joint pain, malaise, rashes, ulcers, and the production of autoantibodies. Since disease severity, symptomology, and response to therapy vary widely, SLE is difficult to diagnose, manage and treat.
- the invention presents methods and compositions for diagnosing and monitoring systemic lupus erythematosus (SLE).
- SLE systemic lupus erythematosus
- the methods use gene expression based on nucleic acid or protein technologies, and statistical methods to classify patients as having type 1 SLE or type 2 SLE and to monitor disease activity, predict flare, and assess the efficacy of treatment administered to the patient.
- the invention provides a method of diagnosing or monitoring the status of systemic lupus erythematosus (SLE) in a subject or patient includes detecting the expression of all genes of a diagnostic set in the subject or patient wherein the diagnostic set comprises two or more genes having expression correlated with the classification or status of SLE; and diagnosing or monitoring the status of SLE in the subject or patient by applying at least one statistical method to the expression of the genes of the diagnostic set.
- the statistical method is a prediction algorithm that produces a number or single value indicative of the status of SLE in the subject or patient.
- the statistical method further comprises classification of the subject or patient into one of at least two classes of SLE, and is optimized to maximize the separation among longitudinally stable classes of SLE.
- the method also provides a diagnostic set further comprising at least one gene selected from each of at least two gene clusters selected from cluster 1, cluster 2, cluster 3, cluster 4, cluster 5, cluster 6, cluster 7, cluster 8, cluster 9, cluster 10, cluster 1 1; cluster 12, cluster 13, cluster 14, and cluster 15 of Table 1.
- the invention further provides classification of the subject or patient into one of at least two classes of SLE further comprising detecting the expression of two or more gene whose expression correlates with the expression of the IFI27 from about 0.5 to about 1.0 and from about -0.5 to about -1.0 calculated using a Pearson correlation; and classifying a subject or patient as having type 1 or type 2 SLE based on the expression of the two or more genes.
- one of the two or more genes is selected from Table 2 and the classifying step uses a linear algorithm to produce an interferon response (INFr) score wherein a high IFNr score is correlated with type I SLE and a low IFNr score is correlated with type II SLE.
- the invention additionally provides at least one linear algorithm producing an IFNr score comprising IFI27 + IFI144*(1.1296) + OAS3*(1.8136).
- the invention still further provides a Pearson correlation that is selected from a range of 0.5, 0.4, 0.3, and 0.2 of the expressed genes.
- the invention provides a method of diagnosing or monitoring the status of systemic lupus erythematosus (SLE) in a subject or patient comprising detecting the expression of all genes of a diagnostic set in a subject or patient wherein the diagnostic set includes at least one gene from each of at least two gene clusters selected from cluster 1, cluster 2, cluster 3, cluster 4, cluster 5, cluster 6, cluster 7, cluster 8, cluster 9, cluster 10, cluster 11 ; cluster 12, cluster 13, cluster 14, and cluster 15 of Table 1 ; and diagnosing or monitoring the status of SLE in the subject or patient based on expression of the genes in the diagnostic set.
- SLE systemic lupus erythematosus
- the expression of all genes in the diagnostic set is detected using a nucleic acid technology further including hybridization in solution or on a substrate or amplification in a quantitative realtime polymerase chain reaction.
- expression of all genes is proportional to the amount of RNA isolated from a subject or patient sample further including a body fluid selected from whole blood or a blood fraction, ascites, cerebrospinal fluid, lymph, sputum, and urine or a tissue selected from central nervous system, joints, kidneys, liver, lungs, oral cavity, sinuses, skin, and vasculature obtained by any sampling means selected from aspiration of a body fluid, a biopsy of a tissue or an organ, drawing of peripheral blood, endoscopy, and lavage followed by aspiration.
- the invention provides for the use of at least one primer or probe set to detect the expression of each of the genes in the diagnostic set.
- the primers or probe sets are oligonucleotides selected from natural or synthetic cDNA, genomic DNA, locked nucleic acids, peptide nucleic acids, and RNA and can be used in a diagnostic kit.
- the invention also provides a method of diagnosing a patient as having a longitudinally stable classification of SLE by detecting the expression of two or more genes whose expression correlates with the expression of the IFI27 from about 0.5 to about 1.0 and from about -0.5 to about -1.0 calculated using Pearson correlation; and diagnosing the patient as having type I or type II SLE based on analyzing the expression of the two or more genes using a statistical method.
- the invention further provides for assigning a subject or patient to a clinical trial based on their classification as type 1 SLE or type 2 SLE.
- the invention provides for monitoring the status of SLE in a subject or patient by predicting incipient flare or disease activity, and assessing response to a therapeutic agent administered to the patient or to an immunosuppressant administered to a patient.
- the invention also provides for screening a subject exhibiting symptoms of a rheumatic disease selected from ankylosing spondylitis, dermatomyositis, autoimmune hepatitis, hepatitis-C (hep-C), polymyalgia rheumatica, polymyositis, rheumatoid arthritis (RA), scleroderma, systemic sclerosis, Sjogren's disease, systemic vasculitis, and Whipple's disease.
- a rheumatic disease selected from ankylosing spondylitis, dermatomyositis, autoimmune hepatitis, hepatitis-C (hep-C), polymyalgia rheumatica, polymyo
- the invention provides method of producing a probe set for diagnosing or monitoring SLE in a subject or patient by selecting at least one gene from each of at least two of the gene clusters of Table 1 and at least two genes from Table 2; and producing a probe set consisting of at least one oligonucleotide that detects the expression of each of the selected genes.
- the probe set is used in a diagnostic kit.
- the invention provides a method for predicting flare in a patient diagnosed with SLE by analyzing gene expression in a sample from the patient to produce a gene expression profile wherein a first portion of the analysis includes using expression of at least one gene selected from each of at least two of the clusters 1 through 15 of Table 1 and at least one statistical method to produce a patient expression profile, and a second portion of the analysis includes using expression of at least two genes selected from Table 2 and a linear algorithm to classify the patient as having type 1 SLE or type 2 SLE; and predicting flare by comparing the patient gene expression profile at least one reference profile.
- the reference profile is selected from at least one normal subject, at least one patient classified as having type 1 SLE with quiescent status, at least one patient classified as having type 1 SLE in flare, at least one patient classified as having type 2 SLE with quiescent status, at least one patient classified as having type 2 SLE in flare.
- Figure 1 shows the Logio expression ration for Interferon Responsive Gene IFI27 in QF and F paired samples.
- Figure 2 shows the Interferon Response (INFr) score for normal controls and SLE patient.
- Figure 3 shows the bimodal distribution for IFI27, IFI44, and OAS3 of SLE patients.
- Table 1 shows 15 clusters of correlated genes that are differentially expressed as SLE patients change status from quiescence to flare and can be used with at least one statistical method to predict flare.
- Cell types corresponding to each cluster are indicated as well as Array ID, Genbank ID, Gene ID, and the source of each gene.
- 60-mer sequences, which are unique identifiers for the genes, are also displayed in Table 1. The Sequence Listing provides the 60-mer sequences listed in Table 1.
- Table 2 lists INFr genes with expression that positively correlates with IFI27 expression and can be used with at least one statistical method to classify a patient as having either type 1 SLE or type 2 SLE. 60-mer sequences, which are unique identifiers for the genes, are also displayed in Table 2.
- Table 3 presents longitudinal data for SLE patients showing stability in an individual's INFr score and its lack of correlation with SLEDAI.
- Amplification refers to any device, method or technique that can make copies of a nucleic acid. It can be achieved using polymerase chain reaction (PCR) techniques such as linear amplification (cf. USPN 6,132,997), rolling circle amplification, and the like. Further, amplification and detection can be combined as in TAQMAN Real-Time PCR (RT-PCR) using the TAQMAN protocols and the Prism 7900HT Sequence detection system and software (Applied Biosystems (ABI), Foster City CA).
- PCR polymerase chain reaction
- RT-PCR Real-Time PCR
- Array refers to an ordered arrangement of at least two reagents— antibodies, nucleic acids or proteins—in solution or on a substrate where at least one of the reagents represents a normal control and the other, a sample of diagnostic or prognostic interest.
- the ordered arrangement insures that the size and signal intensity of each labeled complex, formed between at least one reagent and at least one nucleic acid or protein to which the reagent specifically binds, is individually distinguishable.
- diagnostic set generally refers to a set of two or more genes that, when evaluated for differential expression of their products, collectively yields predictive data. Such predictive data typically relates to diagnosis, prognosis, monitoring of therapeutic outcomes, and the like.
- the components of a diagnostic set are distinguished from nucleotide sequences that are evaluated by analysis of the DNA to directly determine the genotype of an individual as it correlates with a specified trait or phenotype, such as a disease, in that it is the pattern of expression of the components of the diagnostic set, rather than mutation or polymorphism of the DNA sequence that provides predictive value.
- a particular component (or member) of a diagnostic set can, in some cases, also present one or more mutations, or polymorphisms that are amenable to direct genotyping by any of a variety of well known analysis methods, e.g., Southern blotting, RFLP, AFLP, SSCP, SNP, and the like.
- cDNA refers to an isolated polynucleotide, nucleic acid molecule, or any fragment or complement thereof that originated recombinantly or synthetically, is double- or single- stranded, represents coding and noncoding 3' or 5' sequence, and generally lacks introns.
- Classification refers to the categorization of a subject or patient based on gene expression as having type 1 SLE or type 2 SLE. SLE is considered to be type 1 if it primarily involves Type 1 T helper cells and type 1 -linked cytokines, such as interferon-gamma. SLE is considered to be type 2 if there is more involvement of Type 2 helper cells which activate an antibody-driven immune response.
- “Expression” refers differential gene expression— an increased (i.e., upregulated) or a decreased (i.e., downregulated) expression as detected by absence, presence, or change in the amount of messenger RNA or protein for a gene in a sample.
- Flare refers to onset of disease activity in a patient diagnosed with an immune disorder; in SLE, mild flare has been defined by an increase in systemic lupus erythematosus disease activity index (SLEDAI) by > four units over a previous score for that patient and severe flare, as an increase in SLEDAI by > 12 units.
- SLEDAI represents a composite assessment of disease activity based on 16 clinical manifestations and eight laboratory measures including two immunological tests with a possible range of overall score from 0 to 105.
- a "gene expression profile” refers to the identification, characterization, quantification, and representation of a plurality of genes expressed in a sample as measured using nucleic acid or protein technologies.
- a nucleic acid expression profile is produced using mature mRNA transcript and/or regulatory sequences such as promoters, enhancers, introns, mRNA-processing intermediates, and 3' untranslated regions in nucleic acid technologies.
- a protein expression profile although time delayed, mirrors the nucleic acid expression profile and is produced using protein technologies and proteins and/or antibodies to detect protein expression in a sample. Results from subject or patient samples are compared with reference profiles based on normal, diseased, or treated samples.
- Immunosuppressant refers to any therapeutic agent that suppresses immune response in a patient such as anticoagulents, antimalarials, heart drugs, non-steroidal antiinflammatory drugs (NSAIDs), and steroids including but not limited to aspirin, azathioprine, chloroquine, corticosteroids, cyclophosphamide, cyclosporin A, dehydroepiandrosterone, deoxyspergualin, dexamethasone, everolimus, fenoprofen, hydralazine, hydroxychloroquine, immunoglobulin, ibuprofen, indomethacin, leflunomide, ketoprofen, meclophenamate, mepacrine, 6-mercaptopurine, methotrexate, mizoribine, mycophenolate mofetil, naproxen, prednisone, methyprenisone, rapamycin (sirolimus), solumedrol, tacroli
- NSAIDs non
- “Longitudinally stable” refers to the behavior of one or more interferon response (INFr) genes expressed in samples collected at different time points from an individual or data derived from those samples.
- Diagnosis or monitoring refers to the detection of gene expression at the nucleic acid or protein level to provide useful information about an individual's medical status. Monitoring status can include determination of prognosis or complication, following progression of a disease, prediction of disease activity or flare, providing information relating to a patient's health over a period of time, selection of a therapeutic agent and/or determining response or resistance to that agent, selecting an individual patient or small subsets of patients most likely to benefit from an experimental therapy or clinical trial, and determining classification of a patient as having a particular disease status.
- Normal refers to the medical status of an individual, or a sample from an individual, who does not have SLE or any diagnosis or manifestation of an infection or immune disorder and can be used as a negative control.
- Nucleic acid technology refers to any device, means or system used to detect gene expression or produce a gene expression profile and includes but is not limited to methods using arrays for amplification in PCR, TAQMAN RT-PCR, quantitative RT-PCR, and the like, or hybridization in solution or on a substrate containing cDNAs, genomic DNAs, locked nucleic acids, oligonucleotide primers or probes, peptide nucleic acids, polynucleotides, and RNAs of any length either natural or synthetic, and the like.
- Patient refers to a human subject who is genetically predisposed to a rheumatic disease or has been diagnosed with a SLE.
- Prediction refers to the use of gene expression assessed using nucleic acid or protein technologies, algorithms and statistical analyses to provide information about an individual's status; for example, being predisposed to, diagnosed with, or effectively treated for disease activity or flare.
- Protein technology includes but is not limited to activity assays, affinity antibody or protein arrays, chromatographic separation, colorimetric assays, two-dimensional gel electrophoresis, enzyme-linked immunosorbent assays (ELISA), fluorescent-activated cell sorting (FACS), mass spectrophotometric detection, western analysis, and the like.
- a “reference profile” refers to gene expression or gene expression profiles from well-characterized normal, diseased or treated samples taken from at least one subject and giving repeatable results whenever used in or with a particular nucleic acid or protein technology.
- a "rheumatic disease” is a condition or disorder selected from ankylosing spondylitis, dermatomyositis, autoimmune hepatitis, hepatitis-C (hep-C), polymyalgia rheumatica, polymyositis, rheumatoid arthritis (RA), scleroderma, systemic sclerosis, Sjogren's disease, systemic vasculitis, Whipple's disease and the like.
- sample is used in its broadest sense and refers to any biological material used to obtain histological information or to measure gene expression obtained by any means from a subject.
- a sample can be a body fluid such as ascites, bile, blood, cerebrospinal fluid, synovial fluid, lymph, pus, semen, sputum, urine; the soluble fraction of a cell preparation, an aliquot of media in which cells were grown; a chromosome, an organelle, or membrane isolated or extracted from a cell; cDNA, genomic DNA, or RNA in solution or bound to a substrate; a cell; a tissue biopsy, and the like.
- Preferred samples for diagnosis, prognosis, or monitoring of SLE patients are leukocytes or serum derived from whole blood, biopsies of the central nervous system (CNS), joints, kidneys, liver, lungs, oral cavity, sinuses, skin, vasculature, and any other tissues or organs affected by SLE.
- CNS central nervous system
- sampling means refers to aspiration, biopsy, endoscopy, lavage, needle aspiration or biopsy, puncturing with a lancet; bleeding, ejaculating, expectorating, seeping, or urinating into or onto a collection device, container, substrate, and the like.
- Status refers to the deterioration, improvement, progression, remission, or stability of a patient with SLE, as determined from analyzing one or more samples from that patient. Status, or a change therein, can be used to evaluate the need for administration of a therapeutic agent, to adjust dosage of such an agent, to change or use another agent or treatment regime, and the like.
- Statistical methods include but are not limited to analysis of variance, classification algorithms, classification and regression trees, Fisher's Exact Test, linear algorithm, linear discriminatory analysis, linear regression, logistic algorithm, multiple regression, nearest shrunken centroids classifier, Pearson correlation, prediction algorithm, significance analysis of microarrays, one-tailed T-tests, two-tailed T-tests, voting algorithm, Wilcoxon's signed ranks test, and the like.
- Substrate refers to any rigid or semi-rigid support to which antibodies, nucleic acids or proteins are bound and includes magnetic or nonmagnetic beads, capillaries or other tubing, chips, fibers, filters, gels, membranes, microparticles, plates, polymers, slides, and wafers with a variety of surface forms including channels, columns, pins, pores, trenches, wells and the like.
- Therapeutic agent refers to any pharmaceutical molecule or compound that will bind specifically to a polynucleotide or to an epitope of a protein and stabilize or modulate the activity of the polynucleotide or protein. It can be composed of inorganic and/or organic substances including minerals, cofactors, nucleic acids, proteins, carbohydrates, fats, and lipids and includes but is not limited to Ace inhibitors, aspirin, azathioprine, B7RP-l-fc, ⁇ - blockers, brequinar sodium, campath-lH, celecoxib, chloroquine, corticosteroids, Coumadin, cyclophosphamide, cyclosporin A, dehydroepiandrosterone, deoxyspergualin, dexamethasone, diclofenac, dolobid, etodolac, everolimus, FK778, feldene, fenoprofen, flurbiprof
- the invention provides methods of diagnosing or monitoring the status of SLE in a subject or patient by detecting the expression of all genes of a diagnostic set in the subject or patient wherein the diagnostic set has two or more genes having expression correlated with the classification or status of SLE; and diagnosing or monitoring the status of SLE in the subject or patient by applying at least one statistical method to the expression of the genes of the diagnostic set.
- the methods of the invention also include classifying the subject or patient as having type 1 SLE or type 2 SLE, predicting flare, and monitoring disease activity and treatment efficacy.
- the invention provides diagnostic sets containing genes that can be used to diagnosis and monitor SLE disease status.
- the diagnostic sets can also be used to predict occurrence and future complication of the disease.
- Diagnostic genes were identified and validated for use in diagnosing and monitoring of SLE status by identifying genes for which a correlation exists between the SLE status of an individual as determined based on various disease criteria and the individual's expression of RNA or protein products corresponding to the gene.
- Disease criteria may include clinical data such as symptom rash, joint pain, malaise, rashes, blood counts (white and red), tests of renal function (e.g.
- ultrasound diagnosis or any other manifestations of the disease data from surgical procedures such as gross operative findings and pathological evaluation of resected tissues and biopsies (e.g., renal, CNS), information on pharmacological therapy and treatment changes, clinical diagnoses of disease "flare", hospitalizations, death, response to medications, quantitative joint exams, results from health assessment questionnaires (HAQs), and other clinical measures of patient symptoms and disability.
- Disease criteria also include the clinical score known as SLEDAI (Bombadier C, Gladman D D, Urowitz M B, Caron D, Chang C H and the Committee on Prognosis Studies in SLE: Derivation of the SLEDAI for Lupus Patients. Arthritis Rheum 35:630-640, 1992.).
- the diagnostic genes of this invention include sequences corresponding those provided by the accession numbers and Unigene numbers provided in Table 1 and 2.
- the 60- mer sequences provided in the Tables are unique identifiers for the diagnostic genes of this invention. Therefore, the diagnostic genes of this invention also include sequences containing the 60-mer sequence provided in the Tables. In other words, the diagnostic genes may be partially or totally contained in (or derived from) the full-length gene sequences referenced in Tables 1 and 2.
- the diagnostic genes of this invention include any sequences whose expression correlates with the expression of all genes which correlate with IFI27, such as the sequences provided by the accession numbers and Unigene numbers provided in Table 2.
- Homologs and variants of the nucleic acid molecules in Table 1 and Table 2 may also be part of the diagnostic gene set. Homologs and variants of these nucleic acid molecules will possess a relatively high degree of sequence identity when aligned using standard methods.
- the sequences encompassed by the invention have at least 40-50, 50-60, 70-80, 80- 85, 85-90, 90-95, or 95-100% sequence identity to the sequences disclosed herein.
- the diagnostic gene set may also include other genes that are coexpressed with the correlated sequence or full-length gene. Genes may share expression patterns because they are regulated in the same molecular pathway or in the same cell type. Because of the similarity of expression behavior, these genes are identified as surrogates in that they can substitute for a diagnostic gene in a diagnostic gene set.
- diagnostic genes of the invention are used as a diagnostic gene set in combination with genes that are known to be associated with a disease state ("known markers").
- known markers genes that are known to be associated with a disease state
- the use of the diagnostic genes in combination with the known markers can provide information that is not obtainable through the known markers alone.
- the diagnostic genes of this invention are segregrated into "clusters". In preferred embodiments the diagnostic genes of this invention are sorted into clusters as indicated in Table 1 and diagnostic gene sets of this invention include at least one gene from each of at least two of gene clusters 1 through 15.
- a cluster of genes refers to a group of genes related by expression pattern.
- a cluster of genes is a group of genes with similar regulation across different conditions, such as a patient having SLE or a patient without SLE.
- the expression profile for each gene in a cluster should be correlated with the expression profile of at least one other gene in that cluster. Correlation may be evaluated using a variety of statistical methods.
- surrogate refers to a gene with an expression profile such that is so highly correlated with gene expression of another gene that it can substitute for a diagnostic gene in a diagnostic assay.
- genes are typically members of the same gene cluster as the diagnostic gene.
- a set of potential surrogates can be identified through identification of genes with similar expression patterns as described below.
- Patterns may be considered correlated if the correlation coefficient is greater than or equal to 0.8. In preferred embodiments, the correlation coefficient should be greater than 0.85, 0.9 or 0.95. Other statistical methods produce a measure of mutual information to describe the relatedness between two gene expression patterns. Patterns may be considered correlated if the normalized mutual information value is greater than or equal to 0.7. In preferred embodiments, the normalized mutual information value should be greater than 0.8, 0.9 or 0.95. Patterns may also be considered similar if they cluster closely upon hierarchical clustering of gene expression data (Eisen et al. 1998).
- Similar patterns may be those genes that are among the 1 , 2, 5, 10, 20, 50 or 100 nearest neighbors in a hierarchical clustering or have a similarity score (Eisen et al. 1998) of >0.5, 0.7, 0.8, 0.9, 0.95 or 0.99. Similar patterns may also be identified as those genes found to be surrogates in a classification tree by CART (Breiman et al. 1994). [0058] Often, but not always, members of a gene cluster have similar biological functions in addition to similar gene expression patterns. For example, all genes in a particular cluster may be associated with a particular biological pathway or cell type. Representative cell types associated with diagnostic genes of this invention include granulocytes, NK cells, red blood cells, and platelets.
- Is is expected that the expression pattern of other genes in the same pathway or cell type will also be part of the same cluster and may be useful as surrogates.
- Correlated genes, clusters and surrogates are all useful as diagnostic genes of the invention. These surrogates may be used as diagnostic genes in an assay instead of, or in addition to, the diagnostic genes for which they are surrogates.
- Clusters also provide a means to ensure that the diagnostic gene sets do not contain redundant information. Diagnostic gene sets of the invention therefore preferably include genes from different clusters. For example, diagnostic gene sets of the invention preferably include at least one gene from at least two gene clusters.
- the invention further provides methods for producing diagnostic primer sets or probe sets.
- a probe includes any reagent capable of specifically identifying genes in diagnostic setss, and include but are not limited to DNA, RNA, cDNA, splice variants, primers, probe sets, peptide nucleic acids, locked nucleic acids, amplicons, synthetic oligonucleotide, and partial or full-length nucleic acid sequences.
- the probe may identify the protein product of a diagnostic gene, and include, for example, antibodies and other affinity reagents.
- a probe set may include one or more oligonucleotide that detects the expression of one or more of the selected genes for the diagnostic set.
- a diagnostic probe set is immobilized on an array.
- the array may be a chip array, a plate array, a bead array, a pin array, a membrane array, a solid surface array, a liquid array, an oligonucleotide array, a polynucleotide array or a cDNA array, a microtiter plate, a pin array, a bead array, a membrane or a chip.
- Gene expression can be evaluated at the level of DNA, or RNA or protein products.
- a variety of techniques are available for the isolation of DNA, RNA and protein from bodily fluids.
- RNA can be isolated from ascites, bile, blood, cerebronspinal fluid, lymph, sputum, and/or urine.
- RNA can also be isolated from the central nervous system, joints, kidneys, liver, lungs, oral cavity, sinuses, skin, and vasculature.
- expression patterns can be evaluated by northern analysis, PCR, RT- PCR, Taq Man analysis, FRET detection, monitoring one or more molecular beacons, hybridization to an oligonucleotide array, hybridization to a cDNA array, hybridization to a polynucleotide array, hybridization to a liquid microarray, hybridization to a microelectric array, cDNA sequencing, clone hybridization, cDNA fragment fingerprinting, serial analysis of gene expression (SAGE), subtractive hybridization, differential display and/or differential screening (see, e.g., Lockhart and Winzeler (2000) Nature 405:827-836, and references cited therein).
- SAGE serial analysis of gene expression
- Oligonucleotide hybridization may occur in solution or on substrates including, but not limited to magnetic or nonmagnetic beads, chips, fibers, filters, gels, membranes, microparticles, plates, polymers, slides, capillary tubing, and wafers with surface features selected from channels, columns, pins, pores, trenches, and wells.
- substrates including, but not limited to magnetic or nonmagnetic beads, chips, fibers, filters, gels, membranes, microparticles, plates, polymers, slides, capillary tubing, and wafers with surface features selected from channels, columns, pins, pores, trenches, and wells.
- protein expression in a disease patient can be evaluated by one or more methods including, but not limited to Western analysis, two-dimensional gel analysis, chromatographic separation, mass spectrometric detection, protein-fusion reporter constructs, colorimetric assays, binding to a protein array and characterization of polysomal mRNA.
- One particularly favored approach involves binding of labeled protein expression products to an array of antibodies specific for members of the candidate library. Methods for producing and evaluating antibodies are widespread in the art, see, e.g., Coligan, supra; and Harlow and Lane (1989) Antibodies: A Laboratory Manual, Cold Spring Harbor Press, NY (“Harlow and Lane”).
- affinity reagents e.g., antibodies, small molecules, etc.
- affinity reagents are developed that recognize epitopes of the protein product.
- Affinity assays are used in protein array assays, e.g. to detect the presence or absence of particular proteins.
- affinity reagents are used to detect expression using the methods described above.
- labeled affinity reagents are bound to populations of leukocytes, and leukocytes expressing the protein are identified and counted using fluorescent activated cell sorting (FACS).
- FACS fluorescent activated cell sorting
- Expression patterns, or profiles, of a plurality of genes corresponding to members of the diagnostic set are evaluated in one or more SLE patients. These expression patterns constitute a set of relative or absolute expression values for some number of RNA or protein products corresponding to the plurality of genes evaluated, which is referred to herein as the subject's "expression profile" for those genes. While expression patterns for as few as one independent member of the diagnostic set can be obtained, it is generally preferable to obtain expression patterns corresponding to a larger number of genes, e.g., about 2, about 5, about 10, about 20, about 50, about 100, about 200, about 500, or about 1000, or more.
- the expression pattern for each differentially expressed component member of the set provides a finite specificity and sensitivity with respect to predictive value, e.g., for diagnosis, prognosis, monitoring, and the like. Evaluation of Expression Data and Pro ⁇ Ies
- Expression profiles can be evaluated by qualitative and/or quantitative measures. Certain techniques for evaluating gene expression (as RNA or protein products) yield data that are predominantly qualitative in nature. That is, the methods detect differences in expression that classify expression into distinct modes without providing significant information regarding quantitative aspects of expression. For example, a technique can be described as a qualitative technique if it detects the presence or absence of expression of a diagnostic nucleotide sequence, i.e., an on/off pattern of expression. Alternatively, a qualitative technique measures the presence (and/or absence) of different alleles, or variants, of a gene product.
- some methods provide data that characterizes expression in a quantitative manner. That is, the methods relate expression on a numerical scale. It will be understood that the numerical, and symbolic examples provided are arbitrary, and that any graduated scale (or any symbolic representation of a graduated scale) can be employed in the context of the present invention to describe quantitative differences in nucleotide sequence expression. Typically, such methods yield information corresponding to a relative increase or decrease in expression.
- any method that yields either quantitative or qualitative expression data is suitable for evaluating expression of diagnostic nucleotide sequence in a SLE subject or patient.
- the recovered data e.g., the expression profile for the nucleotide sequences is a combination of quantitative and qualitative data.
- expression of the plurality of diagnostic nucleotide sequences is evaluated sequentially. This is typically the case for methods that can be characterized as low- to moderate-throughput.
- a diagnostic classifier (a mathematical function that assigns samples to diagnostic categories based on expression data) is applied to unknown sample expression levels in order to diagnose or monitor the status of the SLE in a subject or patient.
- the diagnostic classifier is typically derived from a prediction algorithm derived from statistical methods including, but not limited to, analysis of variance, classification algorithms, classification and regression trees, Fisher's Exact Test, linear algorithm, linear discriminatory analysis, linear regression, logistic algorithm, multiple regression, nearest shrunken centroids classifier, Pearson correlation, prediction algorithm, significance analysis of microarrays, one-tailed T-test, two tailed T-tests, voting algorithm, Wilcoxon's signed ranks test and the like.
- comparison of patient gene expression with reference profiles is used to evaluate expression data and to monitor the status of SLE, to predict flare, and to assess treatment efficacy.
- expression profiles derived from a patient are compared to a control or standard expression RNA to facilitate comparison of expression profiles (e.g. of a set of candidate nucleotide sequences) from a group of patients relative to each other (i.e., from one patient in the group to other patients in the group, or to patients in another group).
- the reference RNA used should have desirable features of low cost and simplicity of production on a large scale. Additionally, the reference RNA should contain measurable amounts of as many of the genes of the candidate library as possible.
- Standard expression reference can be derived from samples from at least one normal subject and from at least one patient diagnosed with SLE and include but are not limited to a gene expression from one or more patients with quiescent type 1 SLE, from one or more patients with quiescent type 2 SLE, from one or more patients with type 1 SLE showing increased disease activity or flare, from one or more patients with type 2 SLE showing increased disease activity or flare, from one or more patients with type 1 SLE that had been treated with an immunosuppressant, from one or more patients with type 2 SLE that had been treated with an immunosuppressant, from one or more patients with type 1 SLE that had been treated with a therapeutic agent, and from one or more patients with type 2 SLE that had been treated with a therapeutic agent.
- an expression reference standard is particularly useful when the expression of large numbers of nucleotide sequences is assayed, e.g. in an array, and in certain other applications, e.g. qualitative PCR, RT-PCR, etc., where it is desirable to compare a sample profile to a standard profile, and/or when large numbers of expression profiles, e.g. a patient population, are to be compared.
- an expression reference standard should be available in large quantities, should be a good substrate for amplification and labeling reactions, and should be capable of detecting a large percentage of candidate nucleic acids using suitable expression profiling technology.
- the expression reference standard can be derived from any subject or class of subjects including healthy subjects or subjects diagnosed with the same or a different disease or disease criterion. Expression profiles from subjects in two distinct classes are compared to determine which subset of genes in the diagnostic set best distinguish between the two subject classes. It will be appreciated that in the present context, the term "distinct classes" is relevant to at least one distinguishable criterion relevant to a disease of interest, a "disease criterion.” The classes can, of course, demonstrate significant overlap (or identity) with respect to other disease criteria, or with respect to disease diagnoses, prognoses, or the like.
- the mode of discovery involves, e.g., comparing the molecular signature of different subject classes to each other (such as patient to control, patients with a first diagnosis to patients with a second diagnosis, etc.) or by comparing the molecular signatures of a single individual taken at different time points.
- the invention can be applied to a broad range of diseases, disease criteria, conditions and other clinical and/or epidemiological questions, as further discussed above/below.
- a reference expression profile can be determined for all patients without the disease criterion in question who have similar characteristics, such as age, sex, race, diagnoses, etc.
- the invention provides methods for diagnosis of a patient as having a longitudinally stable classification of SLE by detecting the expression of genes whose expression correlates with the expression of IFI27. In some embodiments, the method is practiced as part of a method to diagnose or monitor the status of SLE in a patient.
- a subject is classified into one of at least two classes of SLE by detecting the expression of at least two genes whose expression corrrelates with the expression of IFI27 from about 0.5 to about 1.0 and from about -0.5 to about -1.0 caclulated using Pearson correlation and classifying the subject as having type I or type II SLE based on the expression of these two genes.
- the genes are provided in Table 2. Pharmacogenomics
- Pharmocogenomics is the study of the individual propensity to respond to a particular drug therapy (combination of therapies).
- response can mean whether a particular drug will work on a particular patient, e.g. some patients respond to one drug but not to another drug.
- Response can also refer to the likelihood of successful treatment or the assessment of progress in treatment. Titration of drug therapy to a particular patient is also included in this description, e.g. different patients can respond to different doses of a given medication. This aspect may be important when drugs with side-effects or interactions with other drug therapies are contemplated.
- Diagnostic gene sets are developed and validated for use in assessing whether a patient will respond to a particular therapy and/or monitoring response of a patient to drug therapy (therapies).
- Disease criteria correspond to presence or absence of clinical symptoms or clinical endpoints, presence of side-effects or interaction with other drug(s).
- the diagnostic nucleotide set may further include nucleotide sequences that are targets of drug treatment or markers of active disease.
- Example 1 describes the SLE patients, criteria for their diagnosis, and collection and characterization of blood and tissue samples from normal subjects and patients in periods of quiescence and flare. Although analyses determined that expression profiles contained a subset of genes, designated interferon response genes (INFr), whose expression generally correlated with disease severity, but not with change in patient status from quiescence to flare. Based on this fact, subject and patient samples can be queried for expression of the subset of INFr genes.
- INFr interferon response genes
- Example 2 describes the analysis of gene expression in samples from SLE patients. Pearson correlation was used to identify 15 different, pathway or cell-type specific, gene clusters that were differentially expressed in patient samples during periods of disease quiescence versus periods when that patient was converting from quiescence to flare. These clusters are also shown and described in Table 1. Column 1 shows the number of the cluster; column 2, the array ID; column 3, the GenBank ID; column 4, the gene ID; and column 5, a short description of the gene.
- a sample from the subject or patient is analyzed for differential expression of at least one gene selected from each of at least two different gene clusters shown in Table 1. Comparison of patient gene expression with reference profiles can also serve to monitor the status of SLE, to predict flare, and to assess treatment efficacy.
- Prediction algorithms were developed using gene expression representing quiescent (QQ) versus flare (QF) samples. Multiple regression analysis was used to associate gene expression with flare, and linear regression was used to examine individual genes. In general, prediction algorithms were trained using 90% of the samples; and cross-validated, using 10% of samples in 100 iterations as explained in Example 3. Prediction algorithms can be also used to assess patient prognosis— presence or likelihood of developing premature carotid atherosclerosis or progressing to end-stage organ damage— and to monitor treatment of SLE patients. Of particular interest are samples and expression profiles from patients who responded to a given steroid or immunosuppressant treatment regime versus samples or profiles from those same patients where the medication stopped working or from different patients who did not respond or were resistant to a specific medication or treatment regime.
- Gene expression was analyzed using at least one statistical method selected from analysis of variance, classification algorithms, classification and regression trees, Fisher's Exact Test, linear algorithm, linear discriminatory analysis, linear regression, logistic algorithm, multiple regression, nearest shrunken centroids classifier, Pearson correlation, prediction algorithm, significance analysis of microarrays, one-tailed T-tests, two-tailed T- tests, voting algorithm, Wilcoxon's signed ranks test and the like.
- Fisher's Exact Test linear algorithm
- linear discriminatory analysis linear regression
- logistic algorithm logistic algorithm
- nearest shrunken centroids classifier Pearson correlation, prediction algorithm, significance analysis of microarrays, one-tailed T-tests, two-tailed T- tests, voting algorithm, Wilcoxon's signed ranks test and the like.
- Example 4 describes the classification of SLE patients into type 1 SLE and type 2 SLE is based on IFNr score.
- a linear algorithm was used in the analysis of the expression of at least two INFr genes selected from Table 2.
- Expression of IFI27 was chosen as the basis to which all of other genes expressed in SLE were compared, and Table 2 shows the 190 features (probes on a microarray) that represent those INFr genes positively correlated with IFI27 (cutoff of > 0.5 or ⁇ -0.5 using Pearson correlation).
- Table 2 shows the feature ID on the Human Genome CGH 44A microarrays (Agilent Technologies, Palo Alto CA) array; column 2, the name of probe; column 3, symbol or identifier for the gene; column 5, description of the gene; and column 6, correlation with IFI27.
- IFI27 and the two other INFr genes highlighted in Table 2 were used to develop an exemplary algorithm, IFI27 + IFI144*(1.1296) + OAS3* (1.8136), that can be used to produce an INFr score.
- Examples 5-8 describe how normal and patient samples were purified and handled.
- Examples 9-1 1 describe the nucleic acid technologies (microarray and polymerase chain reaction) used to detect gene expression and produce gene expression patient and reference profiles.
- Methods are presented for screening subjects for SLE, for classifying a patient already diagnosed with SLE as having type 1 SLE or type 2 SLE, for predicting disease activity or flare, for selecting an effective immunosuppressant and/or therapeutic agent for treatment of SLE, and for identifying subjects with SLE from subjects with other rheumatic diseases.
- Useful reference profiles were derived from samples from at least one normal subject and from at least one patient diagnosed with SLE and include but are not limited to a gene expression from one or more patients with quiescent type 1 SLE, from one or more patients with quiescent type 2 SLE, from one or more patients with type 1 SLE showing increased disease activity or flare, from one or more patients with type 2 SLE showing increased disease activity or flare, from one or more patients with type 1 SLE that had been treated with an immunosuppressant, from one or more patients with type 2 SLE that had been treated with an immunosuppressant, from one or more patients with type 1 SLE that had been treated with a therapeutic agent, and from one or more patients with type 2 SLE that had been treated with a therapeutic agent.
- Reagents used to establish a gene expression profile include but are not limited to: 1) genes and their splice variants, primers, probe sets, peptide nucleic acids, locked nucleic acids and amplicons that can be used in nucleic acid technologies including but not limited to hybridization on arrays and amplification using quantitative RT-PCR; and 2) proteins and their fragments, antibodies, and affinity reagents that can be used in protein technologies including but not limited to protein or antibody arrays and enzyme-linked immunosorbent assays (ELISAs). These reagents can be used in assays or diagnostic kits to screen subjects for SLE.
- Assays or diagnostic kits based on the primers and probe sets as described in Example 9 can be used with a sample from a subject with symptoms of a rheumatic disease to diagnose, classify or rule out SLE; and with a sample from a patient diagnosed with type 1 SLE or type 2 SLE to select a clinical trial, to predict flare, to detect immunosuppressant responsiveness, to determine efficacy of a therapeutic agent, to design treatment regimes, to monitor the status of the patient or treatment regime.
- the diagnostic kit includes an array of nucleic acid molecules or antibodies; in another, the diagnostic kit includes probe sets for use in quantitative RT-PCR.
- Pharmacogenomics is the study of an individual's response to a particular therapeutic agent, immunosuppressant or combinations of agents.
- response refers to whether a particular agent or drug will work better for a particular type 1 SLE or type 2 SLE patient.
- the methods disclosed provide for assigning a patient to a clinical trial based on classification as type 1 SLE or type 2 SLE and disease status (quiescent or flare).
- Pharmacogenomics is also important in determining the dosage of a therapeutic agent based on classification and disease status of the patient. It is contemplated that a patient diagnosed with type 1 SLE will respond differently to a particular immunosuppressant or therapeutic agent than a patient diagnosed with type 2 SLE. Individual response must also be taken into account relative to the side-effects or interactions of various immunosuppressant or therapeutic agents. Some potentially useful therapeutic agents and immunosuppressants are listed in the definitions and claims.
- the cohort was more or less racially balanced, and its individuals represented a broad socioeconomic spectrum.
- the patient samples and clinical data used in this investigation were from SLE patients who had been in the cohort for more than one year. In total, these patients visited the clinic 1782 times (an average of 5.9 quarterly visits for each patient).
- samples for training and validating prediction algorithms were obtained from the Autoimmune Disease Registry of the Hospital for Special Surgery (HSS; New York City NY).
- QFl primary QF quiescent sample that proceeds to flare within 150 days No prior flare within 60 day 1 primary pair per patient only SLEDAl > 4
- QF4 second QFl A second, unique QFl iF from the same patient
- QF5 earliest baseline additional, earlier QF for a given QFl IF F: high current disease activity
- PGA Physical's Global Assessment
- Column one shows class or T-test; column two, number of patients (No), column three, physician's global assessment (PGA); column four, SLEDAI score, column five, prednisone treatment (Pred); column six, percent of patients on immunosuppressant treatment (Immuno); column seven, percent of patients on intravenous treatment (IVS); and column seven, percent of the patients who are female.
- the normal control sample was a pooled blood sample taken from equal numbers of male and female Expression Genetics employees. These donors were healthy at the time the sample was collected, and none had obvious disease symptoms or diagnosis of SLE or any other rheumatic disease.
- any piece of clinical data collected from patients can be used in a correlation or classification analysis.
- Continuous variables including but not limited to albumin, autoantibodies, hemoglobin or other measures of organ function that contribute to SLEDAI score can be used for correlation analysis. In some cases, the logarithm of the values was used for the analysis. When these variables were included in the analysis, they were treated as another "gene". For example, samples from kidney biopsies can be used to divide SLE patients into groups with or without renal disease. From the analyses of clinical manifestations carried out in this study and differences in clinical manifestations reported by others, it is contemplated that categorical variables such gender, ethnicity and socioeconomic status can also contribute to classification, prediction of flare, and selection or modulation of effective therapeutics.
- Example 4 Classification of Patients as Type 1 SLE and Type 2 SLE [0117] Another step toward better monitoring the status of SLE patients was to classify them as having either type 1 SLE or type 2 SLE. A number of comparisons of data in the relational database were made and validated as described below.
- FIG. 1 The x-axis of Figure 1 represents patient number and the y-axis, the Logio expression ratio for IFI27.
- Figure 1 demonstrates that IFI27 was not differentially expressed according to disease activity or flare. Further examination of longitudinal data showed that expression of INFr genes placed SLE patients into at least two different groups.
- INFr score based on these three genes reflects the Logio ratio of patient sample expression over reference sample expression on the microarray after normalization using Feature Extraction v 7.5 software (Agilent Technologies). The standard deviation for each gene was normalized so that each of the genes would have the same influence on IFNr score.
- the exemplary algorithm is: IFI27 + IFI144*(1.1296) + OAS3*( 1.8136).
- IFI27 also known as ISG12 and p27 maps to chromosome 14q32, the location of the serine protease inhibitor gene cluster. IFI27 is induced by alpha interferon and localizes to the nuclear membrane.
- IFI27 is expressed in breast, head and neck carcinomas, it has been used to predict patient sensitivity to cisplatin and paclitaxel; 2) IFI44 (also known as MTAP44) is induced by ⁇ and ⁇ interferons, but not by ⁇ interferon and aggregates to form microtubular-like structures in hepatitus-C infected cells; and 3) OAS3 maps to chromosome 12q24.2 and is an interferon-induced protein that catalyzes the synthesis of 2'-5' oligomers of adenosine.
- Table 3 presents longitudinal data for patients with SLE. Column one shows patient number; column two, ABCoN ID followed by sample number; column three, sample designated as quiescent (QF) or flare (F); column four, date sample taken; column five, SLEDAI score; column six, IFNr score (high or low); column seven, days from first sample; and INFr score. The cutoff for distinguishing between high IFNr and low IFNr scores was the average of all INFr scores. Table 3 demonstrated: 1) longitudinal stability of INFr score in an individual over time, 2) the existence of at least two types of SLE as defined by high and low expression of IFNr genes, and 3) lack of correlation between SLEDAI and IFNr scores as shown for patients 2, 4, 6, 9, and 15.
- the x-axis shows the number assigned each normal subject or SLE patient, and the y-axis shows INFr score where the scale is fold. As shown on this graph, INFr scores varied by as much as 500-fold. Although they appeared healthy at the time of sampling, three of the normal subjects had slightly elevated IFNr scores that were attributed to infection, allergies, or other sub-acute, non-SLE conditions.
- SLEDAI scores are on average higher in type 1 SLE patients (who generally show more severe symptoms), SLEDAI did not correlate with high or low INFr score.
- the clinical manifestations that did associate with type 1 SLE included low serum complement levels, high anti-double stranded DNA antibodies, and more renal disease.
- the mononuclear cells and plasma moved to the top of the tube while the RBCs and the granulocytes were trapped beneath the gel barrier when the tube was centrifuged in a swinging bucket rotor at 1750 x g for 20 min at room temperature. After, the mononuclear cells and plasma were decanted into a 15 ml tube, 5 ml of phosphate-buffered saline (PBS) were added. The tubes was inverted 5 times and centrifuged for 5 min at 1750 x g to pellet the cells; the supernatant was discarded.
- PBS phosphate-buffered saline
- RLT lysis buffer (Qiagen, Chatsworth CA) was added to the pellet, the cells and lysis buffer were pipetted up and down to ensure complete lysis. Cell lysate was frozen and stored at -80°C until total RNA was isolated.
- RNA quality was assessed using spectrophotometry, A260/A280 spectrophotometric ratios were considered to be acceptable when they ranged between 1.6 and 2.0, and/or gel electrophoresis, when 2 ⁇ l of each sample were run on an agarose gel in the presence of ethidium bromide and no degradation of RNA and no DNA contamination were visible.
- RNAs isolated using the first and second protocols were combined when the normal control cell preparations demonstrated reproducibility. The RNAs were mixed in a 50 ml tube, aliquoted into two 15 ml storage or 1.5 ml microcentrifuge tubes (100 ⁇ l per), and stored at -80°C.
- RNA using the Agilent 2100 bioanalyzer and RNA 6000 microfluidics chips (Agilent Technologies).
- cDNA was synthesized from RNA using reverse transcription with OLIGO-dT primers/random hexamers (Invitrogen, Carlsbad CA) at a final concentration of 0.5 ng/ ⁇ l and 3 ng/ ⁇ l, respectively.
- the first strand buffer mix contained 1 x first strand buffer, 10 mM DTT (Invitrogen), 0.5 mM dATP (New England Biolabs (NEB), Beverly MA), 0.5 mM dGTP (NEB), 0.5 mM dTTP (NEB), 0.5 mM dCTP (NEB), 200 U of SUPERSCRIPT RNAse H reverse transcriptase (Invitrogen), and 18 U of RNAGUARD inhibitor (GE Healthcare (GEH), Piscataway NJ). After the reaction was incubated at 42 0 C for 90 min, the enzyme was heat- inactivated at 70°C for 15 min. After adding 2 U of RNAse H (NEB) to the reaction tube, it was incubated at 37 0 C for 20 min.
- RNAGUARD inhibitor GE Healthcare (GEH), Piscataway NJ
- the cDNA was purified away from the enzymes, dNTPs, and buffers using phenol-chloroform extraction followed by ethanol precipitation in the presence of glycogen.
- the cDNA was purified on a QIAQUICK silica-gel column (Qiagen) followed by ethanol precipitation in the presence of glycogen.
- the cDNA was centrifuged at > 10,000 x g for 30 min; and after the supernatant was aspirated, the pellet was washed with 150 ⁇ l of 70% ethanol. Following recentrifugation, the supernatant was removed, and residual ethanol was evaporated at room temperature.
- the volume of column purified cDNA was reduced in a vacuum evaporator to 7.4 ⁇ l.
- Arrays were used to produce a gene expression profile for diagnosing and monitoring the status of SLE in a patient.
- the array contains reagents specific for at least two genes or proteins, one that binds to a gene or protein of the invention, and one that binds to a control gene or protein.
- Affymetrix U133A Human GeneChips (Affymetrix, Santa Clara CA) with probe sets representing about 14,500 full length genes and 22,000 features were used according to the manuals and product inserts supplied by the manufacturer.
- Affymetrix Microarray Suite (MAS) v 5.0 software was used to generate expression values for each gene. To correct for slight differences in overall chip hybridization intensity and allow for comparison between samples, each chip was scaled to an overall intensity of 1500.
- the PAXgene Blood RNA system (PreAnalytix GmbH, Hombrechtikon Switzerland) was used for whole blood collection, stabilization, and RNA isolation from patient and/or normal samples. Five ⁇ g of total RNA was used to prepare biotinylated cRNA for hybridization using a standard protocol (Expression Analysis Technical Manual, Affymetrix). For samples with low RNA yields, two or more rounds of amplification were performed. Fifteen micrograms of each labeled cRNA was hybridized to Affymetrix U 133 A Human GeneChips.
- a low density array containing amplicons produced using probe sets for genes selected from Table 1 and Table 2 are harvested from PCR reactions, purified using Sephacryl-400 beads (GEH) and arrayed on a membrane.
- the membrane is UV irradiated, washed in 0.2% SDS at room temperature and rinsed three times in distilled water. Non-specific binding sites on the array are blocked by incubation in 0.2% casein in PBS for 30 min at 60°C, and the arrays are washed in 0.2% SDS and rinsed in distilled water.
- purified amplicons are robotically arranged and immobilized on polymer-coated glass slides using the procedure described in USPN 5,807,522 (which is hereby incorporated in its entirety).
- Polymer-coated slides are prepared by cleaning glass microscope slides (Corning Life Sciences, Corning NY) ultrasonically in 0.1% SDS and acetone, etching in 4% hydrofluoric acid (VWR Scientific Products, West Chester PA), coating with 0.05% aminopropyl silane (Sigma-Aldrich) in 95% ethanol, and curing in a 1 10 0 C oven. The slides are washed extensively with distilled water between and after treatments.
- Monoclonal antibodies specific to at least two IFNr proteins and at least two proteins selected from the clusters of Table 1 are immobilized on a membrane, slide or dipstick or added to the wells of an ELISA plate using methods well known in the art.
- the array is incubated in the presence of serum or cell lysate until protein:antibody complexes are formed.
- the proteins encoded by genes or their splice variants are identified by the known position and labeling of the antibody that binds an epitope of that protein on the array. Quantification is normalized using the antibody:protein complex of various controls.
- Tm melting temperature
- amplicon size between 50 and 150 bases in length (optimum, about 100 bases); and primers or probes were allowed to be 36 nucleotides in length.
- Salt concentration a critical parameter affecting the Tm of the probes and primers, was used at the default concentration, 50 mM.
- the C source code for the PRIMER3 program was downloaded from the WRI website and complied on a Sun Enterprise 250 server (Sun Microsystems, Palo Alto CA) using the GCC compiler (Free Software Foundation, Boston MA). A subsequent version was compiled for machines running the Windows operating system (Microsoft, Redmond WA). The program was run from the command line which also dictated the use of an input file that contained the sequences and the parameters for primer design as described in the help files that accompanied the software. A script was written to input a number of sequences and automatically generate a number of potential primers. The following batch approach was used to design primers for the genes.
- the first step in designing primers was to mask out repetitive sequences in the mRNA using the REPEA TMASKER program (Institute for Systems Biology, University of Washington, Seattle WA).
- the second step was to mask out all known SNPs for the genes as annotated in the SNP database at NCBI (Bethesda MD) that have an allelic heterozygosity higher than 1%.
- the masked sequence was submitted to PRIMER3 using parameters as outlined above, and the top eight sequences were selected.
- the Primer3 program was used on the MIT website (Massachusetts Institute of Technology, Cambridge MA) to examine a specific region on the mRNA of a particular gene.
- the final step was to test several of the top pairs of primers for correct size and efficiency.
- Control genes With both microarrays and RT-PCR, variation was monitored by adding one or more genes from bacteria, plants, or animals in one or more wells. Although human ⁇ -actin and ⁇ -GUS were used to validate the control RNAs, several other genes were also tested for variability between samples, for expression in mononuclear and whole blood RNA from control subjects and SLE patients, on samples prepared using various protocols, and in the RT-PCR assays.
- Primer Testing Primers were tested once using RT-PCR protocol (without Rox and Sybr green dyes) to see whether they produced an amplicon of the correct size without amplifying non-specific sequences. Each primer pair/probe set was tested on cDNA made from mononuclear cell control RNA described in Example 2.
- the PCR reaction contained 1 x RealTime-PCR buffer (Ambion, Austin TX), 2 mM MgC12 (ABI), 0.2 mM dATP (NEB), 0.2 mM dTTP (NEB), 0.2 mM dCTP (NEB), 0.2 mM dGTP (NEB), 0.625 U AMPLITAQ Gold enzyme (ABI), 0.3 ⁇ M of each primer to be used (Sigma Genosys, The Woodlands TX), 5 ⁇ l of the reverse transcription reaction, and water added to a final volume of 19 ⁇ l.
- TAQMAN PCR reactions were performed using the TAQMAN Universal PCR Master mix (ABI). The master mix was aliquoted into light tight tubes, one for each gene. The primer pair for each gene was added to the tube of PCR master mix labeled for that gene. A FAM/TAMRA dual labeled TAQMAN probe (Biosearch Technologies, Novato CA) was added to each tube. Alternatively, different combinations of commercially available fluorescent reporter dyes and quenchers were used such that the absorption wavelength for the quencher matches the emission wavelength for the reporter.
- a Sybr green RT-PCR reaction can be performed using the TAQMAN PCR reagent kit (ABI).
- TAQMAN PCR reagent kit (ABI)
- Universal ProbeLibrary LNAs; Roche Diagnostics, Pleasanton CA
- RT-PCR Assays and Analysis 18 ⁇ l of master mix were dispensed into each well of a 384 well plate (ABI), and 2 ⁇ l of the template sample were dispensed into triplicate wells for each primer pair. The final concentration of each reagent was: 1 x TAQMAN Universal PCR Master Mix, 300 nM each primer, 0.25 nM TAQMAN probe, and 21 ⁇ l of 1 :10 diluted template. PCR reactions were run on the PRISM 7900HT Sequence Detection system (ABI) with the following conditions: 10 min at 95°C; 40 cycles of 95 0 C for 15 sec, 60 0 C for 1 min.
- ABSI PRISM 7900HT Sequence Detection system
- Sequence detection system v2.0 software was used to analyze the fluorescent signal from each reaction.
- Standard deviation (Stdev) and coefficient of variation (CV) were calculated for triplicate wells. If the CV was greater than 2, an outlier among the three wells was identified and deleted; and the average was recalculated.
- ⁇ CT difference in CT
- the expression relative to the control was calculated by taking two to the power of the ⁇ CT of the gene.
- RNA concentration for each cDNA dilution was determined based on the original amount of RNA used in the reverse transcription reaction, the dilution of the reverse transcription reaction, and the amount used in the RT-PCR reaction (usually 5 ⁇ l).
- probe sets for control genes can be run in the same reaction as the probe set for the diagnostic gene to reduce variation. Different fluorescent dyes were used to amplify the control, differentiating their expression from that of the diagnostic gene.
- RT-PCR was used to compare the expression of each gene using the primers described above.
- cDNA was synthesized from normal control, patient, and reference samples.
- Ten ⁇ l RT-PCR reactions were performed using a PRISM 7900 Sequence Detection system (ABI) using FAM-TAMRA labeled probes and the standard TAQMAN protocols described above.
- a lower CT indicated a higher amount of starting material (greater expression in the sample) since an earlier cycle number meant the threshold was crossed more quickly.
- a CT of less than 30 based on appropriate cDNA dilutions provided linear results for the blood samples from SLE patients.
- labeling moieties or technologies can be used to measure amplification product in RT-PCR.
- Molecular beacons Invitrogen
- FRET Fluorescence-activated fluorescent-resonance resonance resonance resonance resonance resonance resonance resonance resonance resonance resonance resonance resonance resonance resonance resonance resonance RNA RNA binds to RNA.
- Other labeling moieties can be used for detection of an antibody, nucleic acid or protein in any of the assays or diagnostic kits described herein. These labeling moieties include fluorescent, chemiluminescent, or chromogenic agents, cofactors, enzymes, inhibitors, magnetic particles, radionuclides, reporters/quenchers, substrates and the like that can be attached to or incorporated into the antibody, nucleic acid or protein.
- Visible labels and dyes include but are not limited to anthocyanins, avidin-biotin, ⁇ glucuronidase, biotin, BIODIPY, Coomassie blue, Cy3 and Cy5, 4,6-diamidino-2-phenylindole (DAPI), digoxigenin, ethidium bromide, FAM/TAMRA, FITC, fluorescein, gold, green fluorescent protein, horseradish peroxidase, lissamine, luciferase, phycoerythrin, reporter/quencher pairs (HEX/TAMRA, JOE/TAMRA, ROX/BHQ2, TAMRA/BHQ2, TET/BHQ1, VIC/BHQl, and the like), rhodamine, spyro red, silver, streptavidin, and the like.
- Radioactive markers include radioactive forms of hydrogen, iodine, phosphorous, sulfur, and the like.
- Adapter sequences for subcloning are added at either end of a coding region specific to a gene or a portion thereof and amplified using PCR.
- An epitope or affinity tag (6 x his) or sequences for secretion from a cell can be added to the adapter sequence to facilitate purification and/or detection of the protein.
- the amplified cDNA is inserted into a shuttle or expression vector that can replicate in bacteria, insect, yeast, plant, or mammalian cells.
- Such vectors typically contain a promoter that operably links to the coding region, replication start sites, and antibiotic resistance or metabolite selection sequences.
- the expression vector can be used in an in vitro translation system or to transfect cells.
- Spodoptera frugiperda (Sf9) insect cells are infected with recombinant Autographica californica nuclear polyhedrosis virus (baculovirus).
- the polyhedrin gene is replaced with the cDNA by homologous recombination, and the polyhedrin promoter drives transcription.
- the protein is synthesized as a fusion protein with an affinity tag that enables purification.
- Clones of transformed cells are analyzed to ensure that the inserted sequence is expressed. Once expression is verified, the cells are grown under selective conditions; and the protein is isolated from cells, or if secreted, from the growth media using chromatography, size exclusion chromatography, immunoaffinity chromatography, or other methods including cell fractionation, ion exchange, or selective precipitation.
- the isolated and purified protein is then used as a reagent on an array or as an antigen to produce specific antibodies.
- antibodies are to be used as reagents, the sequence of the gene or splice variant is analyzed to determine regions of high immunogenicity (LASERGENE software; DNASTAR, Madison Wl), and an appropriate oligopeptide is synthesized and conjugated to keyhole lympet hemocyanin (KLH; Sigma-Aldrich, St Louis MO).
- KLH keyhole lympet hemocyanin
- Rabbits are injected with the oligopeptide-KLH complexes in complete Freund's adjuvant, and the resulting antisera is tested for specific recognition of the protein or fragments thereof.
- Antisera that react positively with the protein are affinity purified on a column containing beaded agarose resin to which the synthetic oligopeptide has been conjugated (SULFOLINK kit; Pierce Chemical, Rockford IL). The column is equilibrated using 12 ml IMMUNOPURE Gentle Binding buffer (Pierce Chemical). Three ml of rabbit antisera is combined with one ml of binding buffer and poured into the column.
- the column is capped (on the top and bottom), and antisera is allowed to bind with the oligopeptide by gentle shaking at room temperature for 30 min.
- the column is allowed to settle for 30 min, drained by gravity flow, and washed with 16 ml binding buffer (4 x 4 ml additions of buffer).
- the antibody is eluted in one ml fractions with IMMUNOPURE Gentle Elution buffer (Pierce Chemical), and absorbance at 280 nm is determined. Peak fractions are pooled and dialyzed against 50 mM Tris, pH 7.4, 100 mM NaCl, and 10% glycerol. After dialysis, the concentration of the purified antibody is determined using the BCA assay (Pierce Chemical), aliquoted, and frozen.
- Electrophoresis and Blotting [0175] Samples containing protein are mixed in 2 x loading buffer, heated to 95 0 C for 3-5 min, and loaded on 4-12% NUPAGE Bis-Tris precast gel (Invitrogen). Unless indicated, equal amounts of total protein are loaded into each well. The gel is electrophoresed in 1 x MES or MOPS running buffer (Invitrogen) at 200 V for approximately 45 min on an XCELL II apparatus (Invitrogen) until the RAINBOW marker (GEH) resolves and the dye front approaches the bottom of the gel.
- 1 MES or MOPS running buffer Invitrogen
- MOPS running buffer
- GSH RAINBOW marker
- the gel is soaked in 1 x transfer buffer (Invitrogen) with 10% methanol for a few minutes; and a PVDF membrane (Millipore, Billerica MA) is soaked in 100% methanol for a few seconds to activate it.
- the membrane, the gel, and supports are placed on the TRANSBLOT SD transfer apparatus (Biorad, Hercules CA) and a constant current of 350 mA is applied for 90 min.
- the proteins are transferred to the membrane, it is blocked in 5% (w/v) non-fat dry milk in 1 x phosphate buffered saline (PBS) with 0.1% Tween 20 detergent (blocking buffer) on a rotary shaker for at least 1 hr at room temperature or at 4 0 C overnight. After blocking, the buffer is removed, and 10 ml of primary antibody in blocking buffer is added and incubated on the rotary shaker for 1 hr at room temperature or overnight at 4°C. The membrane is washed 3 times for 10 min each with PBS-Tween (PBST), and secondary antibody, conjugated to horseradish peroxidase, is added at a 1 :3000 dilution in 10 ml blocking buffer. The membrane and solution are shaken for 30 min at room temperature and washed three times for 10 min with PBST.
- PBS-Tween PBS-Tween
Abstract
The invention presents a method of diagnosing or monitoring the status of systemic lupus erythematosus (SLE) in a subject or patient comprising detecting the expression of all genes of a diagnostic set in the subject or patient wherein the diagnostic set comprises two or more genes having expression correlated with the classification or status of SLE; and diagnosing or monitoring the status of SLE in the subject or patient by applying at least one statistical method to the expression of the genes of the diagnostic set.
Description
METHODS FOR DIAGNOSING AND MONITORING THE STATUS OF SYSTEMIC LUPUS ERYTHEMATOSUS
PRIORITY
[0001] This application claims the benefit of U.S. Prov. App. No. 60/858,147, filed November 9, 2006, which is incorporated by reference herein in its entirety.
TECHNICAL FIELD
[0002] The invention provides for the use of gene expression and statistical analysis to diagnose and monitor the status of systemic lupus erythematosus.
BACKGROUND OF THE INVENTION
[0003] Systemic lupus erythematosus (SLE) is an autoimmune rheumatic disease characterized by dysregulation of the immune system and differential expression of genes in immunological pathways. In the United States, SLE affects about 2 million patients and 90% of these patients are female. Targeted tissues and organs include the blood, central nervous system (CNS), joints, kidneys, lungs, skin, and vasculature. Symptoms include abnormal blood panels, arthralgias, atherosclerosis, CNS disorders, infections, joint pain, malaise, rashes, ulcers, and the production of autoantibodies. Since disease severity, symptomology, and response to therapy vary widely, SLE is difficult to diagnose, manage and treat.
[0004] As described in USSN 20040033498, SLE clearly involves differential gene expression in SLE patients as compared to normal controls. Two laboratories have reported on the role of the interferon (INF)-α inducible genes in SLE and on high levels of anti-RNA binding protein, anti-Ro antibodies, and renal disease (Baechler et al (2003) PNAS 100:2610- 2615; Kirou et al (2004) Arthritis and Rheumatism 50:3958-3967). However, low positive correlation between disease activity and IFN-inducible genes, the apparent heterogeneity of SLE patients, and lack of longitudinal studies continue to present challenges for clinicians (Kirou et al. (2005) Arthritis and Rheumatism 52:1491-1503).
[0005] These challenges point to a need in the art for better diagnosis, characterization, and
follow-up of patients with SLE. To this end, longitudinal data from SLE patients was used with methods for detecting and analyzing gene expression to monitor status, quiescence versus flare, and to classify a patient as having type 1 SLE or type 2 SLE.
SUMMARY
[0006] The invention presents methods and compositions for diagnosing and monitoring systemic lupus erythematosus (SLE). The methods use gene expression based on nucleic acid or protein technologies, and statistical methods to classify patients as having type 1 SLE or type 2 SLE and to monitor disease activity, predict flare, and assess the efficacy of treatment administered to the patient.
[0007] The invention provides a method of diagnosing or monitoring the status of systemic lupus erythematosus (SLE) in a subject or patient includes detecting the expression of all genes of a diagnostic set in the subject or patient wherein the diagnostic set comprises two or more genes having expression correlated with the classification or status of SLE; and diagnosing or monitoring the status of SLE in the subject or patient by applying at least one statistical method to the expression of the genes of the diagnostic set. In one aspect, the statistical method is a prediction algorithm that produces a number or single value indicative of the status of SLE in the subject or patient. In another aspect, the statistical method further comprises classification of the subject or patient into one of at least two classes of SLE, and is optimized to maximize the separation among longitudinally stable classes of SLE. The method also provides a diagnostic set further comprising at least one gene selected from each of at least two gene clusters selected from cluster 1, cluster 2, cluster 3, cluster 4, cluster 5, cluster 6, cluster 7, cluster 8, cluster 9, cluster 10, cluster 1 1; cluster 12, cluster 13, cluster 14, and cluster 15 of Table 1. The invention further provides classification of the subject or patient into one of at least two classes of SLE further comprising detecting the expression of two or more gene whose expression correlates with the expression of the IFI27 from about 0.5 to about 1.0 and from about -0.5 to about -1.0 calculated using a Pearson correlation; and classifying a subject or patient as having type 1 or type 2 SLE based on the expression of the two or more genes. In one aspect, one of the two or more genes is selected from Table 2 and
the classifying step uses a linear algorithm to produce an interferon response (INFr) score wherein a high IFNr score is correlated with type I SLE and a low IFNr score is correlated with type II SLE. The invention additionally provides at least one linear algorithm producing an IFNr score comprising IFI27 + IFI144*(1.1296) + OAS3*(1.8136). The invention still further provides a Pearson correlation that is selected from a range of 0.5, 0.4, 0.3, and 0.2 of the expressed genes.
[0008] The invention provides a method of diagnosing or monitoring the status of systemic lupus erythematosus (SLE) in a subject or patient comprising detecting the expression of all genes of a diagnostic set in a subject or patient wherein the diagnostic set includes at least one gene from each of at least two gene clusters selected from cluster 1, cluster 2, cluster 3, cluster 4, cluster 5, cluster 6, cluster 7, cluster 8, cluster 9, cluster 10, cluster 11 ; cluster 12, cluster 13, cluster 14, and cluster 15 of Table 1 ; and diagnosing or monitoring the status of SLE in the subject or patient based on expression of the genes in the diagnostic set. In one aspect, the expression of all genes in the diagnostic set is detected using a nucleic acid technology further including hybridization in solution or on a substrate or amplification in a quantitative realtime polymerase chain reaction. In another aspect, expression of all genes is proportional to the amount of RNA isolated from a subject or patient sample further including a body fluid selected from whole blood or a blood fraction, ascites, cerebrospinal fluid, lymph, sputum, and urine or a tissue selected from central nervous system, joints, kidneys, liver, lungs, oral cavity, sinuses, skin, and vasculature obtained by any sampling means selected from aspiration of a body fluid, a biopsy of a tissue or an organ, drawing of peripheral blood, endoscopy, and lavage followed by aspiration.
[0009] The invention provides for the use of at least one primer or probe set to detect the expression of each of the genes in the diagnostic set. In one aspect, the primers or probe sets are oligonucleotides selected from natural or synthetic cDNA, genomic DNA, locked nucleic acids, peptide nucleic acids, and RNA and can be used in a diagnostic kit. The invention also provides a method of diagnosing a patient as having a longitudinally stable classification of SLE by detecting the expression of two or more genes whose expression correlates with the
expression of the IFI27 from about 0.5 to about 1.0 and from about -0.5 to about -1.0 calculated using Pearson correlation; and diagnosing the patient as having type I or type II SLE based on analyzing the expression of the two or more genes using a statistical method. The invention further provides for assigning a subject or patient to a clinical trial based on their classification as type 1 SLE or type 2 SLE.
[0010] The invention provides for monitoring the status of SLE in a subject or patient by predicting incipient flare or disease activity, and assessing response to a therapeutic agent administered to the patient or to an immunosuppressant administered to a patient. The invention also provides for screening a subject exhibiting symptoms of a rheumatic disease selected from ankylosing spondylitis, dermatomyositis, autoimmune hepatitis, hepatitis-C (hep-C), polymyalgia rheumatica, polymyositis, rheumatoid arthritis (RA), scleroderma, systemic sclerosis, Sjogren's disease, systemic vasculitis, and Whipple's disease.
[0011] The invention provides method of producing a probe set for diagnosing or monitoring SLE in a subject or patient by selecting at least one gene from each of at least two of the gene clusters of Table 1 and at least two genes from Table 2; and producing a probe set consisting of at least one oligonucleotide that detects the expression of each of the selected genes. In one aspect, the probe set is used in a diagnostic kit.
[0012] The invention provides a method for predicting flare in a patient diagnosed with SLE by analyzing gene expression in a sample from the patient to produce a gene expression profile wherein a first portion of the analysis includes using expression of at least one gene selected from each of at least two of the clusters 1 through 15 of Table 1 and at least one statistical method to produce a patient expression profile, and a second portion of the analysis includes using expression of at least two genes selected from Table 2 and a linear algorithm to classify the patient as having type 1 SLE or type 2 SLE; and predicting flare by comparing the patient gene expression profile at least one reference profile. In one aspect, the reference profile is selected from at least one normal subject, at least one patient classified as having type 1 SLE with quiescent status, at least one patient classified as having type 1 SLE in flare, at least one patient classified as having type 2 SLE with quiescent status, at least one patient
classified as having type 2 SLE in flare.
BRIEF DESCRIPTION OF THE FIGURES
[0013] Figure 1 shows the Logio expression ration for Interferon Responsive Gene IFI27 in QF and F paired samples.
[0014] Figure 2 shows the Interferon Response (INFr) score for normal controls and SLE patient.
[0015] Figure 3 shows the bimodal distribution for IFI27, IFI44, and OAS3 of SLE patients.
DESCRIPTION OF THE TABLES
[0016] Table 1 shows 15 clusters of correlated genes that are differentially expressed as SLE patients change status from quiescence to flare and can be used with at least one statistical method to predict flare. Cell types corresponding to each cluster are indicated as well as Array ID, Genbank ID, Gene ID, and the source of each gene. 60-mer sequences, which are unique identifiers for the genes, are also displayed in Table 1. The Sequence Listing provides the 60-mer sequences listed in Table 1.
[0017] Table 2 lists INFr genes with expression that positively correlates with IFI27 expression and can be used with at least one statistical method to classify a patient as having either type 1 SLE or type 2 SLE. 60-mer sequences, which are unique identifiers for the genes, are also displayed in Table 2.
[0018] Table 3 presents longitudinal data for SLE patients showing stability in an individual's INFr score and its lack of correlation with SLEDAI.
DETAILED DESCRIPTION OF THE INVENTION
Definitions
[0019] Unless defined otherwise, all scientific and technical terms are understood to have the same meaning as commonly used in the art to which they pertain. In this application, the singular form — "a", "an", and "the"~includes plural references unless the context clearly dictates otherwise. For example, the term "an agent" includes a plurality of agents and
mixtures thereof. For the purpose of this invention, the following terms are defined below.
[0020] "Amplification" refers to any device, method or technique that can make copies of a nucleic acid. It can be achieved using polymerase chain reaction (PCR) techniques such as linear amplification (cf. USPN 6,132,997), rolling circle amplification, and the like. Further, amplification and detection can be combined as in TAQMAN Real-Time PCR (RT-PCR) using the TAQMAN protocols and the Prism 7900HT Sequence detection system and software (Applied Biosystems (ABI), Foster City CA).
[0021] "Array" refers to an ordered arrangement of at least two reagents— antibodies, nucleic acids or proteins—in solution or on a substrate where at least one of the reagents represents a normal control and the other, a sample of diagnostic or prognostic interest. The ordered arrangement insures that the size and signal intensity of each labeled complex, formed between at least one reagent and at least one nucleic acid or protein to which the reagent specifically binds, is individually distinguishable.
[0022] The term "diagnostic set" generally refers to a set of two or more genes that, when evaluated for differential expression of their products, collectively yields predictive data. Such predictive data typically relates to diagnosis, prognosis, monitoring of therapeutic outcomes, and the like. In general, the components of a diagnostic set are distinguished from nucleotide sequences that are evaluated by analysis of the DNA to directly determine the genotype of an individual as it correlates with a specified trait or phenotype, such as a disease, in that it is the pattern of expression of the components of the diagnostic set, rather than mutation or polymorphism of the DNA sequence that provides predictive value. It will be understood that a particular component (or member) of a diagnostic set can, in some cases, also present one or more mutations, or polymorphisms that are amenable to direct genotyping by any of a variety of well known analysis methods, e.g., Southern blotting, RFLP, AFLP, SSCP, SNP, and the like.
[0023] "cDNA" refers to an isolated polynucleotide, nucleic acid molecule, or any fragment or complement thereof that originated recombinantly or synthetically, is double- or single- stranded, represents coding and noncoding 3' or 5' sequence, and generally lacks introns.
[0024] "Classification" refers to the categorization of a subject or patient based on gene expression as having type 1 SLE or type 2 SLE. SLE is considered to be type 1 if it primarily involves Type 1 T helper cells and type 1 -linked cytokines, such as interferon-gamma. SLE is considered to be type 2 if there is more involvement of Type 2 helper cells which activate an antibody-driven immune response.
[0025J "Expression" refers differential gene expression— an increased (i.e., upregulated) or a decreased (i.e., downregulated) expression as detected by absence, presence, or change in the amount of messenger RNA or protein for a gene in a sample.
[0026] "Flare" refers to onset of disease activity in a patient diagnosed with an immune disorder; in SLE, mild flare has been defined by an increase in systemic lupus erythematosus disease activity index (SLEDAI) by > four units over a previous score for that patient and severe flare, as an increase in SLEDAI by > 12 units. SLEDAI represents a composite assessment of disease activity based on 16 clinical manifestations and eight laboratory measures including two immunological tests with a possible range of overall score from 0 to 105.
[0027] A "gene expression profile" refers to the identification, characterization, quantification, and representation of a plurality of genes expressed in a sample as measured using nucleic acid or protein technologies. A nucleic acid expression profile is produced using mature mRNA transcript and/or regulatory sequences such as promoters, enhancers, introns, mRNA-processing intermediates, and 3' untranslated regions in nucleic acid technologies. A protein expression profile, although time delayed, mirrors the nucleic acid expression profile and is produced using protein technologies and proteins and/or antibodies to detect protein expression in a sample. Results from subject or patient samples are compared with reference profiles based on normal, diseased, or treated samples.
[0028] "Immunosuppressant" refers to any therapeutic agent that suppresses immune response in a patient such as anticoagulents, antimalarials, heart drugs, non-steroidal antiinflammatory drugs (NSAIDs), and steroids including but not limited to aspirin, azathioprine, chloroquine, corticosteroids, cyclophosphamide, cyclosporin A, dehydroepiandrosterone,
deoxyspergualin, dexamethasone, everolimus, fenoprofen, hydralazine, hydroxychloroquine, immunoglobulin, ibuprofen, indomethacin, leflunomide, ketoprofen, meclophenamate, mepacrine, 6-mercaptopurine, methotrexate, mizoribine, mycophenolate mofetil, naproxen, prednisone, methyprenisone, rapamycin (sirolimus), solumedrol, tacrolimus (FK506), thymoglobulin, tolmetin, tresperimus, triamcinoline, and the like.
[0029] "Longitudinally stable" refers to the behavior of one or more interferon response (INFr) genes expressed in samples collected at different time points from an individual or data derived from those samples.
[0030] "Diagnosis or monitoring" refers to the detection of gene expression at the nucleic acid or protein level to provide useful information about an individual's medical status. Monitoring status can include determination of prognosis or complication, following progression of a disease, prediction of disease activity or flare, providing information relating to a patient's health over a period of time, selection of a therapeutic agent and/or determining response or resistance to that agent, selecting an individual patient or small subsets of patients most likely to benefit from an experimental therapy or clinical trial, and determining classification of a patient as having a particular disease status.
[0031] "Normal" refers to the medical status of an individual, or a sample from an individual, who does not have SLE or any diagnosis or manifestation of an infection or immune disorder and can be used as a negative control.
[0032] "Nucleic acid technology" refers to any device, means or system used to detect gene expression or produce a gene expression profile and includes but is not limited to methods using arrays for amplification in PCR, TAQMAN RT-PCR, quantitative RT-PCR, and the like, or hybridization in solution or on a substrate containing cDNAs, genomic DNAs, locked nucleic acids, oligonucleotide primers or probes, peptide nucleic acids, polynucleotides, and RNAs of any length either natural or synthetic, and the like.
[0033] "Patient" refers to a human subject who is genetically predisposed to a rheumatic disease or has been diagnosed with a SLE.
[0034] "Prediction" refers to the use of gene expression assessed using nucleic acid or protein technologies, algorithms and statistical analyses to provide information about an individual's status; for example, being predisposed to, diagnosed with, or effectively treated for disease activity or flare.
[0035] "Protein technology" includes but is not limited to activity assays, affinity antibody or protein arrays, chromatographic separation, colorimetric assays, two-dimensional gel electrophoresis, enzyme-linked immunosorbent assays (ELISA), fluorescent-activated cell sorting (FACS), mass spectrophotometric detection, western analysis, and the like.
[0036] A "reference profile" refers to gene expression or gene expression profiles from well-characterized normal, diseased or treated samples taken from at least one subject and giving repeatable results whenever used in or with a particular nucleic acid or protein technology.
[0037] A "rheumatic disease" is a condition or disorder selected from ankylosing spondylitis, dermatomyositis, autoimmune hepatitis, hepatitis-C (hep-C), polymyalgia rheumatica, polymyositis, rheumatoid arthritis (RA), scleroderma, systemic sclerosis, Sjogren's disease, systemic vasculitis, Whipple's disease and the like.
[0038] "Sample" is used in its broadest sense and refers to any biological material used to obtain histological information or to measure gene expression obtained by any means from a subject. A sample can be a body fluid such as ascites, bile, blood, cerebrospinal fluid, synovial fluid, lymph, pus, semen, sputum, urine; the soluble fraction of a cell preparation, an aliquot of media in which cells were grown; a chromosome, an organelle, or membrane isolated or extracted from a cell; cDNA, genomic DNA, or RNA in solution or bound to a substrate; a cell; a tissue biopsy, and the like. Preferred samples for diagnosis, prognosis, or monitoring of SLE patients are leukocytes or serum derived from whole blood, biopsies of the central nervous system (CNS), joints, kidneys, liver, lungs, oral cavity, sinuses, skin, vasculature, and any other tissues or organs affected by SLE.
[0039] "Sampling means" refers to aspiration, biopsy, endoscopy, lavage, needle aspiration or biopsy, puncturing with a lancet; bleeding, ejaculating, expectorating, seeping, or urinating
into or onto a collection device, container, substrate, and the like.
[0040] "Status" refers to the deterioration, improvement, progression, remission, or stability of a patient with SLE, as determined from analyzing one or more samples from that patient. Status, or a change therein, can be used to evaluate the need for administration of a therapeutic agent, to adjust dosage of such an agent, to change or use another agent or treatment regime, and the like.
[0041] "Statistical methods" include but are not limited to analysis of variance, classification algorithms, classification and regression trees, Fisher's Exact Test, linear algorithm, linear discriminatory analysis, linear regression, logistic algorithm, multiple regression, nearest shrunken centroids classifier, Pearson correlation, prediction algorithm, significance analysis of microarrays, one-tailed T-tests, two-tailed T-tests, voting algorithm, Wilcoxon's signed ranks test, and the like.
[0042] "Substrate" refers to any rigid or semi-rigid support to which antibodies, nucleic acids or proteins are bound and includes magnetic or nonmagnetic beads, capillaries or other tubing, chips, fibers, filters, gels, membranes, microparticles, plates, polymers, slides, and wafers with a variety of surface forms including channels, columns, pins, pores, trenches, wells and the like.
[0043] "Therapeutic agent" refers to any pharmaceutical molecule or compound that will bind specifically to a polynucleotide or to an epitope of a protein and stabilize or modulate the activity of the polynucleotide or protein. It can be composed of inorganic and/or organic substances including minerals, cofactors, nucleic acids, proteins, carbohydrates, fats, and lipids and includes but is not limited to Ace inhibitors, aspirin, azathioprine, B7RP-l-fc, β- blockers, brequinar sodium, campath-lH, celecoxib, chloroquine, corticosteroids, Coumadin, cyclophosphamide, cyclosporin A, dehydroepiandrosterone, deoxyspergualin, dexamethasone, diclofenac, dolobid, etodolac, everolimus, FK778, feldene, fenoprofen, flurbiprofen, heparin, hydralazine, hydroxychloroquine, CTLA-4 or LFA3 immunoglobulin, ibuprofen, indomethacin, ISAtx-247, ketoprofen, ketorolac, leflunomide, meclophenamate, mefenamic acid, mepacrine, 6-mercaptopurine, meloxicam, methotrexate, mizoribine, mycophenolate
mofetil, naproxen, oxaprozin, Plaquenil, NOX-100, prednisone, methyprenisone, rapamycin (sirolimus), sulindac, tacrolimus (FK506), thymoglobulin, tolmetin, tresperimus, UO 126, and antibodies including but not limited to alpha lymphocyte antibodies, adalimumab, anti-CD3, anti-CD25, anti-CD52 anti-IL2R, and anti-TAC antibodies, basiliximab, daclizumab, etanercept, hu5C8, infliximab, OKT4, natalizumab and the like.
DETAILED DESCRIPTION OF THE INVENTION Description
[0044] Microarray experiments have been used to find genes that are differentially expressed in patients diagnosed with systemic lupus erythrematosus (SLE). These genes were described in USPN 6,905,827 and USSN 10/990,298, each incorporated by reference herein in its entirety.
[0045] The invention provides methods of diagnosing or monitoring the status of SLE in a subject or patient by detecting the expression of all genes of a diagnostic set in the subject or patient wherein the diagnostic set has two or more genes having expression correlated with the classification or status of SLE; and diagnosing or monitoring the status of SLE in the subject or patient by applying at least one statistical method to the expression of the genes of the diagnostic set.
[0046] The methods of the invention also include classifying the subject or patient as having type 1 SLE or type 2 SLE, predicting flare, and monitoring disease activity and treatment efficacy.
Diagnostic Genes of the Invention
[0047] The invention provides diagnostic sets containing genes that can be used to diagnosis and monitor SLE disease status. The diagnostic sets can also be used to predict occurrence and future complication of the disease.
[0048] Diagnostic genes were identified and validated for use in diagnosing and monitoring of SLE status by identifying genes for which a correlation exists between the SLE status of an individual as determined based on various disease criteria and the individual's expression of
RNA or protein products corresponding to the gene. Disease criteria may include clinical data such as symptom rash, joint pain, malaise, rashes, blood counts (white and red), tests of renal function (e.g. creatinine, blood urea nitrogen, creative clearance), data obtained from laboratory tests, including complete blood counts with differentials, CRP, ESR, ANA, Serum IL6, Soluble CD40 ligand, LDL, HDL, Anti-DNA antibodies, rheumatoid factor, C3, C4, serum creatinine and any medication levels, the need for pain medications, cumulative doses or immunosuppressive therapy, symptoms or any manifestation of carotid atherosclerosis (e.g. ultrasound diagnosis or any other manifestations of the disease), data from surgical procedures such as gross operative findings and pathological evaluation of resected tissues and biopsies (e.g., renal, CNS), information on pharmacological therapy and treatment changes, clinical diagnoses of disease "flare", hospitalizations, death, response to medications, quantitative joint exams, results from health assessment questionnaires (HAQs), and other clinical measures of patient symptoms and disability. Disease criteria also include the clinical score known as SLEDAI (Bombadier C, Gladman D D, Urowitz M B, Caron D, Chang C H and the Committee on Prognosis Studies in SLE: Derivation of the SLEDAI for Lupus Patients. Arthritis Rheum 35:630-640, 1992.).
[0049] The diagnostic genes of this invention include sequences corresponding those provided by the accession numbers and Unigene numbers provided in Table 1 and 2. The 60- mer sequences provided in the Tables are unique identifiers for the diagnostic genes of this invention. Therefore, the diagnostic genes of this invention also include sequences containing the 60-mer sequence provided in the Tables. In other words, the diagnostic genes may be partially or totally contained in (or derived from) the full-length gene sequences referenced in Tables 1 and 2.
[0050] In certain embodiments, the diagnostic genes of this invention include any sequences whose expression correlates with the expression of all genes which correlate with IFI27, such as the sequences provided by the accession numbers and Unigene numbers provided in Table 2.
[0051] Homologs and variants of the nucleic acid molecules in Table 1 and Table 2 may also be part of the diagnostic gene set. Homologs and variants of these nucleic acid molecules
will possess a relatively high degree of sequence identity when aligned using standard methods. The sequences encompassed by the invention have at least 40-50, 50-60, 70-80, 80- 85, 85-90, 90-95, or 95-100% sequence identity to the sequences disclosed herein. [0052] The diagnostic gene set may also include other genes that are coexpressed with the correlated sequence or full-length gene. Genes may share expression patterns because they are regulated in the same molecular pathway or in the same cell type. Because of the similarity of expression behavior, these genes are identified as surrogates in that they can substitute for a diagnostic gene in a diagnostic gene set.
[0053] In some embodiments, diagnostic genes of the invention are used as a diagnostic gene set in combination with genes that are known to be associated with a disease state ("known markers"). The use of the diagnostic genes in combination with the known markers can provide information that is not obtainable through the known markers alone.
Gene Clusters
[0054] In some embodiments, the diagnostic genes of this invention are segregrated into "clusters". In preferred embodiments the diagnostic genes of this invention are sorted into clusters as indicated in Table 1 and diagnostic gene sets of this invention include at least one gene from each of at least two of gene clusters 1 through 15.
[0055] As used herein the term "gene cluster" or "cluster" refers to a group of genes related by expression pattern. In other words, a cluster of genes is a group of genes with similar regulation across different conditions, such as a patient having SLE or a patient without SLE. The expression profile for each gene in a cluster should be correlated with the expression profile of at least one other gene in that cluster. Correlation may be evaluated using a variety of statistical methods.
[0056] As used herein the term "surrogate" refers to a gene with an expression profile such that is so highly correlated with gene expression of another gene that it can substitute for a diagnostic gene in a diagnostic assay. Such genes are typically members of the same gene cluster as the diagnostic gene. For each member of a diagnostic gene set, a set of potential surrogates can be identified through identification of genes with similar expression patterns as
described below.
[0057] Many statistical analyses produce a correlation coefficient to describe the relatedness between two gene expression patterns. Patterns may be considered correlated if the correlation coefficient is greater than or equal to 0.8. In preferred embodiments, the correlation coefficient should be greater than 0.85, 0.9 or 0.95. Other statistical methods produce a measure of mutual information to describe the relatedness between two gene expression patterns. Patterns may be considered correlated if the normalized mutual information value is greater than or equal to 0.7. In preferred embodiments, the normalized mutual information value should be greater than 0.8, 0.9 or 0.95. Patterns may also be considered similar if they cluster closely upon hierarchical clustering of gene expression data (Eisen et al. 1998). Similar patterns may be those genes that are among the 1 , 2, 5, 10, 20, 50 or 100 nearest neighbors in a hierarchical clustering or have a similarity score (Eisen et al. 1998) of >0.5, 0.7, 0.8, 0.9, 0.95 or 0.99. Similar patterns may also be identified as those genes found to be surrogates in a classification tree by CART (Breiman et al. 1994). [0058] Often, but not always, members of a gene cluster have similar biological functions in addition to similar gene expression patterns. For example, all genes in a particular cluster may be associated with a particular biological pathway or cell type. Representative cell types associated with diagnostic genes of this invention include granulocytes, NK cells, red blood cells, and platelets. Is is expected that the expression pattern of other genes in the same pathway or cell type will also be part of the same cluster and may be useful as surrogates. [0059] Correlated genes, clusters and surrogates are all useful as diagnostic genes of the invention. These surrogates may be used as diagnostic genes in an assay instead of, or in addition to, the diagnostic genes for which they are surrogates.
[0060] Clusters also provide a means to ensure that the diagnostic gene sets do not contain redundant information. Diagnostic gene sets of the invention therefore preferably include genes from different clusters. For example, diagnostic gene sets of the invention preferably include at least one gene from at least two gene clusters.
Primer and Probe Sets
[0061] The invention further provides methods for producing diagnostic primer sets or probe sets. It is understood that a probe includes any reagent capable of specifically identifying genes in diagnostic setss, and include but are not limited to DNA, RNA, cDNA, splice variants, primers, probe sets, peptide nucleic acids, locked nucleic acids, amplicons, synthetic oligonucleotide, and partial or full-length nucleic acid sequences. In addition, the probe may identify the protein product of a diagnostic gene, and include, for example, antibodies and other affinity reagents. In some applications, a probe set may include one or more oligonucleotide that detects the expression of one or more of the selected genes for the diagnostic set.
[0062] It is also understood that each probe can correspond to one gene, or multiple probes can correspond to one gene, or both, or one probe can correspond to more than one gene. [0063] In some embodiments, a diagnostic probe set is immobilized on an array. The array may be a chip array, a plate array, a bead array, a pin array, a membrane array, a solid surface array, a liquid array, an oligonucleotide array, a polynucleotide array or a cDNA array, a microtiter plate, a pin array, a bead array, a membrane or a chip.
Obtaining DNA, RNA and Protein Samples for Detection of Expression
[0064] Gene expression can be evaluated at the level of DNA, or RNA or protein products. A variety of techniques are available for the isolation of DNA, RNA and protein from bodily fluids.
[0065] A variety of techniques are available for the isolation of RNA from samples. Any technique that allows isolation of mRNA from cells (in the presence or absence of rRNA and iRNA) can be utilized. For example, by means of aspiration of body fluid, biopsy of a tissue or organ, drawing of peripheral blood, endoscopy, and lavage followed by aspiration, RNA can be isolated from ascites, bile, blood, cerebronspinal fluid, lymph, sputum, and/or urine. By the same methods, RNA can also be isolated from the central nervous system, joints, kidneys, liver, lungs, oral cavity, sinuses, skin, and vasculature.
Methods for Obtaining Expression Data
[0066] Numerous methods for obtaining expression data are known, and any one or more of these techniques, singly or in combination, are suitable for detecting expression in the context of the present invention.
[0067] For example, expression patterns can be evaluated by northern analysis, PCR, RT- PCR, Taq Man analysis, FRET detection, monitoring one or more molecular beacons, hybridization to an oligonucleotide array, hybridization to a cDNA array, hybridization to a polynucleotide array, hybridization to a liquid microarray, hybridization to a microelectric array, cDNA sequencing, clone hybridization, cDNA fragment fingerprinting, serial analysis of gene expression (SAGE), subtractive hybridization, differential display and/or differential screening (see, e.g., Lockhart and Winzeler (2000) Nature 405:827-836, and references cited therein). Oligonucleotide hybridization may occur in solution or on substrates including, but not limited to magnetic or nonmagnetic beads, chips, fibers, filters, gels, membranes, microparticles, plates, polymers, slides, capillary tubing, and wafers with surface features selected from channels, columns, pins, pores, trenches, and wells. [0068] It is understood that for detection of gene expression, variations in the disclosed sequences will still permit detection of gene expression. The degree of sequence identity required to detect gene expression varies depending on the length of the oligomer. For a 60 mer, 6-8 random mutations or 6-8 random deletions in a 60 mer do not affect gene expression detection. Hughes, T R, et al. "Expression profiling using microarrays fabricated by an ink-jet oligonucleotide synthesizer. Nature Biotechnology, 19:343-347(2001). As the length of the DNA sequence is increased, the number of mutations or deletions permitted while still allowing the detection of gene expression is increased.
[0069] Alternatively, expression at the level of protein products of gene expression can be performed. For example, protein expression in a disease patient can be evaluated by one or more methods including, but not limited to Western analysis, two-dimensional gel analysis, chromatographic separation, mass spectrometric detection, protein-fusion reporter constructs, colorimetric assays, binding to a protein array and characterization of polysomal mRNA. One particularly favored approach involves binding of labeled protein expression products to an array of antibodies specific for members of the candidate library. Methods for producing and
evaluating antibodies are widespread in the art, see, e.g., Coligan, supra; and Harlow and Lane (1989) Antibodies: A Laboratory Manual, Cold Spring Harbor Press, NY ("Harlow and Lane"). Additional details regarding a variety of immunological and immunoassay procedures adaptable to the present invention by selection of antibody reagents specific for the products of candidate nucleotide sequences can be found in, e.g., Stites and Terr (eds.)(1991) Basic and Clinical Immunology, 7.sup.th ed., and Paul, supra. Another approach uses systems for performing desorption spectrometry. Commercially available systems, e.g., from Ciphergen Biosystems, Inc. (Fremont, Calif.) are particularly well suited to quantitative analysis of protein expression. Indeed, Protein Chip.RTM. arrays (see, e.g., the website, ciphergen.com) used in desorption spectrometry approaches provide arrays for detection of protein expression. Alternatively, affinity reagents (e.g., antibodies, small molecules, etc.) are developed that recognize epitopes of the protein product. Affinity assays are used in protein array assays, e.g. to detect the presence or absence of particular proteins. Alternatively, affinity reagents are used to detect expression using the methods described above. In the case of a protein that is expressed on the cell surface of leukocytes, labeled affinity reagents are bound to populations of leukocytes, and leukocytes expressing the protein are identified and counted using fluorescent activated cell sorting (FACS). Expression Profiles
[0070] Expression patterns, or profiles, of a plurality of genes corresponding to members of the diagnostic set are evaluated in one or more SLE patients. These expression patterns constitute a set of relative or absolute expression values for some number of RNA or protein products corresponding to the plurality of genes evaluated, which is referred to herein as the subject's "expression profile" for those genes. While expression patterns for as few as one independent member of the diagnostic set can be obtained, it is generally preferable to obtain expression patterns corresponding to a larger number of genes, e.g., about 2, about 5, about 10, about 20, about 50, about 100, about 200, about 500, or about 1000, or more. The expression pattern for each differentially expressed component member of the set provides a finite specificity and sensitivity with respect to predictive value, e.g., for diagnosis, prognosis, monitoring, and the like.
Evaluation of Expression Data and ProΩIes
[0071] Expression profiles can be evaluated by qualitative and/or quantitative measures. Certain techniques for evaluating gene expression (as RNA or protein products) yield data that are predominantly qualitative in nature. That is, the methods detect differences in expression that classify expression into distinct modes without providing significant information regarding quantitative aspects of expression. For example, a technique can be described as a qualitative technique if it detects the presence or absence of expression of a diagnostic nucleotide sequence, i.e., an on/off pattern of expression. Alternatively, a qualitative technique measures the presence (and/or absence) of different alleles, or variants, of a gene product.
[0072] In contrast, some methods provide data that characterizes expression in a quantitative manner. That is, the methods relate expression on a numerical scale. It will be understood that the numerical, and symbolic examples provided are arbitrary, and that any graduated scale (or any symbolic representation of a graduated scale) can be employed in the context of the present invention to describe quantitative differences in nucleotide sequence expression. Typically, such methods yield information corresponding to a relative increase or decrease in expression.
[0073] Any method that yields either quantitative or qualitative expression data is suitable for evaluating expression of diagnostic nucleotide sequence in a SLE subject or patient. In some cases, e.g., when multiple methods are employed to determine expression patterns for a plurality of diagnostic nucleotide sequences, the recovered data, e.g., the expression profile for the nucleotide sequences is a combination of quantitative and qualitative data. [0074] In some applications, expression of the plurality of diagnostic nucleotide sequences is evaluated sequentially. This is typically the case for methods that can be characterized as low- to moderate-throughput. In contrast, as the throughput of the elected assay increases, expression for the plurality of diagnostic nucleotide sequences in a sample or multiple samples of SLE subjects or patients is assayed simultaneously. Again, the methods (and throughput) are largely determined by the individual practitioner, although, typically, it is preferable to employ methods that permit rapid, e.g. automated or partially automated,
preparation and detection, on a scale that is time-efficient and cost-effective. [0075] In one some embodiments, once expression levels for a diagnostic set of genes are determined, a diagnostic classifier (a mathematical function that assigns samples to diagnostic categories based on expression data) is applied to unknown sample expression levels in order to diagnose or monitor the status of the SLE in a subject or patient. [0076] The diagnostic classifier is typically derived from a prediction algorithm derived from statistical methods including, but not limited to, analysis of variance, classification algorithms, classification and regression trees, Fisher's Exact Test, linear algorithm, linear discriminatory analysis, linear regression, logistic algorithm, multiple regression, nearest shrunken centroids classifier, Pearson correlation, prediction algorithm, significance analysis of microarrays, one-tailed T-test, two tailed T-tests, voting algorithm, Wilcoxon's signed ranks test and the like.
Expression Reference Standards
[0077] In other embodiments, comparison of patient gene expression with reference profiles is used to evaluate expression data and to monitor the status of SLE, to predict flare, and to assess treatment efficacy.
[0078] For example, expression profiles derived from a patient (i.e., subjects diagnosed with, or exhibiting symptoms of, or exhibiting a disease criterion, or under a doctor's care for a disease) sample are compared to a control or standard expression RNA to facilitate comparison of expression profiles (e.g. of a set of candidate nucleotide sequences) from a group of patients relative to each other (i.e., from one patient in the group to other patients in the group, or to patients in another group).
[0079] The reference RNA used should have desirable features of low cost and simplicity of production on a large scale. Additionally, the reference RNA should contain measurable amounts of as many of the genes of the candidate library as possible.
[0080] For example, in one approach to identifying diagnostic gene sets and evaluating expression data, expression profiles derived from patient samples are compared to an expression reference "standard." Standard expression reference can be derived from samples
from at least one normal subject and from at least one patient diagnosed with SLE and include but are not limited to a gene expression from one or more patients with quiescent type 1 SLE, from one or more patients with quiescent type 2 SLE, from one or more patients with type 1 SLE showing increased disease activity or flare, from one or more patients with type 2 SLE showing increased disease activity or flare, from one or more patients with type 1 SLE that had been treated with an immunosuppressant, from one or more patients with type 2 SLE that had been treated with an immunosuppressant, from one or more patients with type 1 SLE that had been treated with a therapeutic agent, and from one or more patients with type 2 SLE that had been treated with a therapeutic agent..
[0081] Use of an expression reference standard is particularly useful when the expression of large numbers of nucleotide sequences is assayed, e.g. in an array, and in certain other applications, e.g. qualitative PCR, RT-PCR, etc., where it is desirable to compare a sample profile to a standard profile, and/or when large numbers of expression profiles, e.g. a patient population, are to be compared. Generally, an expression reference standard should be available in large quantities, should be a good substrate for amplification and labeling reactions, and should be capable of detecting a large percentage of candidate nucleic acids using suitable expression profiling technology.
[0082] Alternatively, the expression reference standard can be derived from any subject or class of subjects including healthy subjects or subjects diagnosed with the same or a different disease or disease criterion. Expression profiles from subjects in two distinct classes are compared to determine which subset of genes in the diagnostic set best distinguish between the two subject classes. It will be appreciated that in the present context, the term "distinct classes" is relevant to at least one distinguishable criterion relevant to a disease of interest, a "disease criterion." The classes can, of course, demonstrate significant overlap (or identity) with respect to other disease criteria, or with respect to disease diagnoses, prognoses, or the like. The mode of discovery involves, e.g., comparing the molecular signature of different subject classes to each other (such as patient to control, patients with a first diagnosis to patients with a second diagnosis, etc.) or by comparing the molecular signatures of a single individual taken at different time points. The invention can be applied to a broad range of
diseases, disease criteria, conditions and other clinical and/or epidemiological questions, as further discussed above/below.
[0083] In some applications, when a single patient sample is obtained, it may still be desirable to compare the expression profile of that sample to some reference expression profile. In this case, one can determine the change of expression between the patient's sample and a reference expression profile that is appropriate for that patient and the medical condition in question. For example, a reference expression profile can be determined for all patients without the disease criterion in question who have similar characteristics, such as age, sex, race, diagnoses, etc.
Classification of SLE Patients into Longitudinally Stable Classes of SLE
[0084] In some embodiments, the invention provides methods for diagnosis of a patient as having a longitudinally stable classification of SLE by detecting the expression of genes whose expression correlates with the expression of IFI27. In some embodiments, the method is practiced as part of a method to diagnose or monitor the status of SLE in a patient. [0085] In preferred embodiments, a subject is classified into one of at least two classes of SLE by detecting the expression of at least two genes whose expression corrrelates with the expression of IFI27 from about 0.5 to about 1.0 and from about -0.5 to about -1.0 caclulated using Pearson correlation and classifying the subject as having type I or type II SLE based on the expression of these two genes. In preferred embodiments, the genes are provided in Table 2. Pharmacogenomics
[0086] Pharmocogenomics is the study of the individual propensity to respond to a particular drug therapy (combination of therapies). In this context, response can mean whether a particular drug will work on a particular patient, e.g. some patients respond to one drug but not to another drug. Response can also refer to the likelihood of successful treatment or the assessment of progress in treatment. Titration of drug therapy to a particular patient is also included in this description, e.g. different patients can respond to different doses of a given
medication. This aspect may be important when drugs with side-effects or interactions with other drug therapies are contemplated.
[0087] Diagnostic gene sets are developed and validated for use in assessing whether a patient will respond to a particular therapy and/or monitoring response of a patient to drug therapy (therapies). Disease criteria correspond to presence or absence of clinical symptoms or clinical endpoints, presence of side-effects or interaction with other drug(s). The diagnostic nucleotide set may further include nucleotide sequences that are targets of drug treatment or markers of active disease.
[0088] Example 1 describes the SLE patients, criteria for their diagnosis, and collection and characterization of blood and tissue samples from normal subjects and patients in periods of quiescence and flare. Although analyses determined that expression profiles contained a subset of genes, designated interferon response genes (INFr), whose expression generally correlated with disease severity, but not with change in patient status from quiescence to flare. Based on this fact, subject and patient samples can be queried for expression of the subset of INFr genes.
[0089] Example 2 describes the analysis of gene expression in samples from SLE patients. Pearson correlation was used to identify 15 different, pathway or cell-type specific, gene clusters that were differentially expressed in patient samples during periods of disease quiescence versus periods when that patient was converting from quiescence to flare. These clusters are also shown and described in Table 1. Column 1 shows the number of the cluster; column 2, the array ID; column 3, the GenBank ID; column 4, the gene ID; and column 5, a short description of the gene.
[0090] To diagnose and monitor the status of a subject or patient, a sample from the subject or patient is analyzed for differential expression of at least one gene selected from each of at least two different gene clusters shown in Table 1. Comparison of patient gene expression with reference profiles can also serve to monitor the status of SLE, to predict flare, and to assess treatment efficacy.
[0091] Prediction algorithms were developed using gene expression representing quiescent
(QQ) versus flare (QF) samples. Multiple regression analysis was used to associate gene expression with flare, and linear regression was used to examine individual genes. In general, prediction algorithms were trained using 90% of the samples; and cross-validated, using 10% of samples in 100 iterations as explained in Example 3. Prediction algorithms can be also used to assess patient prognosis— presence or likelihood of developing premature carotid atherosclerosis or progressing to end-stage organ damage— and to monitor treatment of SLE patients. Of particular interest are samples and expression profiles from patients who responded to a given steroid or immunosuppressant treatment regime versus samples or profiles from those same patients where the medication stopped working or from different patients who did not respond or were resistant to a specific medication or treatment regime.
[0092] Gene expression was analyzed using at least one statistical method selected from analysis of variance, classification algorithms, classification and regression trees, Fisher's Exact Test, linear algorithm, linear discriminatory analysis, linear regression, logistic algorithm, multiple regression, nearest shrunken centroids classifier, Pearson correlation, prediction algorithm, significance analysis of microarrays, one-tailed T-tests, two-tailed T- tests, voting algorithm, Wilcoxon's signed ranks test and the like. One or more of these methods were used to process and evaluate the normal and patient samples and to choose those samples used as reference profiles.
[0093] Example 4 describes the classification of SLE patients into type 1 SLE and type 2 SLE is based on IFNr score. A linear algorithm was used in the analysis of the expression of at least two INFr genes selected from Table 2. Expression of IFI27 was chosen as the basis to which all of other genes expressed in SLE were compared, and Table 2 shows the 190 features (probes on a microarray) that represent those INFr genes positively correlated with IFI27 (cutoff of > 0.5 or <-0.5 using Pearson correlation). Column 1 of Table 2 shows the feature ID on the Human Genome CGH 44A microarrays (Agilent Technologies, Palo Alto CA) array; column 2, the name of probe; column 3, symbol or identifier for the gene; column 5, description of the gene; and column 6, correlation with IFI27. For purposes of demonstration, IFI27 and the two other INFr genes highlighted in Table 2 were used to develop an exemplary
algorithm, IFI27 + IFI144*(1.1296) + OAS3* (1.8136), that can be used to produce an INFr score.
[0094] The analysis and validation of data from paired, longitudinal samples as described in Example 4 are summarized in Table 3. Exemplary data is shown for the first 25 of 81 patients. The data shows lack of correlation with SLEDAI and the stability of IFNr score in individual patients during periods of quiescence and flare. Regardless of disease activity or flare, a high INFr score classified a patient as having type 1 SLE, a condition characterized by more severe SLE symptoms such as increased organ involvement and dysfunction, low complement levels, and high titer of anti -double-stranded DNA (dsDNA) antibodies; and a low INFr score classified a patient as having type 2 SLE which is generally characterized by less severe symptoms. It is contemplated that many combinations of at least two INFr genes and algorithms developed using them can be used to classify SLE patients.
[0095] Examples 5-8 describe how normal and patient samples were purified and handled. Examples 9-1 1 describe the nucleic acid technologies (microarray and polymerase chain reaction) used to detect gene expression and produce gene expression patient and reference profiles.
[0096] Methods are presented for screening subjects for SLE, for classifying a patient already diagnosed with SLE as having type 1 SLE or type 2 SLE, for predicting disease activity or flare, for selecting an effective immunosuppressant and/or therapeutic agent for treatment of SLE, and for identifying subjects with SLE from subjects with other rheumatic diseases.
[0097] Useful reference profiles were derived from samples from at least one normal subject and from at least one patient diagnosed with SLE and include but are not limited to a gene expression from one or more patients with quiescent type 1 SLE, from one or more patients with quiescent type 2 SLE, from one or more patients with type 1 SLE showing increased disease activity or flare, from one or more patients with type 2 SLE showing increased disease activity or flare, from one or more patients with type 1 SLE that had been treated with an immunosuppressant, from one or more patients with type 2 SLE that had been
treated with an immunosuppressant, from one or more patients with type 1 SLE that had been treated with a therapeutic agent, and from one or more patients with type 2 SLE that had been treated with a therapeutic agent.
[0098] Reagents used to establish a gene expression profile include but are not limited to: 1) genes and their splice variants, primers, probe sets, peptide nucleic acids, locked nucleic acids and amplicons that can be used in nucleic acid technologies including but not limited to hybridization on arrays and amplification using quantitative RT-PCR; and 2) proteins and their fragments, antibodies, and affinity reagents that can be used in protein technologies including but not limited to protein or antibody arrays and enzyme-linked immunosorbent assays (ELISAs). These reagents can be used in assays or diagnostic kits to screen subjects for SLE.
[0099] Assays or diagnostic kits based on the primers and probe sets as described in Example 9 can be used with a sample from a subject with symptoms of a rheumatic disease to diagnose, classify or rule out SLE; and with a sample from a patient diagnosed with type 1 SLE or type 2 SLE to select a clinical trial, to predict flare, to detect immunosuppressant responsiveness, to determine efficacy of a therapeutic agent, to design treatment regimes, to monitor the status of the patient or treatment regime. In one alternative, the diagnostic kit includes an array of nucleic acid molecules or antibodies; in another, the diagnostic kit includes probe sets for use in quantitative RT-PCR.
[0100] Pharmacogenomics is the study of an individual's response to a particular therapeutic agent, immunosuppressant or combinations of agents. In this context, response refers to whether a particular agent or drug will work better for a particular type 1 SLE or type 2 SLE patient. The methods disclosed provide for assigning a patient to a clinical trial based on classification as type 1 SLE or type 2 SLE and disease status (quiescent or flare).
[0101] Pharmacogenomics is also important in determining the dosage of a therapeutic agent based on classification and disease status of the patient. It is contemplated that a patient diagnosed with type 1 SLE will respond differently to a particular immunosuppressant or therapeutic agent than a patient diagnosed with type 2 SLE. Individual response must also be
taken into account relative to the side-effects or interactions of various immunosuppressant or therapeutic agents. Some potentially useful therapeutic agents and immunosuppressants are listed in the definitions and claims.
[0102] The present invention contains many preferred embodiments and includes material from patents, patent applications and other publications incorporated by reference in their entirety for all purposes, but especially for details in practicing the invention and known to those in the art.
EXAMPLES Example 1 Characterization of Patients and Samples
[0103] Patients who met the American College of Rheumatology (ACR) criteria for the diagnosis of SLE (malar rash, discoid rash, photosensitivity, oral ulcers, arthritis, serositis, renal disorder, neurologic disorder, hematologic disorder, immunologic disorder, and antinuclear antibody) were identified (cf. Tan et al (1982) Arthritis Rheum 25:1271-7). After institutional review and approval, patients gave informed consent and were included in the Lupus Disease Activity Monitoring and Risk Stratification Archive Discovery Microarray Study. The samples and clinical data were available via the Autoimmune Biomarkers Collaborative Network (ABCoN).
[0104] Blood and/or tissue samples and clinical data have been collected from patients managed at Johns Hopkins Medical Center (JHMC) within the Hopkins Lupus Cohort. In this cohort, all SLE patients have been followed according to protocol with visits at a minimum of every 3 months. The table below has self-explanatory columns that show demographic information for the patients in the SLE cohort.
Number (% of total
Age at Entry into cohort (yrs) cohort)
< 30 304 (32%)
30 to 49 51 1 (53%)
50 + 148 (15%)
Female 888 (92%)
Race
White 529 (55%)
Black 403 (42%)
Other 31 ( 3%)
Education
< 12 vrs 124 (14%)
Hieh School 281 (31%)
Some College 497 (55%)
Years in cohort
0 191 (19%)
1 to 3 409 (41%)
4 + 391 (40%)
Number of cohort visits
1 78 ( 8%)
2 to 8 320 (32%)
9 to 44 492 (50%)
45 + 101 (10%)
Years with SLE Drior to cohort entrv
0 304 (31%)
1 to 4 325 (33%)
5+ 362 (36%)
[0105] As seen above, the cohort was more or less racially balanced, and its individuals represented a broad socioeconomic spectrum. The patient samples and clinical data used in this investigation were from SLE patients who had been in the cohort for more than one year. In total, these patients visited the clinic 1782 times (an average of 5.9 quarterly visits for each patient). In the alternative, samples for training and validating prediction algorithms were obtained from the Autoimmune Disease Registry of the Hospital for Special Surgery (HSS; New York City NY).
[0106] Clinical data were examined for each patient in order to select samples for use in training or validation studies. Whereas additional samples can be added to the training set, a completely unique set must be used for validation. Both clinical and existing expression data were analyzed for 81 of the first 100 patients in the cohort and a subset of these patients was used for the training study. For the training study, the following classes of samples (Q=quiescent, F=flare) were defined as follows:
QFl: primary QF quiescent sample that proceeds to flare within 150 days No prior flare within 60 day 1 primary pair per patient only SLEDAl > 4 QF4: second QFl
A second, unique QFl iF from the same patient
QF4 precedes a distinct F from the QFl
Can be combined with QFl for analysis QF5: earliest baseline additional, earlier QF for a given QFl IF F: high current disease activity
SLEDAI increases > 4 from previous visit
PGA (Physician's Global Assessment) = rating of disease activity as high or increasing QQ: primary quiescent and stable
SLEDAI < 4 and no flares in next 150 days or more
Sample Characteristics
[0107] The table below shows the comparison between the various classes. Column one lists the QF, F and QQ classes as defined above; column two, the groups within the class; column three, the number of patients in the class or group; column four, the average (avg) days (da) to flare; column five, the median days to flare; column six, the average (avg) increase in SLEDAI; column seven, the median (med) increase in SLEDAI; column eight, the average increase in SLEDAI at flare; and column nine, the number of visits prior to flare.
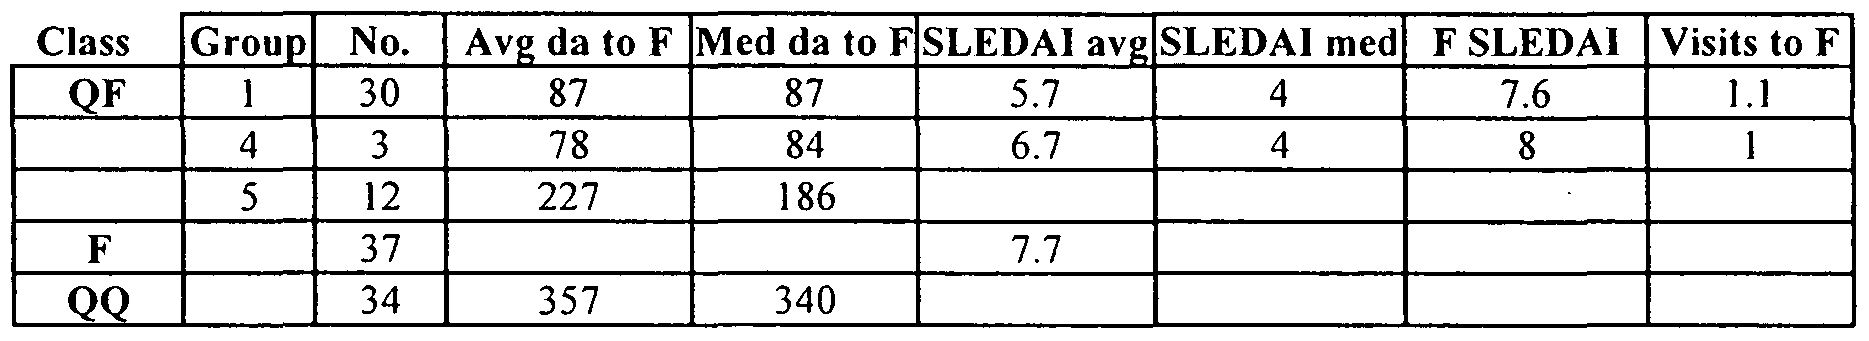
Sample Matching
[0108] One of the most important class comparisons was QQ vs. QF. Molecular characterization of the samples that do not progress in disease activity or proceed to flare were particularly important for assessing risk and efficacy of treatment regime, determining prognosis, and the like. A typical subset of patients was characterized in the table below. In that the patients have similar clinical data, their samples showed that observed difference in class was due to activation at the molecular level (measured by gene expression) and not due
to observable differences. Column one shows class or T-test; column two, number of patients (No), column three, physician's global assessment (PGA); column four, SLEDAI score, column five, prednisone treatment (Pred); column six, percent of patients on immunosuppressant treatment (Immuno); column seven, percent of patients on intravenous treatment (IVS); and column seven, percent of the patients who are female.

[0109] Although none of the clinical variables was statistically significant between classes, there was a slight trend towards more severe disease in the QF group. It must be noted that this trend was not clinically relevant; and as samples are added to the study, it is expected that even this slight trend will disappear.
[0110] The normal control sample was a pooled blood sample taken from equal numbers of male and female Expression Genetics employees. These donors were healthy at the time the sample was collected, and none had obvious disease symptoms or diagnosis of SLE or any other rheumatic disease.
Example 2 Analyses of Gene Expression Profiles of SLE Patients Proceeding to Flare.
[0111] The basis for diagnosing and monitoring the status of SLE in patients involved detecting differential gene expression between quiescence (QQ) and flare (QF) samples. K- means clustering of gene using GeneSpring GX 7.3 were done with the following criteria Number of clusters 15, Number of iterations 200, Similarity Measure Pearson Correlation and genes in which half of the samples did not have data were not used. Genes shown in Table 1 were defined as those with a p-value < 0.05 and a fold change > 1.2. The genes were
clustered to group genes which represented a particular pathway or cell type. The table below shows the number of the cluster as presented in Table 1, the average Radius between the clusters and an all clusters average. Average Radius is calculated by the root mean square of the Euclidean distances between each gene and the centroid.
Cluster No Cell Type Average Radius
1 Granulocytes & B cells 5.15
2 NK cells 6.02
3 Granulocytes 7.23
4 Granulocytes 6.82
5 Platelet 6.31
6 All Cell Types 6.32
7 B cells 4.39
8 All Cell Types 6.85
9 B cells 5.88
10 All Cell Types 8.81
1 1 All Cell Types 8.34
12 All Cell Types 3.67
13 Red Blood Cells 6.87
14 Red Blood Cells 4.98
15 All Cell Types 2.19
All Clusters Ave 5.99
[0112] The genes shown in Table 1 were used with the statistical methods described below to diagnose and monitor the status of SLE patients, to predict flare and to assess treatment efficacy.
[0113] The various analyses were carried out using classification and prediction algorithms, software and programs including, but not limited to, analysis of variance, classification and regression trees (Brieman et al. (1984) Classification and Regression Trees, Wadsworth, Belmont CA), linear discriminatory analysis (Statsoft, Tulsa OK), multiple additive regression trees (Friedman (2002) Stanford University, Stanford CA), nearest shrunken centroids classifier (Tibshirani et al. (2002) PNAS 99:6567-6572), significance analysis of microarrays (Tusher et al. (2001) PNAS 98:51 16-5121), one and two tailed T-tests, Wilcoxon's signed ranks test, and the like. The statistical analyses applied to both array and PCR expression data were also described in the Detailed Description of the Invention and in Example 5 of USPN 6,905,827 incorporated by reference herein in its entirety.
[0114] In addition to expression data, any piece of clinical data collected from patients can
be used in a correlation or classification analysis. Continuous variables including but not limited to albumin, autoantibodies, hemoglobin or other measures of organ function that contribute to SLEDAI score can be used for correlation analysis. In some cases, the logarithm of the values was used for the analysis. When these variables were included in the analysis, they were treated as another "gene". For example, samples from kidney biopsies can be used to divide SLE patients into groups with or without renal disease. From the analyses of clinical manifestations carried out in this study and differences in clinical manifestations reported by others, it is contemplated that categorical variables such gender, ethnicity and socioeconomic status can also contribute to classification, prediction of flare, and selection or modulation of effective therapeutics.
Example 3 Prediction Algorithms
[0115] After all the expression and clinical data were placed in a relational database, these data were used to build prediction algorithms. The prediction algorithms were applied to gene expression profiles from SLE patients converting from quiescence to flare to identify sets of differentially expressed genes for monitoring the status of SLE, specifically for predicting flare or disease activity and effective treatment regimes.
[0116] Once a set of genes and expression criteria for those genes have been established for classification, cross-validation was done. Validation of the algorithm by these means yielded an estimate of the predictive value of the algorithm on the target population. For example, a 10-fold cross-validation analysis excluded 10% of the training samples from the analysis, and the classification algorithm was built with the remaining 90%. The 10% of the samples that were initially excluded were then used as a test set for the algorithm. The process was repeated 10 times with 10% of the samples being used as a test set each time. Through this analysis, it was possible to derive a cross-validation error which helped estimate the robustness of the algorithm for use on previously untested samples (i.e., samples that were not included in the training analysis). Untested samples came from the JHMC or HSS archives. In the alternative, the samples can come from a new clinical study.
Example 4 Classification of Patients as Type 1 SLE and Type 2 SLE
[0117] Another step toward better monitoring the status of SLE patients was to classify them as having either type 1 SLE or type 2 SLE. A number of comparisons of data in the relational database were made and validated as described below.
Gene Expression Patterns
[0118] One of the comparisons of gene expression patterns was to analyze genes that were differentially expressed between paired QFl and F samples from the same patient taken from about two to about six months apart. The first sample was from a time period when the patient's disease activity was low (SLEDAI 0-4), but the second sample from the same patient showed increased disease activity and a SLEDAI > 4. In this process, examination of some of the genes known to be expressed in inflammation or immune disorders showed nearly parallel expression patterns in paired quiescent/flare (QF) and flare (F) patient. The expression of one of those genes, IFI27, is shown in Figure 1.
[0119] The x-axis of Figure 1 represents patient number and the y-axis, the Logio expression ratio for IFI27. Figure 1 demonstrates that IFI27 was not differentially expressed according to disease activity or flare. Further examination of longitudinal data showed that expression of INFr genes placed SLE patients into at least two different groups.
INFr score
[0120] The relational database of SLE data was searched for genes whose expression correlated with IFI27 > 0.5 or <-0.5 using Pearson correlation; these designated INFr genes are listed in Table 2. Longitudinal data from an initial group of 81 patients covering a period of up to two years (including extra time points available in the QF4 and QF5 classes) was used to examine IFNr gene expression.
[0121] Although many different algorithms were contemplated, one exemplary algorithm was developed to demonstrate how to use three INFr genes to calculate an IFNr score. The genes that encode IFI27, IFI44 and OAS3, highlighted in Table 2, were used to develop the algorithm. The INFr score based on these three genes reflects the Logio ratio of patient sample expression over reference sample expression on the microarray after normalization
using Feature Extraction v 7.5 software (Agilent Technologies). The standard deviation for each gene was normalized so that each of the genes would have the same influence on IFNr score. The exemplary algorithm is: IFI27 + IFI144*(1.1296) + OAS3*( 1.8136).
[0122] The genes used to derive INFr score are described as follows: 1) IFI27 (also known as ISG12 and p27) maps to chromosome 14q32, the location of the serine protease inhibitor gene cluster. IFI27 is induced by alpha interferon and localizes to the nuclear membrane. Since IFI27 is expressed in breast, head and neck carcinomas, it has been used to predict patient sensitivity to cisplatin and paclitaxel; 2) IFI44 (also known as MTAP44) is induced by α and β interferons, but not by γ interferon and aggregates to form microtubular-like structures in hepatitus-C infected cells; and 3) OAS3 maps to chromosome 12q24.2 and is an interferon-induced protein that catalyzes the synthesis of 2'-5' oligomers of adenosine.
[0123] Table 3 presents longitudinal data for patients with SLE. Column one shows patient number; column two, ABCoN ID followed by sample number; column three, sample designated as quiescent (QF) or flare (F); column four, date sample taken; column five, SLEDAI score; column six, IFNr score (high or low); column seven, days from first sample; and INFr score. The cutoff for distinguishing between high IFNr and low IFNr scores was the average of all INFr scores. Table 3 demonstrated: 1) longitudinal stability of INFr score in an individual over time, 2) the existence of at least two types of SLE as defined by high and low expression of IFNr genes, and 3) lack of correlation between SLEDAI and IFNr scores as shown for patients 2, 4, 6, 9, and 15.
[0124] The change from high to low INFr score or from high to low to high INFr score as seen in the data for patients 10 and 13, respectively, were further analyzed. A Fisher's Exact Test was used to calculate a p-value for hypothesized random discordant results. The conversion of one high to low and one low to high produced the p-value = 0.000034 that the events happened at random.
[0125] Another way to look at IFNr score was to compare normal control and first visit patient samples. In Figure 2, all samples were sorted low to high and plotted according to INFr score. The normal subjects are presented on the left side of the graph, and the 81 SLE
(lupus) patients are presented on the right.
[0126] The x-axis shows the number assigned each normal subject or SLE patient, and the y-axis shows INFr score where the scale is fold. As shown on this graph, INFr scores varied by as much as 500-fold. Although they appeared healthy at the time of sampling, three of the normal subjects had slightly elevated IFNr scores that were attributed to infection, allergies, or other sub-acute, non-SLE conditions.
[0127] Since the INFr scores of the SLE patients appeared as a continuous slope in the graph above, the data was parsed. The graph for IFI27, IFI44, and OAS3 (Figure 3) clearly showed the bimodal distribution of SLE patients (type 2 SLE to the left of zero and type 1 SLE to the right, on the x-axis) when number of samples was graphed against log10 of the expression ratio.
[0128] Similar graphs or histograms can be plotted for any of the other INFr genes shown in Table 2, and any of these INFr genes can be used to develop an algorithm to classify SLE patients as type 1 SLE or type 2 SLE.
[0129] In further support of the stability of type 1 and type 2 SLE classification, a Fisher's Exact Test was applied to the hypothesis, "Do the highs stay high and the lows stay low?" The data presented in the table below produces a p-value = 8.0 Ie- 13 that further demonstrates the validity of the bimodal distribution and the presence of at least two groups, type 1 SLE and type 2 SLE.

[0130] Although SLEDAI scores are on average higher in type 1 SLE patients (who generally show more severe symptoms), SLEDAI did not correlate with high or low INFr score. The clinical manifestations that did associate with type 1 SLE included low serum complement levels, high anti-double stranded DNA antibodies, and more renal disease.
Example 5 Harvesting and Preparation of Blood Samples
[0131] One or more of the methods and/or procedures below were used to prepare samples from SLE patients and normal control subjects. In the first method, two tubes of blood were drawn from each patient or normal control subject using either a peripheral venous blood draw or directly from a large-bore intra-arterial or intravenous catheter inserted in the femoral artery or vein, subclavian vein or internal jugular vein. Care was taken to avoid sample contamination with heparin since it interferes with RNA preparation.
[0132] In the second method, 8 ml of blood was drawn into a VACUTAINER CPT tube (BD Biosciences (BD), San Jose CA) containing the anticoagulant sodium citrate, Ficoll Hypaque density fluid, and a thixotropic polyester gel barrier permeable upon centrifugation to red blood cells (RBCs) and granulocytes but not to mononuclear cells. The blood was mixed with the anticoagulant in the tube by inverting the tube 5-10 times. Then, mononuclear cells and plasma were separated using the following procedures.
[0133] In one procedure, the mononuclear cells and plasma moved to the top of the tube while the RBCs and the granulocytes were trapped beneath the gel barrier when the tube was centrifuged in a swinging bucket rotor at 1750 x g for 20 min at room temperature. After, the mononuclear cells and plasma were decanted into a 15 ml tube, 5 ml of phosphate-buffered saline (PBS) were added. The tubes was inverted 5 times and centrifuged for 5 min at 1750 x g to pellet the cells; the supernatant was discarded.
[0134] In a second procedure, the clear plasma layer that formed above the mononuclear cell layer during centrifugation was aspirated and discarded. Then the mononuclear cell layer was aspirated, and all of the mononuclear cells were washed from the surface of the gel barrier with PBS. Approximately 2 mis of mononuclear cell suspension were transferred to a microcentrifuge tube and centrifuged in a microcentrifuge for 3 min at 16,000 rpm to pellet the cells; the supernatant was discarded.
[0135] Following each of the methods and/or procedures above, 1.8 ml of RLT lysis buffer (Qiagen, Chatsworth CA) was added to the pellet, the cells and lysis buffer were pipetted up and down to ensure complete lysis. Cell lysate was frozen and stored at -80°C until total
RNA was isolated.
Example 6 RNA preparation
[0136] RNA was prepared from the RNA samples from SLE patients or normal controls using one of the following protocols. In the first protocol: 1) samples were thawed, 2) 4 ml of chloroform were added to each tube, 3) tubes were vortexed prior to centrifugation at 2000 x g for 5 min, and 5) the aqueous layer was moved to new tube and processed using the RNeasy Maxi kit (Qiagen) according to the manufacturer's instructions. RNA quality was assessed using spectrophotometry, A260/A280 spectrophotometric ratios were considered to be acceptable when they ranged between 1.6 and 2.0, and/or gel electrophoresis, when 2 μl of each sample were run on an agarose gel in the presence of ethidium bromide and no degradation of RNA and no DNA contamination were visible.
[0137] In the second protocol: 1) samples were thawed and held at room temperature for 5 min, 2) after adding 5 ml of chloroform, the samples were vortexed and incubated at room temperature for 3 min, 3) the aqueous layer was transferred to a new 50 ml tube and purified using the RNeasy Maxi kit (Qiagen), and 4) the columns were eluted twice with 1 ml RNAse free water and incubated for one min before each spin. RNAs isolated using the first and second protocols were combined when the normal control cell preparations demonstrated reproducibility. The RNAs were mixed in a 50 ml tube, aliquoted into two 15 ml storage or 1.5 ml microcentrifuge tubes (100 μl per), and stored at -80°C.
[0138] In the third protocol: total RNA was purified using the RNeasy Miniprep kit (Qiagen) according to the protocol provided. Cells were homogenized and DNAse treated on a QIASHREDDER columns (Qiagen) and purified RNA was eluted in 50 μl of water.
[0139] After the last two protocols, RNA using the Agilent 2100 bioanalyzer and RNA 6000 microfluidics chips (Agilent Technologies).
Example 7 cDNA Synthesis
[0140] cDNA was synthesized from RNA using reverse transcription with OLIGO-dT primers/random hexamers (Invitrogen, Carlsbad CA) at a final concentration of 0.5 ng/μl and
3 ng/μl, respectively.
[0141] For the first strand reaction, 0.5 μg of mononuclear RNA or 2 μg of whole blood RNA and 1 μl of the OLIGO-dT/random hexamers (Invitrogen) were added to water in a reaction tube to a final volume of 11.5 μl. The tube was incubated at 70°C for 10 min, chilled on ice, centrifuged, and 88.5 μl of first strand buffer mix (Invitrogen) was added to the tube.
[0142] The first strand buffer mix contained 1 x first strand buffer, 10 mM DTT (Invitrogen), 0.5 mM dATP (New England Biolabs (NEB), Beverly MA), 0.5 mM dGTP (NEB), 0.5 mM dTTP (NEB), 0.5 mM dCTP (NEB), 200 U of SUPERSCRIPT RNAse H reverse transcriptase (Invitrogen), and 18 U of RNAGUARD inhibitor (GE Healthcare (GEH), Piscataway NJ). After the reaction was incubated at 420C for 90 min, the enzyme was heat- inactivated at 70°C for 15 min. After adding 2 U of RNAse H (NEB) to the reaction tube, it was incubated at 370C for 20 min.
[0143] For second strand synthesis, 40 U of E. coli DNA polymerase (Invitrogen) and 2 U RNaseH (Invitrogen) were added to the previous reaction to bring the final volume to 150 μl. Salts and nucleotides were added to a final concentration of 20 mM Tris-HCl (pH 7.0; Fisher Scientific, Pittsburgh PA), 90 mM KCl (Teknova, Half Moon Bay CA) , 4.6 mM MgCl2 (Teknova), 10 mM(NH4)2Sθ4 (Fisher Scientific), 1 x second strand buffer (Invitrogen), 0.266 mM dGTP, 0.266 mM dATP, 0.266 mM dTTP, and 0.266 mM dCTP.
[0144] After second strand synthesis for 150 min at 16°C, the cDNA was purified away from the enzymes, dNTPs, and buffers using phenol-chloroform extraction followed by ethanol precipitation in the presence of glycogen. Alternatively, the cDNA was purified on a QIAQUICK silica-gel column (Qiagen) followed by ethanol precipitation in the presence of glycogen. The cDNA was centrifuged at > 10,000 x g for 30 min; and after the supernatant was aspirated, the pellet was washed with 150 μl of 70% ethanol. Following recentrifugation, the supernatant was removed, and residual ethanol was evaporated at room temperature. Alternatively, the volume of column purified cDNA was reduced in a vacuum evaporator to 7.4 μl.
Example 8 Arrays
[0145] Arrays were used to produce a gene expression profile for diagnosing and monitoring the status of SLE in a patient. In one format, the array contains reagents specific for at least two genes or proteins, one that binds to a gene or protein of the invention, and one that binds to a control gene or protein.
Nucleic Acid Arrays
[0146] Human Genome CGH 44A microarrays (Agilent Technologies) were used to determine differential gene expression. These Cy3/Cy5 chips contained 41,675 probes (60- mers) that represented most the genes found in REFSEQ database (NCBI); additional genes on the chip represented various controls. The chips were run as recommended by the manufacturer and scanned using an Agilent DNA microarray scanner. The data was extracted using Feature Extraction v 7.5 software (Agilent Technologies).
[0147] In the alternative, Affymetrix U133A Human GeneChips (Affymetrix, Santa Clara CA) with probe sets representing about 14,500 full length genes and 22,000 features were used according to the manuals and product inserts supplied by the manufacturer. Affymetrix Microarray Suite (MAS) v 5.0 software was used to generate expression values for each gene. To correct for slight differences in overall chip hybridization intensity and allow for comparison between samples, each chip was scaled to an overall intensity of 1500.
[0148] In one alternative, the PAXgene Blood RNA system (PreAnalytix GmbH, Hombrechtikon Switzerland) was used for whole blood collection, stabilization, and RNA isolation from patient and/or normal samples. Five μg of total RNA was used to prepare biotinylated cRNA for hybridization using a standard protocol (Expression Analysis Technical Manual, Affymetrix). For samples with low RNA yields, two or more rounds of amplification were performed. Fifteen micrograms of each labeled cRNA was hybridized to Affymetrix U 133 A Human GeneChips.
[0149] In another alternative, a low density array containing amplicons produced using probe sets for genes selected from Table 1 and Table 2 are harvested from PCR reactions,
purified using Sephacryl-400 beads (GEH) and arrayed on a membrane. The membrane is UV irradiated, washed in 0.2% SDS at room temperature and rinsed three times in distilled water. Non-specific binding sites on the array are blocked by incubation in 0.2% casein in PBS for 30 min at 60°C, and the arrays are washed in 0.2% SDS and rinsed in distilled water.
[0150] In another alternative, purified amplicons are robotically arranged and immobilized on polymer-coated glass slides using the procedure described in USPN 5,807,522 (which is hereby incorporated in its entirety). Polymer-coated slides are prepared by cleaning glass microscope slides (Corning Life Sciences, Corning NY) ultrasonically in 0.1% SDS and acetone, etching in 4% hydrofluoric acid (VWR Scientific Products, West Chester PA), coating with 0.05% aminopropyl silane (Sigma-Aldrich) in 95% ethanol, and curing in a 1 100C oven. The slides are washed extensively with distilled water between and after treatments.
Antibody arrays
[0151] Monoclonal antibodies specific to at least two IFNr proteins and at least two proteins selected from the clusters of Table 1 are immobilized on a membrane, slide or dipstick or added to the wells of an ELISA plate using methods well known in the art. The array is incubated in the presence of serum or cell lysate until protein:antibody complexes are formed. The proteins encoded by genes or their splice variants are identified by the known position and labeling of the antibody that binds an epitope of that protein on the array. Quantification is normalized using the antibody:protein complex of various controls.
Example 9 Designing and Selecting Primers and Probe Sets
[0152] Primers and probe sets were designed and selected for each gene having utility in the diagnosis and monitoring of SLE using the PRIMER3 program (Whitehead Research Institute (WRI), Cambridge MA). Default values were used for all parameters but melting temperature (Tm). Tm was set between 71.7 and 73.7°C; amplicon size, between 50 and 150 bases in length (optimum, about 100 bases); and primers or probes were allowed to be 36 nucleotides in length. Salt concentration, a critical parameter affecting the Tm of the probes and primers,
was used at the default concentration, 50 mM.
[0153] The C source code for the PRIMER3 program was downloaded from the WRI website and complied on a Sun Enterprise 250 server (Sun Microsystems, Palo Alto CA) using the GCC compiler (Free Software Foundation, Boston MA). A subsequent version was compiled for machines running the Windows operating system (Microsoft, Redmond WA). The program was run from the command line which also dictated the use of an input file that contained the sequences and the parameters for primer design as described in the help files that accompanied the software. A script was written to input a number of sequences and automatically generate a number of potential primers. The following batch approach was used to design primers for the genes.
[0154] The first step in designing primers was to mask out repetitive sequences in the mRNA using the REPEA TMASKER program (Institute for Systems Biology, University of Washington, Seattle WA). The second step was to mask out all known SNPs for the genes as annotated in the SNP database at NCBI (Bethesda MD) that have an allelic heterozygosity higher than 1%. The masked sequence was submitted to PRIMER3 using parameters as outlined above, and the top eight sequences were selected. Alternatively, the Primer3 program was used on the MIT website (Massachusetts Institute of Technology, Cambridge MA) to examine a specific region on the mRNA of a particular gene. The final step was to test several of the top pairs of primers for correct size and efficiency.
[0155] Primers were ordered from Integrated DNA Technologies (Coralville IA) or an alternative commercial source.
Example 10 Testing of Primers and Probe Sets for RT-PCR
[0156] Control genes: With both microarrays and RT-PCR, variation was monitored by adding one or more genes from bacteria, plants, or animals in one or more wells. Although human β-actin and β-GUS were used to validate the control RNAs, several other genes were also tested for variability between samples, for expression in mononuclear and whole blood RNA from control subjects and SLE patients, on samples prepared using various protocols,
and in the RT-PCR assays.
[0157] Based on criteria of low variability between control and patient samples and high expression across samples, β-actin, β-GUS, 18s ribosomal subunit, GAPDH, and β2- microglobulin were selected as the control genes and used in the various assays.
[0158] Primer Testing: Primers were tested once using RT-PCR protocol (without Rox and Sybr green dyes) to see whether they produced an amplicon of the correct size without amplifying non-specific sequences. Each primer pair/probe set was tested on cDNA made from mononuclear cell control RNA described in Example 2. The PCR reaction contained 1 x RealTime-PCR buffer (Ambion, Austin TX), 2 mM MgC12 (ABI), 0.2 mM dATP (NEB), 0.2 mM dTTP (NEB), 0.2 mM dCTP (NEB), 0.2 mM dGTP (NEB), 0.625 U AMPLITAQ Gold enzyme (ABI), 0.3 μM of each primer to be used (Sigma Genosys, The Woodlands TX), 5 μl of the reverse transcription reaction, and water added to a final volume of 19 μl.
[0159] Following 40 cycles of PCR, 10 μl of each product were combined with Sybr Green dye at a final dilution of 1 :72,000. Melt curves for each PCR product were determined on a PRISM 7900HT Sequence detection system (ABI), and primer pairs yielding a product with one clean peak were chosen for further analysis. One μl of product from each probe set assay was examined by agarose gel electrophoresis or using a DNA 1000 chip kit and an Agilent 2100 bioanalyzer (Agilent Technologies). From primer design and the genomic sequence, the expected size of the amplicon was known. Only primer pairs showing amplification of the single desired product, and minimal amplification of contaminants, were used in assays.
[0160] Primers were tested a second time to determine their efficiency in an RT-PCR reactions. cDNA was synthesized as described above. A set of 5 serial dilutions of cDNA in water: 1 :10, 1 :20, 1:40, 1 :80, and 1 : 160 was tested using RT-PCR.
Example 11 RT-PCR Assays and Analysis
[0161] TAQMAN: PCR reactions were performed using the TAQMAN Universal PCR Master mix (ABI). The master mix was aliquoted into light tight tubes, one for each gene. The primer pair for each gene was added to the tube of PCR master mix labeled for that gene.
A FAM/TAMRA dual labeled TAQMAN probe (Biosearch Technologies, Novato CA) was added to each tube. Alternatively, different combinations of commercially available fluorescent reporter dyes and quenchers were used such that the absorption wavelength for the quencher matches the emission wavelength for the reporter.
In one alternative, a Sybr green RT-PCR reaction can be performed using the TAQMAN PCR reagent kit (ABI). In the alternative, Universal ProbeLibrary (LNAs; Roche Diagnostics, Pleasanton CA), were substituted for Taqman probes.
[0162] RT-PCR Assays and Analysis: 18 μl of master mix were dispensed into each well of a 384 well plate (ABI), and 2 μl of the template sample were dispensed into triplicate wells for each primer pair. The final concentration of each reagent was: 1 x TAQMAN Universal PCR Master Mix, 300 nM each primer, 0.25 nM TAQMAN probe, and 21 μl of 1 :10 diluted template. PCR reactions were run on the PRISM 7900HT Sequence Detection system (ABI) with the following conditions: 10 min at 95°C; 40 cycles of 950C for 15 sec, 600C for 1 min.
[0163] Sequence detection system v2.0 software (ABI) was used to analyze the fluorescent signal from each reaction. Standard deviation (Stdev) and coefficient of variation (CV) were calculated for triplicate wells. If the CV was greater than 2, an outlier among the three wells was identified and deleted; and the average was recalculated. In each plate, the difference in CT (ΔCT) was calculated for each gene and control combination by subtracting the average CT of the gene from the average CT of the control. The expression relative to the control was calculated by taking two to the power of the ΔCT of the gene.
[0164] In each case, all plates were run in duplicate and analyzed in the same manner. The percent variation was determined for each sample and gene combination (relative expression, RE) by taking the absolute value of the RE for the second plate from the RE for the first plate, and dividing that by the average. If more than a quarter of the variation calculations on a plate were greater than 50%, then a third plate was run. The cycle number at which each amplification curve crossed CT was recorded, and the file was transferred to MS Excel for further analysis. CT values for triplicate wells were averaged, and data were plotted as a function of the logio of the calculated starting concentration of RNA. The starting RNA
concentration for each cDNA dilution was determined based on the original amount of RNA used in the reverse transcription reaction, the dilution of the reverse transcription reaction, and the amount used in the RT-PCR reaction (usually 5 μl). For each gene, a linear regression line was plotted through all points of the dilution series. The slope of the line was used to calculate efficiency of the reaction for each primer set using the equation, E = 10( " ' / slope ) -1. This efficiency equation was used to compare the expression of primers or probe sets for each gene, and a primer pair was considered successful if the efficiency was reproducibly determined to be 0.85-1.2.
[0165] Since variation of RT-PCR assays can arise from unequal amounts of RNA starting material, probe sets for control genes can be run in the same reaction as the probe set for the diagnostic gene to reduce variation. Different fluorescent dyes were used to amplify the control, differentiating their expression from that of the diagnostic gene.
[0166] Quantitative RT-PCR: RT-PCR was used to compare the expression of each gene using the primers described above. cDNA was synthesized from normal control, patient, and reference samples. Ten μl RT-PCR reactions were performed using a PRISM 7900 Sequence Detection system (ABI) using FAM-TAMRA labeled probes and the standard TAQMAN protocols described above. RT-PCR amplification product was measured as CT (threshold cycle = the point at which an amplification curve crosses a threshold fluorescence value) during the PCR reaction to observe amplification before any reagent became rate limiting. Threshold was set to a point where all of the reactions were in their linear phase of amplification. A lower CT indicated a higher amount of starting material (greater expression in the sample) since an earlier cycle number meant the threshold was crossed more quickly. A CT of less than 30 based on appropriate cDNA dilutions provided linear results for the blood samples from SLE patients.
[0167] In the alternative, other labeling moieties or technologies can be used to measure amplification product in RT-PCR. Molecular beacons (Invitrogen) use FRET technology, and fluorescence is measured when a hairpin structure is relaxed by the specific probe binding to the amplicon.
[0168] Other labeling moieties can be used for detection of an antibody, nucleic acid or protein in any of the assays or diagnostic kits described herein. These labeling moieties include fluorescent, chemiluminescent, or chromogenic agents, cofactors, enzymes, inhibitors, magnetic particles, radionuclides, reporters/quenchers, substrates and the like that can be attached to or incorporated into the antibody, nucleic acid or protein. Visible labels and dyes include but are not limited to anthocyanins, avidin-biotin, β glucuronidase, biotin, BIODIPY, Coomassie blue, Cy3 and Cy5, 4,6-diamidino-2-phenylindole (DAPI), digoxigenin, ethidium bromide, FAM/TAMRA, FITC, fluorescein, gold, green fluorescent protein, horseradish peroxidase, lissamine, luciferase, phycoerythrin, reporter/quencher pairs (HEX/TAMRA, JOE/TAMRA, ROX/BHQ2, TAMRA/BHQ2, TET/BHQ1, VIC/BHQl, and the like), rhodamine, spyro red, silver, streptavidin, and the like. Radioactive markers include radioactive forms of hydrogen, iodine, phosphorous, sulfur, and the like.
Example 12 Protein Expression
[0169] Adapter sequences for subcloning are added at either end of a coding region specific to a gene or a portion thereof and amplified using PCR. An epitope or affinity tag (6 x his) or sequences for secretion from a cell can be added to the adapter sequence to facilitate purification and/or detection of the protein. The amplified cDNA is inserted into a shuttle or expression vector that can replicate in bacteria, insect, yeast, plant, or mammalian cells. Such vectors typically contain a promoter that operably links to the coding region, replication start sites, and antibiotic resistance or metabolite selection sequences.
[0170] The expression vector can be used in an in vitro translation system or to transfect cells. For example, Spodoptera frugiperda (Sf9) insect cells are infected with recombinant Autographica californica nuclear polyhedrosis virus (baculovirus). The polyhedrin gene is replaced with the cDNA by homologous recombination, and the polyhedrin promoter drives transcription. The protein is synthesized as a fusion protein with an affinity tag that enables purification.
[0171] Clones of transformed cells are analyzed to ensure that the inserted sequence is expressed. Once expression is verified, the cells are grown under selective conditions; and the
protein is isolated from cells, or if secreted, from the growth media using chromatography, size exclusion chromatography, immunoaffinity chromatography, or other methods including cell fractionation, ion exchange, or selective precipitation.
[0172] The isolated and purified protein is then used as a reagent on an array or as an antigen to produce specific antibodies.
Example 13: Antibody Production and Testing
[0173] If antibodies are to be used as reagents, the sequence of the gene or splice variant is analyzed to determine regions of high immunogenicity (LASERGENE software; DNASTAR, Madison Wl), and an appropriate oligopeptide is synthesized and conjugated to keyhole lympet hemocyanin (KLH; Sigma-Aldrich, St Louis MO).
Immunization
[0174] Rabbits are injected with the oligopeptide-KLH complexes in complete Freund's adjuvant, and the resulting antisera is tested for specific recognition of the protein or fragments thereof. Antisera that react positively with the protein are affinity purified on a column containing beaded agarose resin to which the synthetic oligopeptide has been conjugated (SULFOLINK kit; Pierce Chemical, Rockford IL). The column is equilibrated using 12 ml IMMUNOPURE Gentle Binding buffer (Pierce Chemical). Three ml of rabbit antisera is combined with one ml of binding buffer and poured into the column. The column is capped (on the top and bottom), and antisera is allowed to bind with the oligopeptide by gentle shaking at room temperature for 30 min. The column is allowed to settle for 30 min, drained by gravity flow, and washed with 16 ml binding buffer (4 x 4 ml additions of buffer). The antibody is eluted in one ml fractions with IMMUNOPURE Gentle Elution buffer (Pierce Chemical), and absorbance at 280 nm is determined. Peak fractions are pooled and dialyzed against 50 mM Tris, pH 7.4, 100 mM NaCl, and 10% glycerol. After dialysis, the concentration of the purified antibody is determined using the BCA assay (Pierce Chemical), aliquoted, and frozen.
Electrophoresis and Blotting
[0175] Samples containing protein are mixed in 2 x loading buffer, heated to 950C for 3-5 min, and loaded on 4-12% NUPAGE Bis-Tris precast gel (Invitrogen). Unless indicated, equal amounts of total protein are loaded into each well. The gel is electrophoresed in 1 x MES or MOPS running buffer (Invitrogen) at 200 V for approximately 45 min on an XCELL II apparatus (Invitrogen) until the RAINBOW marker (GEH) resolves and the dye front approaches the bottom of the gel. The gel is soaked in 1 x transfer buffer (Invitrogen) with 10% methanol for a few minutes; and a PVDF membrane (Millipore, Billerica MA) is soaked in 100% methanol for a few seconds to activate it. The membrane, the gel, and supports are placed on the TRANSBLOT SD transfer apparatus (Biorad, Hercules CA) and a constant current of 350 mA is applied for 90 min.
Conjugation with Antibody and Visualization
[0176] After the proteins are transferred to the membrane, it is blocked in 5% (w/v) non-fat dry milk in 1 x phosphate buffered saline (PBS) with 0.1% Tween 20 detergent (blocking buffer) on a rotary shaker for at least 1 hr at room temperature or at 40C overnight. After blocking, the buffer is removed, and 10 ml of primary antibody in blocking buffer is added and incubated on the rotary shaker for 1 hr at room temperature or overnight at 4°C. The membrane is washed 3 times for 10 min each with PBS-Tween (PBST), and secondary antibody, conjugated to horseradish peroxidase, is added at a 1 :3000 dilution in 10 ml blocking buffer. The membrane and solution are shaken for 30 min at room temperature and washed three times for 10 min with PBST.
[0177] The wash solution is carefully removed, and the membrane is moistened with ECL+ chemiluminescent detection system (GEH) and incubated for approximately 5 min. The membrane, protein side down, is placed on x-ray film (Eastman Kodak, Rochester NY) and developed for approximately 30 seconds. Antibody:protein complexes are visualized and/or scanned and quantified.
TABLE 1
4-

TABLE 1
4-
OO

TABLE 1
4-

TABLE 1
O

TABLE 1
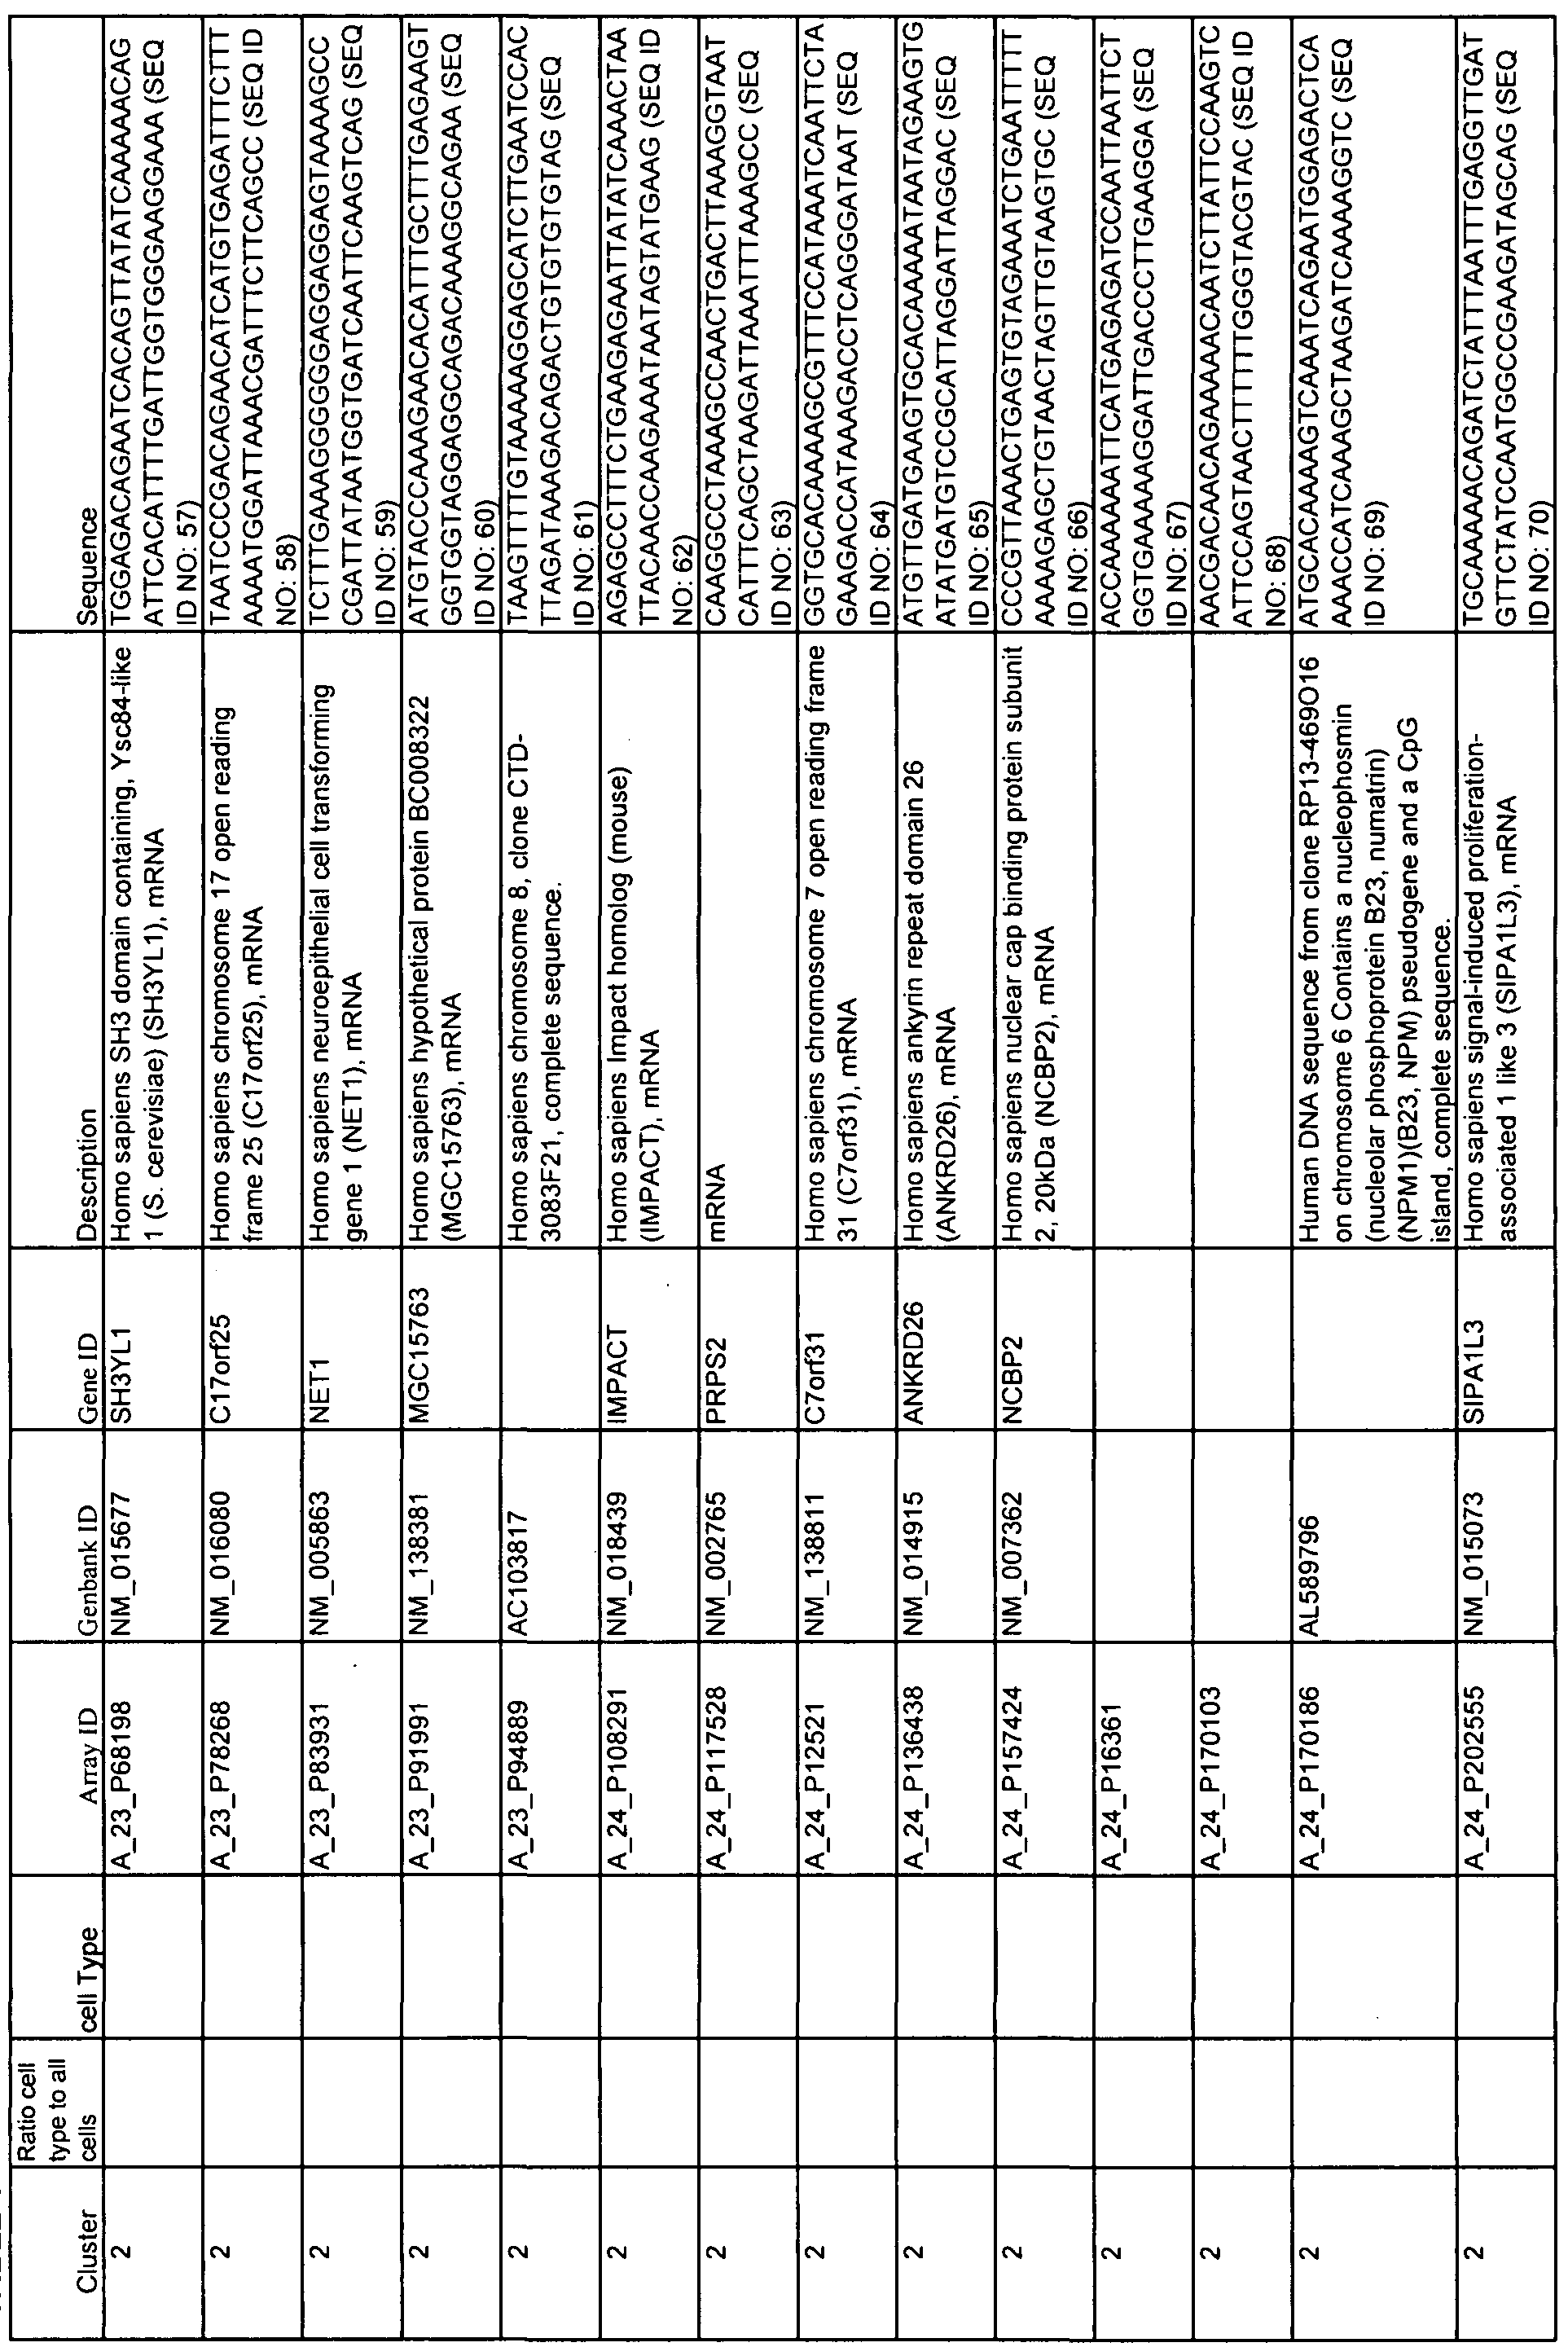
TABLE 1
Ul K>

TABLE 1
Ul

TABLE 1

TABLE 1

TABLE 1
Ul

TABLE 1

TABLE 1
Ul
90
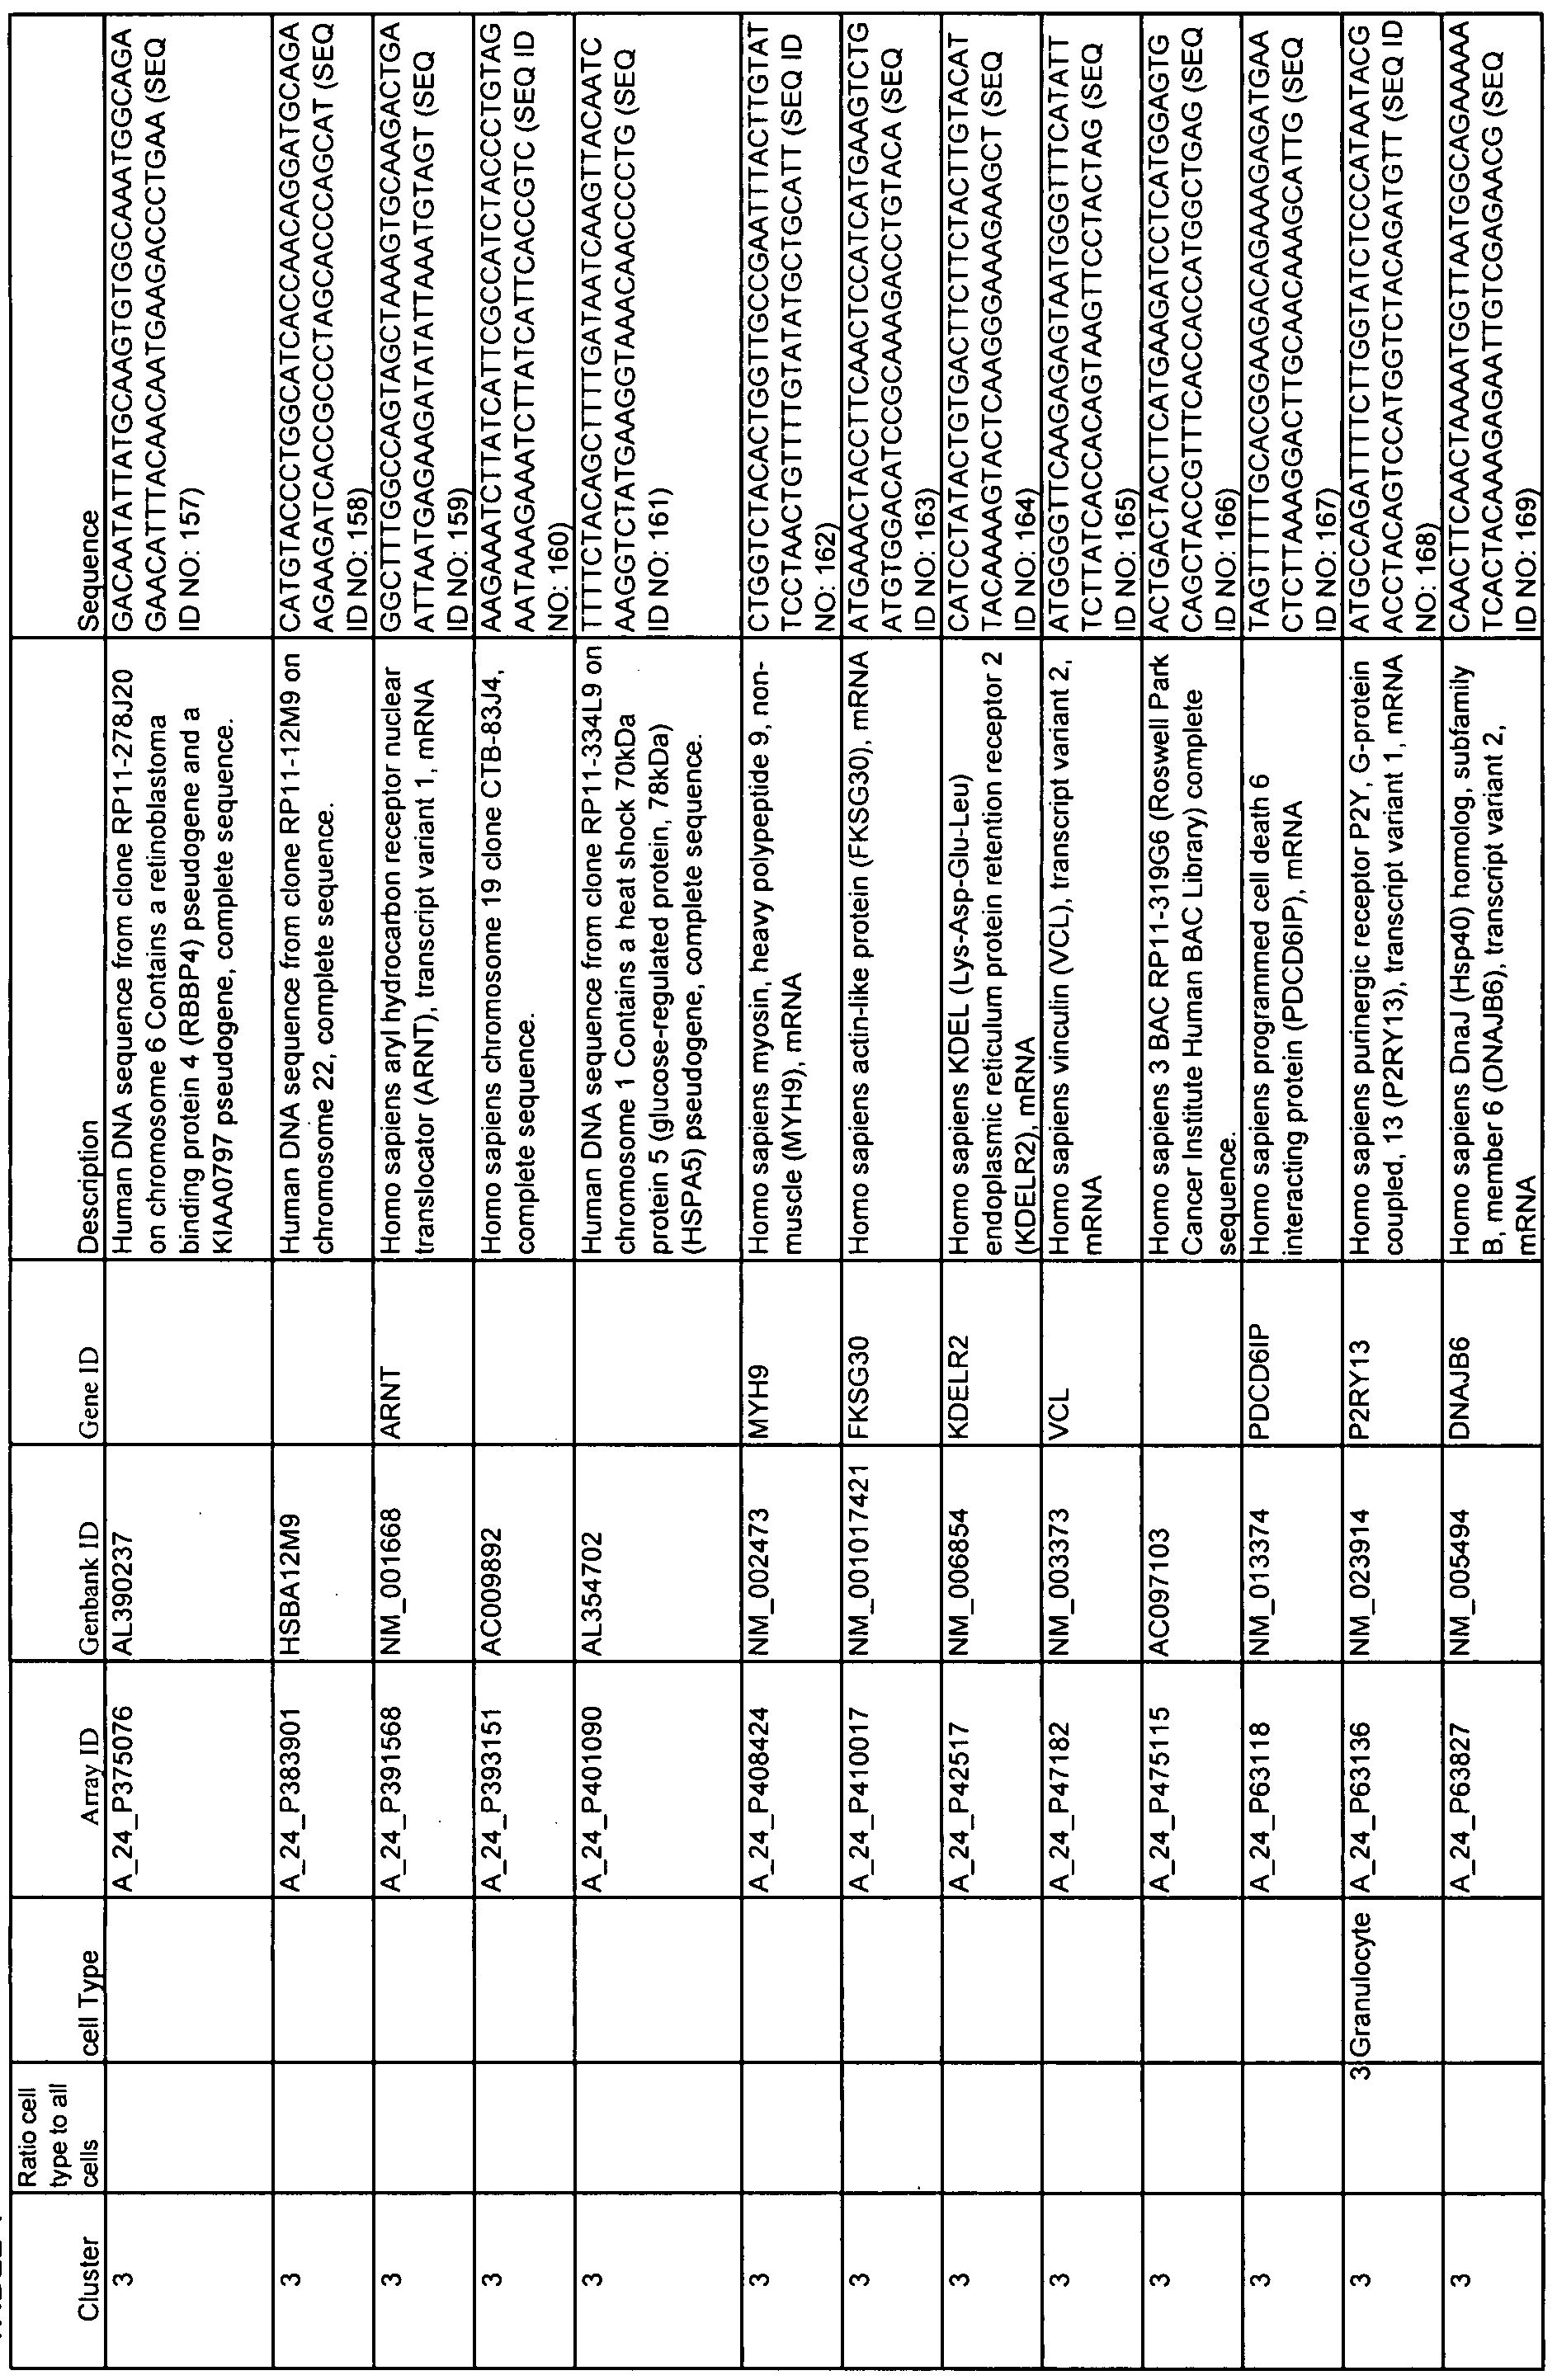
TABLE 1
Ul

TABLE 1
O

TABLE 1
c
 \
\

TABLE 1
K*

TABLE 1

TABLE 1
4-

TABLE 1

TABLE 1
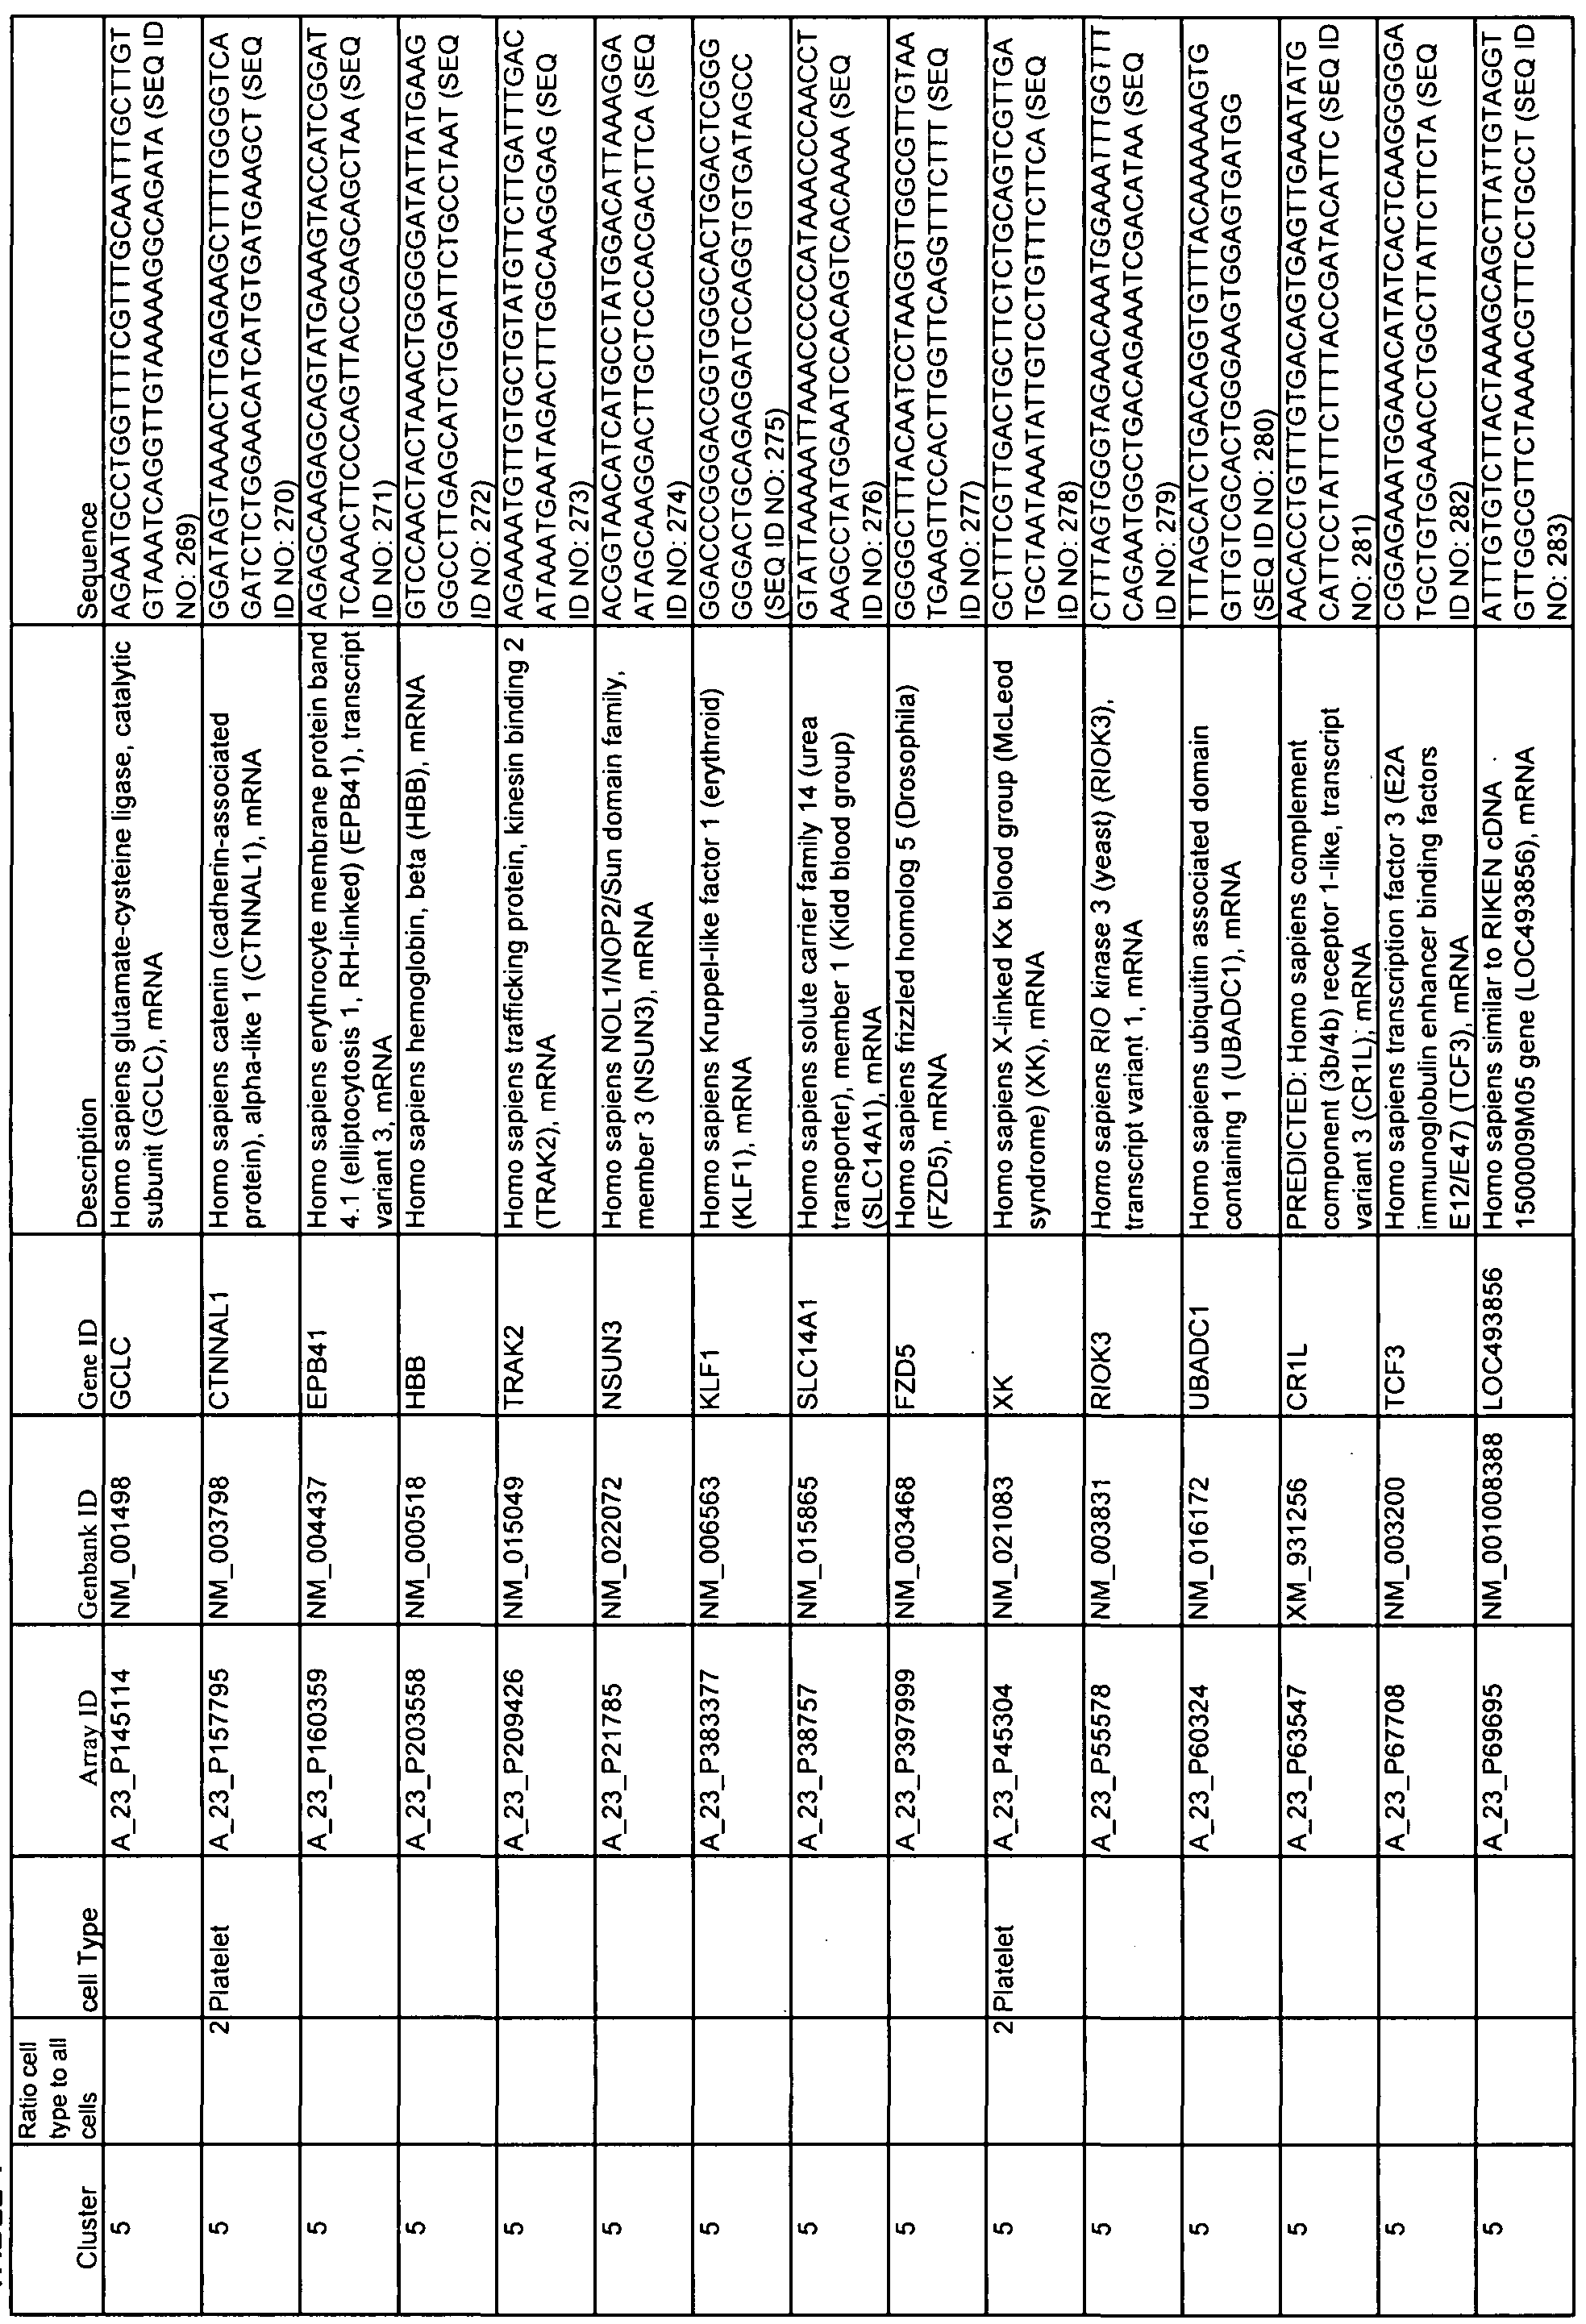
TABLE 1

TABLE 1 oo

TABLE 1

TABLE 1
O

TABLE 1

TABLE 1
K*

TABLE 1

TABLE 1
4-

TABLE 1
Ul

TABLE 1

TABLE 1
-J -J

TABLE 1
90

TABLE 1

TABLE 1
OO O

TABLE 1

TABLE 1
90 K*

TABLE 1
OO

TABLE 1
OO 4-

TABLE 1
OO Ul

TABLE 1
OO

TABLE 1
90

TABLE 1

90 OO
Table 2

Table 2

Table 2
V©

Table 2

Table 2
W

Table 2

Table 2
^o

Table 2

Table 2

Table 2
90

Table 2

Table 2
O O

TABLE 3
Patient ABCoN ID Sample Date SLEDAI INFr Days from 1st Sample INFr Score
1 JHP004-01 OFl 7/26/2006 2 LOW 0 -2.813
JHP004-02 F 10/15/2006 6 LOW 81 -1.864
2 JHPO 12-02 QFl 9/10/2006 0 LOW 0 -2.21
JHPO 12-04 F 1 1/5/2006 8 LOW 56 -2.202
3 JHPO 17-02 OFl 1 1/12/2006 0 LOW 0 -2.44
JHPO 17-03 F 2/4/2007 4 LOW 84 -2.07
4 JHPO 19-05 OF5 3/8/2007 0 LOW 0 0.255
JHPO 19-06 OFl 5/16/2007 2 LOW 69 -0.219
JHPO 19-07 F 8/26/2007 8 LOW 171 -0.124
5 JHP021-02 F 10/18/2006 4 HIGH 0 2.882
JHP021-04 OFl 12/19/2006 0 HIGH 62 1.878
6 JHP023-01 0F4 8/30/2006 0 LOW 0 -1.684
JHP023-02 F 1 1/15/2006 4 LOW 77 -1.404
JHP023-03 OFl 2/14/2007 0 LOW 168 -1.959
JHP023-04 F 5/9/2007 8 LOW 252 -1.293
7 JHP028-01 OF5 9/13/2006 4 HIGH 0 2.883
JHP028-03 OFl 3/18/2007 4 HIGH 186 3.57
JHP028-04 F 6/17/2007 16 HIGH 277 3.784
JHP028-05 OF4 7/8/2007 4 HIGH 298 4.696
JHP028-06 F 9/30/2007 16 HIGH 382 4.325
8 JHP029-01 OFl 9/13/2006 4 HIGH 0 3.463
JHP029-03 F 3/7/2007 9 HIGH 175 3.867
9 JHP030-03 F 2/4/2007 12 LOW 0 1.392
JHP030-09 F 6/10/2007 6 LOW 126 0.815
10 JHP033-02 OFl 12/17/2006 2 LOW 0 1.277
JHPO33-O3 F 3/4/2007 12 HIGH 77 2.276
1 1 JHP039-02 OFl 1/24/2007 4 HIGH 0 4.707
JHP039-03 F 3/28/2007 12 HIGH 63 4.281
12 JHP068-02 0F5 4/8/2007 0 HIGH 0 3.389
JHP068-03 OFl 7/1/2007 0 HIGH 84 3.773
JHP068-04 F 9/30/2007 7 HIGH 175 3.992
13 JHP072-01 F 1/14/2007 10 HIGH 0 3.178
JHP072-02 0F5 4/15/2007 0 LOW 91 0.155
JHP072-03 OFl 7/15/2007 0 HIGH 182 1.794
JHP072-04 F 10/7/2007 8 HIGH 266 2.377
14 JHP074-01 OFl 1/14/2007 3 HIGH 0 3.087
JHP074-05 F 1/13/2008 9 HIGH 364 4.226
15 JHP075-02 OF l 10/7/2007 1 LOW 0 -1.516
JHP075-03 F 1/13/2008 1 1 LOW 98 -0.26
101
TABLE 3
Patient ABCoN ID Sample Date SLEDAI INFr Days from 1st Sample INFr Score
16 JHP078-01 OF5 1/14/2007 4 HIGH 0 3.381
JHP078-02 QFl 7/22/2007 4 HIGH 189 4.042
JHP078-03 F 12/12/2007 10 HIGH 332 4.03
17 JHP079-02 F 2/28/2007 4 LOW 0 -2.02
JHP079-03 OF4 4/15/2007 0 LOW 46 -2.095
JHP079-04 F 7/15/2007 4 LOW 137 -1.931
18 JHP080-03 OFl 7/18/2007 4 HIGH 0 4.606
JHP080-04 F 9/12/2007 8 HIGH 56 4.35
19 JHP081-01 OF5 1/17/2007 0 LOW 0 -2.31
JHP081-02 OFl 5/16/2007 0 LOW 1 19 0.595
JHP081-03 F 7/18/2007 4 LOW 182 -1.632
JHP081-04 OO 10/17/2007 0 LOW 273 -1.729
20 JHPl OO-Ol OFl 5/16/2007 4 HIGH 0 3.896
JHP 100-03 F 3/26/2008 12 HIGH 315 3.88
21 JHPl 02-01 QF5 5/20/2007 4 HIGH 0 3.993
JHPl 02-02 QFl 6/17/2007 4 HIGH 28 4.048
JHP 102-03 F 9/23/2007 8 HIGH 126 3.19
JHPl 02-04 OF4 12/23/2007 0 HIGH 217 3.704
JHP 102-05 F 2/20/2008 4 HIGH 276 3.054
22 JHPl 04-01 OF5 6/6/2007 4 HIGH 0 4.508
JHP 104-02 QFl 9/5/2007 4 HIGH 91 3.259
JHP 104-04 F 2/27/2008 12 HIGH 266 3.59
23 JHPl 1 1 -02 OO 9/12/2007 0 HIGH 0 3.585
JHPl 1 1 -04 QFl 3/30/2008 2 HIGH 200 3.503
JHPl 1 1 -05 F 6/25/2008 6 HIGH 287 2.196
24 JHPl 17-02 QFl 9/30/2007 0 LOW 0 -0.932
JHPl 17-03 F 12/19/2007 4 LOW 80 0.251
25 JHP 120-04 OO 1 1/1 1/2007 0 HIGH 0 3.736
JHP 120-06 OFl 4/27/2008 0 HIGH 168 2.258
102
Claims
1. A method of diagnosing or monitoring the status of systemic lupus erythematosus
(SLE) in a subject or patient comprising:
detecting the expression of all genes of a diagnostic set in the subject or patient wherein the diagnostic set comprises two or more genes having expression correlated with the classification or status of SLE; and
diagnosing or monitoring the status of SLE in the subject or patient by applying at least one statistical method to the expression of the genes of the diagnostic set.
2. The method of claim 1 wherein the statistical method is a prediction algorithm.
3. The method of claim 2 wherein the prediction algorithm produces a number or single value indicative of the status of SLE in the subject or patient.
4. The method of claim 1 wherein the statistical method further comprises classification of the subject or patient into one of at least two classes of SLE.
5. The method of claim 4 wherein the statistical method is optimized to maximize the separation among longitudinally stable classes of SLE.
6. The method of claim 1 wherein the diagnostic set further comprises at least one gene selected from each of at least two gene clusters selected from cluster 1 , cluster 2, cluster 3, cluster 4, cluster 5, cluster 6, cluster 7, cluster 8, cluster 9, cluster 10, cluster 1 1 ; cluster 12, cluster 13, cluster 14, and cluster 15 of Table 1.
7. The method of claim 4 wherein classification of the subject or patient into one of at least two classes of SLE further comprises: detecting the expression of two or more gene whose expression correlates with the expression of the IFI27 from about 0.5 to about 1.0 and from about -0.5 to about -1.0 calculated using a Pearson correlation; and
classifying a subject or patient as having type 1 or type 2 SLE based on the expression of the two or more genes.
8. The method of claim 7 wherein one of the two or more genes is selected from Table 2.
9. The method of claim 7 wherein the classifying step uses a linear algorithm to produce an interferon response (INFr) score.
10. The method of claim 9 wherein a high INFr score is correlated with type I SLE and a low INFr score is correlated with type II SLE.
1 1. The method of claim 9 wherein at least one of the linear algorithm that produces an INFr score comprises IFI27 + IFIl 44*(1.1296) + OAS3*(1.8136).
12. The method of claim 7 wherein the Pearson correlation is selected from a range of 0.5, 0.4, 0.3, and 0.2 of these genes.
13. A method of diagnosing or monitoring the status of systemic lupus erythematosus (SLE) in a subject or patient comprising:
detecting the expression of all genes of a diagnostic set in a subject or patient wherein the diagnostic set comprises at least one gene from each of at least two gene clusters selected from cluster 1 , cluster 2, cluster 3, cluster 4, cluster 5, cluster 6, cluster 7, cluster 8, cluster 9, cluster 10, cluster 1 1 ; cluster 12, cluster 13, cluster 14, and cluster 15 of Table 1 ; and
diagnosing or monitoring the status of SLE in the subject or patient based on expression of the genes in the diagnostic set.
14. The method of claim 1 wherein the expression of all genes in the diagnostic set is detected using a nucleic acid technology.
15. The method of claim 14 wherein the nucleic acid technology further comprises hybridization or amplification in a quantitative real-time polymerase chain reaction.
16. The method of claim 15 wherein hybridization occurs in solution or on a substrate selected from magnetic or nonmagnetic beads, chips, fibers, filters, gels, membranes, microparticles, plates, polymers, slides, capillary tubing, and wafers with surface features selected from channels, columns, pins, pores, trenches, and wells.
17. The method of claim 1 wherein detecting expression of all genes further comprises isolating RNA from a subject or patient sample.
18. The method of claim 19 wherein expression is proportional to the amount of RNA isolated from the sample.
19. The method of claim 17 wherein the sample further comprises a body fluid or tissue obtained by any sampling means.
20. The method of claim 19 wherein the body fluid is selected from ascites, bile, whole blood or a blood fraction, cerebrospinal fluid, lymph, sputum, and urine.
21. The method of claim 19 wherein the tissue sample is selected from central nervous system, joints, kidneys, liver, lungs, oral cavity, sinuses, skin, and vasculature.
22. The method of claim 19 wherein the sampling means is selected from aspiration of a body fluid, a biopsy of a tissue or an organ, drawing of peripheral blood, endoscopy, and lavage followed by aspiration.
23. The method of claim 1 wherein detecting expression comprises using at least one primer or probe set to detect the expression of each of the genes in the diagnostic set.
24. The method of claim 23 wherein the primers or probe sets are oligonucleotides selected from natural or synthetic cDNA, genomic DNA, locked nucleic acids, peptide nucleic acids, and RNA.
25. The method of claim 23, wherein the primers or probe sets comprise a diagnostic kit.
26. The method of claim 7 wherein classifying a subject or patient as type 1 SLE or type 2 SLE comprises assigning a subject or patient to a clinical trial.
27. A method of diagnosing a patient as having a longitudinally stable classification of SLE comprising:
detecting the expression of two or more genes whose expression correlates with the expression of the IFI27 from about 0.5 to about 1.0 and from about -0.5 to about -1.0 calculated using Pearson correlation; and
diagnosing the patient as having type I or type II SLE based analyzing the expression of the two or more genes using a statistical method.
28. The method of claim 1 wherein the statistical method is selected from analysis of variance, classification algorithms, classification and regression trees, Fisher's Exact Test, linear algorithm, linear discriminatory analysis, linear regression, logistic algorithm, multiple regression, nearest shrunken centroids classifier, Pearson correlation, prediction algorithm, significance analysis of microarrays, one-tailed T-tests, two-tailed T-tests, voting algorithm, and Wilcoxon's signed ranks test.
29. The method of claim 1 wherein status of SLE in a subject or patient is incipient flare or disease activity.
30. The method of claim 1 wherein status of SLE in a subject or patient comprises a response to a therapeutic agent administered to the patient.
31. The method of claim 30 wherein the therapeutic agent is selected from ACE inhibitors, aspirin, azathioprine, B7RP-l-fc, β-blockers, brequinar sodium, campath-lH, celecoxib, chloroquine, corticosteroids, Coumadin, cyclophosphamide, cyclosporin A, dehydroepiandrosterone, deoxyspergualin, dexamethasone, diclofenac, dolobid, etodolac, everolimus, FK778, feldene, fenoprofen, flurbiprofen, heparin, hydralazine, hydroxychloroquine, CTLA-4 or LFA3 immunoglobulin, ibuprofen, indomethacin, ISAtx- 247, ketoprofen, ketorolac, lefiunomide, meclophenamate, mefenamic acid, mepacrine, 6- mercaptopurine, meloxicam, methotrexate, mizoribine, mycophenolate mofetil, naproxen, oxaprozin, Plaquenil, NOX-100, prednisone, methyprenisone, rapamycin (sirolimus), sulindac, tacrolimus (FK506), thymoglobulin, tolmetin, tresperimus, UO 126, and antibodies including but not limited to alpha lymphocyte antibodies, adalimumab, anti-CD3, anti-CD25, anti-CD52 anti-IL2R, and anti-TAC antibodies, basiliximab, daclizumab, etanercept, hu5C8, infliximab, OKT4, and natalizumab.
32. The method of claim 1 wherein status of SLE in a subject or patient comprises response to an immunosuppressant administered to a patient.
33. The method of claim 32 wherein the immunosuppressant is selected from aspirin, azathioprine, chloroquine, corticosteroids, cyclophosphamide, cyclosporin A, dehydroepiandrosterone, deoxyspergualin, dexamethasone, everolimus, fenoprofen, hydralazine, hydroxychloroquine, immunoglobulin, ibuprofen, indomethacin, lefiunomide, ketoprofen, meclophenamate, mepacrine, 6-mercaptopurine, methotrexate, mizoribine, mycophenolate mofetil, naproxen, prednisone, methyprenisone, rapamycin (sirolimus), solumedrol, tacrolimus (FK506), thymoglobulin, tolmetin, tresperimus, and triamcinoline.
34. The method of claim 1 wherein diagnosing and monitoring the status of SLE further comprises screening a subject exhibiting symptoms of a rheumatic disease for SLE.
35. The method of claim 34 wherein the rheumatic disease is selected from ankylosing spondylitis, dermatomyositis, autoimmune hepatitis, hepatitis-C (hep-C), polymyalgia rheumatica, polymyositis, rheumatoid arthritis (RA), scleroderma, systemic sclerosis, Sjogren's disease, systemic vasculitis, and Whipple's disease.
36. A method of producing a probe set for diagnosing or monitoring SLE in a subject or patient comprising:
selecting at least one gene from each of at least two of the gene clusters of Table 1 and at least two genes from Table 2; and
producing a probe set consisting of at least one oligonucleotide that detects the expression of each of the selected genes.
37. The method of claim 36 wherein the probe set is used in a diagnostic kit.
38. A method for predicting flare in a patient diagnosed with SLE comprising:
analyzing expression in a sample from the patient to produce a gene expression profile wherein
a first portion of the analysis comprises using the expression of at least one gene selected from each of at least two of the clusters 1 through 15 of Table 1 and at least one statistical method to produce a patient gene expression profile, and
a second portion of the analysis comprises using expression of at least two genes selected from Table 2 and a linear algorithm to classify the patient as having type 1 SLE or type 2 SLE; and
predicting flare by comparing the patient gene expression profile at least one reference profile.
39. The method of claim 38 wherein reference profile is selected from at least one normal subject, at least one patient classified as having type 1 SLE with quiescent status, at least one patient classified as having type 1 SLE in flare, at least one patient classified as having type 2 SLE with quiescent status, at least one patient classified as having type 2 SLE in flare.
Priority Applications (1)
| Application Number | Priority Date | Filing Date | Title |
|---|---|---|---|
| EP20070874123 EP2102367A2 (en) | 2006-11-09 | 2007-11-09 | Methods for diagnosing and monitoring the status of systemic lupus erythematosus |
Applications Claiming Priority (2)
| Application Number | Priority Date | Filing Date | Title |
|---|---|---|---|
| US85814706P | 2006-11-09 | 2006-11-09 | |
| US60/858,147 | 2006-11-09 |
Publications (2)
| Publication Number | Publication Date |
|---|---|
| WO2008140484A2 true WO2008140484A2 (en) | 2008-11-20 |
| WO2008140484A3 WO2008140484A3 (en) | 2009-10-01 |
Family
ID=40002784
Family Applications (1)
| Application Number | Title | Priority Date | Filing Date |
|---|---|---|---|
| PCT/US2007/023675 WO2008140484A2 (en) | 2006-11-09 | 2007-11-09 | Methods for diagnosing and monitoring the status of systemic lupus erythematosus |
Country Status (3)
| Country | Link |
|---|---|
| US (1) | US8148067B2 (en) |
| EP (1) | EP2102367A2 (en) |
| WO (1) | WO2008140484A2 (en) |
Cited By (1)
| Publication number | Priority date | Publication date | Assignee | Title |
|---|---|---|---|---|
| US9617343B2 (en) | 2009-05-13 | 2017-04-11 | Genzyme Corporation | Methods and compositions for treating lupus |
Families Citing this family (48)
| Publication number | Priority date | Publication date | Assignee | Title |
|---|---|---|---|---|
| US7026121B1 (en) | 2001-06-08 | 2006-04-11 | Expression Diagnostics, Inc. | Methods and compositions for diagnosing and monitoring transplant rejection |
| US7892745B2 (en) | 2003-04-24 | 2011-02-22 | Xdx, Inc. | Methods and compositions for diagnosing and monitoring transplant rejection |
| US7645575B2 (en) * | 2004-09-08 | 2010-01-12 | Xdx, Inc. | Genes useful for diagnosing and monitoring inflammation related disorders |
| WO2008104608A1 (en) * | 2007-03-01 | 2008-09-04 | Universite Catholique De Louvain | Method for the determination and the classification of rheumatic conditions |
| EP2294216A4 (en) | 2008-05-14 | 2011-11-23 | Dermtech Int | Diagnosis of melanoma and solar lentigo by nucleic acid analysis |
| US8691510B2 (en) * | 2008-11-07 | 2014-04-08 | Sequenta, Inc. | Sequence analysis of complex amplicons |
| US8628927B2 (en) | 2008-11-07 | 2014-01-14 | Sequenta, Inc. | Monitoring health and disease status using clonotype profiles |
| US9528160B2 (en) | 2008-11-07 | 2016-12-27 | Adaptive Biotechnolgies Corp. | Rare clonotypes and uses thereof |
| US9365901B2 (en) | 2008-11-07 | 2016-06-14 | Adaptive Biotechnologies Corp. | Monitoring immunoglobulin heavy chain evolution in B-cell acute lymphoblastic leukemia |
| US9506119B2 (en) | 2008-11-07 | 2016-11-29 | Adaptive Biotechnologies Corp. | Method of sequence determination using sequence tags |
| CN104195227B (en) * | 2008-11-07 | 2017-04-12 | 适应生物技术公司 | Methods of monitoring conditions by sequence analysis |
| US8748103B2 (en) * | 2008-11-07 | 2014-06-10 | Sequenta, Inc. | Monitoring health and disease status using clonotype profiles |
| EP2387627B1 (en) | 2009-01-15 | 2016-03-30 | Adaptive Biotechnologies Corporation | Adaptive immunity profiling and methods for generation of monoclonal antibodies |
| US11693009B2 (en) | 2009-02-11 | 2023-07-04 | Cedars-Sinai Medical Center | Methods for detecting post-infectious irritable bowel syndrome |
| DK2396652T3 (en) | 2009-02-11 | 2018-01-29 | Cedars Sinai Medical Center | DIAGNOSIS OF INFLAMMATORY GAS SYNDROME BASED ON CYTOLETALLY EFFECTIVE TOXIN |
| RU2539032C2 (en) | 2009-06-25 | 2015-01-10 | Фред Хатчинсон Кансэр Рисёч Сентер | Method for measuring artificial immunity |
| US9043160B1 (en) | 2009-11-09 | 2015-05-26 | Sequenta, Inc. | Method of determining clonotypes and clonotype profiles |
| US20130310266A1 (en) * | 2010-09-03 | 2013-11-21 | Immport Therapeutics, Inc. | Methods and Compositions For The Diagnosis And Treatment Of Cancer and Autoimmune Disorders |
| EP2439282A1 (en) * | 2010-10-06 | 2012-04-11 | bioMérieux | Method for determining a biological pathway activity |
| US10385475B2 (en) | 2011-09-12 | 2019-08-20 | Adaptive Biotechnologies Corp. | Random array sequencing of low-complexity libraries |
| AU2012325791B2 (en) | 2011-10-21 | 2018-04-05 | Adaptive Biotechnologies Corporation | Quantification of adaptive immune cell genomes in a complex mixture of cells |
| CA2858070C (en) | 2011-12-09 | 2018-07-10 | Adaptive Biotechnologies Corporation | Diagnosis of lymphoid malignancies and minimal residual disease detection |
| US9499865B2 (en) | 2011-12-13 | 2016-11-22 | Adaptive Biotechnologies Corp. | Detection and measurement of tissue-infiltrating lymphocytes |
| ES2662128T3 (en) | 2012-03-05 | 2018-04-05 | Adaptive Biotechnologies Corporation | Determination of paired immune receptor chains from the frequency of matching subunits |
| ES2582554T3 (en) | 2012-05-08 | 2016-09-13 | Adaptive Biotechnologies Corporation | Compositions and method for measuring and calibrating amplification bias in multiplexed PCR reactions |
| MX2015003326A (en) | 2012-09-17 | 2015-08-12 | Cedars Sinai Medical Center | Diagnosis and treatment of motility disorders of the gut and bladder, and of fibromyalgia. |
| CA2886647A1 (en) | 2012-10-01 | 2014-04-10 | Adaptive Biotechnologies Corporation | Immunocompetence assessment by adaptive immune receptor diversity and clonality characterization |
| US9708657B2 (en) | 2013-07-01 | 2017-07-18 | Adaptive Biotechnologies Corp. | Method for generating clonotype profiles using sequence tags |
| CN105611947A (en) * | 2013-07-24 | 2016-05-25 | 丹娜法伯癌症研究院 | Anti-galectin-1 (gal1) monoclonal antibodies and fragments thereof for neutralizing gal1 |
| US9851361B2 (en) | 2013-10-09 | 2017-12-26 | Cedars-Sinai Medical Center | Methods of comparing anti-vinculin and anti-cytolethal distending toxin antibodies as they relate to irritable bowel syndrome |
| WO2015063121A1 (en) * | 2013-10-29 | 2015-05-07 | Region Syddanmark | Method for analyzing body fluid samples |
| CA2941612A1 (en) | 2014-03-05 | 2015-09-11 | Adaptive Biotechnologies Corporation | Methods using randomer-containing synthetic molecules |
| US10066265B2 (en) | 2014-04-01 | 2018-09-04 | Adaptive Biotechnologies Corp. | Determining antigen-specific t-cells |
| ES2777529T3 (en) | 2014-04-17 | 2020-08-05 | Adaptive Biotechnologies Corp | Quantification of adaptive immune cell genomes in a complex mixture of cells |
| US10394828B1 (en) * | 2014-04-25 | 2019-08-27 | Emory University | Methods, systems and computer readable storage media for generating quantifiable genomic information and results |
| RU2706361C2 (en) | 2014-10-09 | 2019-11-18 | Седарс-Синаи Медикал Сентер | Methods and systems for distinguishing irritable bowel syndrome from inflammatory intestinal disease and gluten disease |
| US10392663B2 (en) | 2014-10-29 | 2019-08-27 | Adaptive Biotechnologies Corp. | Highly-multiplexed simultaneous detection of nucleic acids encoding paired adaptive immune receptor heterodimers from a large number of samples |
| US10246701B2 (en) | 2014-11-14 | 2019-04-02 | Adaptive Biotechnologies Corp. | Multiplexed digital quantitation of rearranged lymphoid receptors in a complex mixture |
| EP3224384A4 (en) | 2014-11-25 | 2018-04-18 | Adaptive Biotechnologies Corp. | Characterization of adaptive immune response to vaccination or infection using immune repertoire sequencing |
| ES2858306T3 (en) | 2015-02-24 | 2021-09-30 | Adaptive Biotechnologies Corp | Method for determining HLA status by sequencing the immune repertoire |
| WO2016161273A1 (en) | 2015-04-01 | 2016-10-06 | Adaptive Biotechnologies Corp. | Method of identifying human compatible t cell receptors specific for an antigenic target |
| US10428325B1 (en) | 2016-09-21 | 2019-10-01 | Adaptive Biotechnologies Corporation | Identification of antigen-specific B cell receptors |
| EP3573650A4 (en) * | 2017-01-30 | 2020-12-09 | Cedars-Sinai Medical Center | Diagnosis of scleroderma |
| US11254980B1 (en) | 2017-11-29 | 2022-02-22 | Adaptive Biotechnologies Corporation | Methods of profiling targeted polynucleotides while mitigating sequencing depth requirements |
| JP7431812B2 (en) | 2018-05-09 | 2024-02-15 | ダームテック,インク. | Novel gene classification and its use in autoimmune diseases |
| WO2020102043A1 (en) * | 2018-11-15 | 2020-05-22 | Ampel Biosolutions, Llc | Machine learning disease prediction and treatment prioritization |
| WO2020198229A1 (en) | 2019-03-26 | 2020-10-01 | Dermtech, Inc. | Novel gene classifiers and uses thereof in skin cancers |
| WO2023215331A1 (en) * | 2022-05-03 | 2023-11-09 | Ampel Biosolutions, Llc | Methods and compositions for assessing and treating lupus |
Family Cites Families (171)
| Publication number | Priority date | Publication date | Assignee | Title |
|---|---|---|---|---|
| US5981481A (en) | 1974-12-06 | 1999-11-09 | The Johns Hopkins University | Human C3b/C4b receptor (CR1) |
| US5212071A (en) * | 1988-04-01 | 1993-05-18 | The Johns Hopkins University | Nucleic acids encoding a human C3b/C4b receptor (CR1) |
| US4350593A (en) | 1977-12-19 | 1982-09-21 | Becton, Dickinson And Company | Assembly, compositions and method for separating blood |
| US4190535A (en) * | 1978-02-27 | 1980-02-26 | Corning Glass Works | Means for separating lymphocytes and monocytes from anticoagulated blood |
| US4215051A (en) * | 1979-08-29 | 1980-07-29 | Standard Oil Company (Indiana) | Formation, purification and recovery of phthalic anhydride |
| US4376110A (en) * | 1980-08-04 | 1983-03-08 | Hybritech, Incorporated | Immunometric assays using monoclonal antibodies |
| US4358535A (en) | 1980-12-08 | 1982-11-09 | Board Of Regents Of The University Of Washington | Specific DNA probes in diagnostic microbiology |
| US4762780A (en) | 1984-04-17 | 1988-08-09 | The Regents Of The University Of California | Method and composition for screening and diagnosing "HCMV" |
| US4582789A (en) * | 1984-03-21 | 1986-04-15 | Cetus Corporation | Process for labeling nucleic acids using psoralen derivatives |
| US4751001A (en) * | 1984-09-24 | 1988-06-14 | Becton Dickinson And Company | Blood partitioning apparatus |
| US4818418A (en) * | 1984-09-24 | 1989-04-04 | Becton Dickinson And Company | Blood partitioning method |
| US5264351A (en) | 1984-11-05 | 1993-11-23 | The Board Of Regents For The University Of Oklahoma | Monoclonal antibodies against autoimmune RNA proteins |
| US5053134A (en) | 1984-12-04 | 1991-10-01 | Becton Dickinson And Company | Lymphocyte collection tube |
| US4965188A (en) | 1986-08-22 | 1990-10-23 | Cetus Corporation | Process for amplifying, detecting, and/or cloning nucleic acid sequences using a thermostable enzyme |
| US6197563B1 (en) * | 1985-03-28 | 2001-03-06 | Roche Molecular Systems, Inc. | Kits for amplifying and detecting nucleic acid sequences |
| US4683195A (en) | 1986-01-30 | 1987-07-28 | Cetus Corporation | Process for amplifying, detecting, and/or-cloning nucleic acid sequences |
| US4683202A (en) | 1985-03-28 | 1987-07-28 | Cetus Corporation | Process for amplifying nucleic acid sequences |
| US6040166A (en) * | 1985-03-28 | 2000-03-21 | Roche Molecular Systems, Inc. | Kits for amplifying and detecting nucleic acid sequences, including a probe |
| EP0217102B1 (en) | 1985-08-28 | 1992-01-08 | Yeda Research And Development Company, Ltd. | Interferon-induced (2'-5') oligo a synthetase gene, mrna, cdna and enzymes having (2'-5') oligo a synthetase activity |
| US5011684A (en) | 1985-09-05 | 1991-04-30 | Beth Israel Hospital Association | Lysing or blocking unwanted cells with IL-2 receptor-specific binding substance |
| US4789630A (en) | 1985-10-04 | 1988-12-06 | Cetus Corporation | Ionic compounds containing the cationic meriquinone of a benzidine |
| US4800159A (en) * | 1986-02-07 | 1989-01-24 | Cetus Corporation | Process for amplifying, detecting, and/or cloning nucleic acid sequences |
| US5604099A (en) * | 1986-03-13 | 1997-02-18 | Hoffmann-La Roche Inc. | Process for detecting specific nucleotide variations and genetic polymorphisms present in nucleic acids |
| CA1284931C (en) | 1986-03-13 | 1991-06-18 | Henry A. Erlich | Process for detecting specific nucleotide variations and genetic polymorphisms present in nucleic acids |
| US5405774A (en) * | 1986-08-22 | 1995-04-11 | Hoffmann-La Roche Inc. | DNA encoding a mutated thermostable nucleic acid polymerase enzyme from thermus species sps17 |
| US6127155A (en) | 1986-08-22 | 2000-10-03 | Roche Molecular Systems, Inc. | Stabilized thermostable nucleic acid polymerase compositions containing non-ionic polymeric detergents |
| US5352600A (en) | 1986-08-22 | 1994-10-04 | Hoffmann-La Roche Inc. | Purified thermostable enzyme |
| US5455170A (en) | 1986-08-22 | 1995-10-03 | Hoffmann-La Roche Inc. | Mutated thermostable nucleic acid polymerase enzyme from Thermus species Z05 |
| US5466591A (en) | 1986-08-22 | 1995-11-14 | Hoffmann-La Roche Inc. | 5' to 3' exonuclease mutations of thermostable DNA polymerases |
| US5795762A (en) | 1986-08-22 | 1998-08-18 | Roche Molecular Systems, Inc. | 5' to 3' exonuclease mutations of thermostable DNA polymerases |
| US5693517A (en) | 1987-06-17 | 1997-12-02 | Roche Molecular Systems, Inc. | Reagents and methods for coupled high temperature reverse transcription and polymerase chain reactions |
| US5322770A (en) * | 1989-12-22 | 1994-06-21 | Hoffman-Laroche Inc. | Reverse transcription with thermostable DNA polymerases - high temperature reverse transcription |
| US5310652A (en) * | 1986-08-22 | 1994-05-10 | Hoffman-La Roche Inc. | Reverse transcription with thermostable DNA polymerase-high temperature reverse transcription |
| US5079352A (en) * | 1986-08-22 | 1992-01-07 | Cetus Corporation | Purified thermostable enzyme |
| US5618711A (en) * | 1986-08-22 | 1997-04-08 | Hoffmann-La Roche Inc. | Recombinant expression vectors and purification methods for Thermus thermophilus DNA polymerase |
| US5561058A (en) | 1986-08-22 | 1996-10-01 | Hoffmann-La Roche Inc. | Methods for coupled high temperatures reverse transcription and polymerase chain reactions |
| US5374553A (en) * | 1986-08-22 | 1994-12-20 | Hoffmann-La Roche Inc. | DNA encoding a thermostable nucleic acid polymerase enzyme from thermotoga maritima |
| US4889818A (en) | 1986-08-22 | 1989-12-26 | Cetus Corporation | Purified thermostable enzyme |
| US5407800A (en) * | 1986-08-22 | 1995-04-18 | Hoffmann-La Roche Inc. | Reverse transcription with Thermus thermophilus polymerase |
| US4946778A (en) | 1987-09-21 | 1990-08-07 | Genex Corporation | Single polypeptide chain binding molecules |
| US5063162A (en) | 1987-04-24 | 1991-11-05 | Hoffmann-La Roche Inc. | Process for isolating nucleic acids utilizing protease digestion |
| CA1297431C (en) | 1987-04-24 | 1992-03-17 | F. Hoffmann-La Roche Ag | Process for the isolation of nucleic acids |
| US4908318A (en) * | 1987-09-04 | 1990-03-13 | Integrated Genetics, Inc. | Nucleic acid extraction methods |
| US4843155A (en) * | 1987-11-19 | 1989-06-27 | Piotr Chomczynski | Product and process for isolating RNA |
| US5120525A (en) * | 1988-03-29 | 1992-06-09 | Immunomedics, Inc. | Radiolabeled antibody cytotoxic therapy of cancer |
| US5693760A (en) * | 1988-04-14 | 1997-12-02 | Incyte Pharmaceuticals, Inc. | Method of causing selective immunosuppression using HL-60 related lectins |
| US5142033A (en) | 1988-09-23 | 1992-08-25 | Hoffmann-La Roche Inc. | Structure-independent DNA amplification by the polymerase chain reaction |
| US5075216A (en) | 1988-09-23 | 1991-12-24 | Cetus Corporation | Methods for dna sequencing with thermus aquaticus dna polymerase |
| US5091310A (en) * | 1988-09-23 | 1992-02-25 | Cetus Corporation | Structure-independent dna amplification by the polymerase chain reaction |
| US5066584A (en) | 1988-09-23 | 1991-11-19 | Cetus Corporation | Methods for generating single stranded dna by the polymerase chain reaction |
| US5389512A (en) * | 1988-10-07 | 1995-02-14 | Hoffman-La Roche Inc. | Method for determining the relative amount of a viral nucleic acid segment in a sample by the polymerase chain reaction |
| US6040138A (en) * | 1995-09-15 | 2000-03-21 | Affymetrix, Inc. | Expression monitoring by hybridization to high density oligonucleotide arrays |
| US5143854A (en) | 1989-06-07 | 1992-09-01 | Affymax Technologies N.V. | Large scale photolithographic solid phase synthesis of polypeptides and receptor binding screening thereof |
| US5219727A (en) * | 1989-08-21 | 1993-06-15 | Hoffmann-Laroche Inc. | Quantitation of nucleic acids using the polymerase chain reaction |
| US5340720A (en) | 1989-11-29 | 1994-08-23 | University Of Kansas | Methods of diagnosing and monitoring rheumatic diseases |
| US5215882A (en) * | 1989-11-30 | 1993-06-01 | Ortho Diagnostic Systems, Inc. | Method of immobilizing nucleic acid on a solid surface for use in nucleic acid hybridization assays |
| CA2033692A1 (en) * | 1990-01-25 | 1991-07-26 | Wilhelm Bannwarth | Energy transfer systems |
| DK0515506T3 (en) * | 1990-02-16 | 2000-05-08 | Hoffmann La Roche | Method for detecting carcinogenic human papillomaviruses |
| US5344755A (en) * | 1990-04-21 | 1994-09-06 | The United States Of America As Represented By The Department Of Health And Human Services | Method for detecting immune system dysfunction in asymptomatic, HIV-scropositive individuals |
| US5350683A (en) | 1990-06-05 | 1994-09-27 | Immunex Corporation | DNA encoding type II interleukin-1 receptors |
| US5130423A (en) * | 1990-07-13 | 1992-07-14 | Microprobe Corporation | Non-corrosive compositions and methods useful for the extraction of nucleic acids |
| ATE176002T1 (en) * | 1990-07-24 | 1999-02-15 | Hoffmann La Roche | REDUCING NON-SPECIFIC AMPLIFICATION DURING (IN VITRO) NUCLEIC ACID AMPLIFICATION USING MODIFIED NUCLEIC ACID BASES |
| US5210015A (en) * | 1990-08-06 | 1993-05-11 | Hoffman-La Roche Inc. | Homogeneous assay system using the nuclease activity of a nucleic acid polymerase |
| ES2152923T3 (en) | 1990-09-28 | 2001-02-16 | Hoffmann La Roche | ENZYME PURIFIED THERMOSTABLE NUCLEIC ACID POLYMERASE, THERMOSIPHO AFRICANUS. |
| DE4034036C2 (en) * | 1990-10-26 | 1994-03-03 | Diagen Inst Molekularbio | Device and method for isolating nucleic acids from cell suspensions |
| ES2078733T3 (en) * | 1991-01-22 | 1995-12-16 | Akzo Nobel Nv | METHOD FOR THE DETECTION OF ANTI-RNA ANTIBODIES. |
| WO1992017198A1 (en) | 1991-03-28 | 1992-10-15 | The Regents Of The University Of Minnesota | Dna and amino acid sequence specific for natural killer cells |
| US5994056A (en) | 1991-05-02 | 1999-11-30 | Roche Molecular Systems, Inc. | Homogeneous methods for nucleic acid amplification and detection |
| ES2091976T3 (en) * | 1991-06-20 | 1996-11-16 | Hoffmann La Roche | PERFECTED METHODS FOR THE AMPLIFICATION OF NUCLEIC ACID. |
| US5445940A (en) | 1991-08-28 | 1995-08-29 | Brigham & Women's Hospital | Methods and compositions for detecting and treating a subset of human patients having an autoimmune disease |
| CA2120500A1 (en) | 1991-10-01 | 1993-04-15 | Mitsuaki Isobe | Preventing allograft rejection with antibodies to adhesion molecules |
| US5346994A (en) | 1992-01-28 | 1994-09-13 | Piotr Chomczynski | Shelf-stable product and process for isolating RNA, DNA and proteins |
| DE69207580T2 (en) | 1992-03-23 | 1996-08-08 | Hoffmann La Roche | Procedure for DNA detection |
| US5487970A (en) * | 1992-06-17 | 1996-01-30 | Arch Development Corp. | Compositions and methods for detecting gene rearrangements and translocations |
| GB2268935B (en) * | 1992-06-24 | 1996-10-23 | Nat Heart & Lung Inst | Diagnosis of rejection of transplanted organs |
| ES2194843T3 (en) * | 1992-09-11 | 2003-12-01 | Hoffmann La Roche | DETECTION OF NUCLEIC ACIDS IN BLOOD. |
| US5565339A (en) | 1992-10-08 | 1996-10-15 | Hoffmann-La Roche Inc. | Compositions and methods for inhibiting dimerization of primers during storage of polymerase chain reaction reagents |
| JP3615545B2 (en) * | 1993-02-01 | 2005-02-02 | キアゲン・エヌ・ブイ | Quaternary ammonium salt surfactant and its RNA isolator |
| US6403304B1 (en) * | 1993-04-06 | 2002-06-11 | Forsyth Dental Infirmary For Children | Human osteoclast-specific and -related DNA sequences |
| US5491086A (en) * | 1993-05-14 | 1996-02-13 | Hoffmann-La Roche Inc. | Purified thermostable nucleic acid polymerase and DNA coding sequences from pyrodictium species |
| US5837832A (en) | 1993-06-25 | 1998-11-17 | Affymetrix, Inc. | Arrays of nucleic acid probes on biological chips |
| US5426039A (en) * | 1993-09-08 | 1995-06-20 | Bio-Rad Laboratories, Inc. | Direct molecular cloning of primer extended DNA containing an alkane diol |
| US6045996A (en) * | 1993-10-26 | 2000-04-04 | Affymetrix, Inc. | Hybridization assays on oligonucleotide arrays |
| US5459037A (en) | 1993-11-12 | 1995-10-17 | The Scripps Research Institute | Method for simultaneous identification of differentially expressed mRNAs and measurement of relative concentrations |
| US5538848A (en) | 1994-11-16 | 1996-07-23 | Applied Biosystems Division, Perkin-Elmer Corp. | Method for detecting nucleic acid amplification using self-quenching fluorescence probe |
| EP0690673A4 (en) * | 1993-12-14 | 1996-05-29 | Univ Pittsburgh | Systemic gene treatment of connective tissue diseases |
| DK145393D0 (en) | 1993-12-23 | 1993-12-23 | Stig Haunsoe | PROTEIN MARKETS FOR THE PREVENTION OF ACUTE ALLOTRANGE PLANTS |
| US5811284A (en) | 1993-12-29 | 1998-09-22 | Schering Corporation | Nucleic acids encoding kp43 protein and antigenic fragments thereof |
| US5512462A (en) * | 1994-02-25 | 1996-04-30 | Hoffmann-La Roche Inc. | Methods and reagents for the polymerase chain reaction amplification of long DNA sequences |
| US6190872B1 (en) * | 1994-05-06 | 2001-02-20 | Gus J. Slotman | Method for identifying and monitoring patients at risk for systemic inflammatory conditions and apparatus for use in this method |
| US5807522A (en) | 1994-06-17 | 1998-09-15 | The Board Of Trustees Of The Leland Stanford Junior University | Methods for fabricating microarrays of biological samples |
| US5658744A (en) | 1994-07-22 | 1997-08-19 | The United States Of America As Represented By The Department Of Health And Human Services | Methods of identifying patients having an altered immune status |
| US6010847A (en) | 1994-08-18 | 2000-01-04 | Akzo Nobel N.V. | Oligonucleotides that can be used in the amplification and detection of CMV nucleic acid |
| US5491063A (en) * | 1994-09-01 | 1996-02-13 | Hoffmann-La Roche Inc. | Methods for in-solution quenching of fluorescently labeled oligonucleotide probes |
| US5571673A (en) | 1994-11-23 | 1996-11-05 | Hoffmann-La Roche Inc. | Methods for in-solution quenching of fluorescently labeled oligonucleotide probes |
| US5506145A (en) * | 1994-12-02 | 1996-04-09 | Bull; Brian S. | Determination of an individual's inflammation index from whole blood fibrinogen and hematocrit or hemoglobin measurements |
| US5968770A (en) | 1995-02-10 | 1999-10-19 | Millennium Pharmaceuticals, Inc. | Compositions and methods for the treatment and diagnosis of cardiovascular disease using rchd523 as a target |
| US6066322A (en) | 1995-03-03 | 2000-05-23 | Millennium Pharmaceuticals, Inc. | Methods for the treatment of immune disorders |
| DE69621507T2 (en) * | 1995-03-28 | 2003-01-09 | Japan Science & Tech Corp | Method for molecular indexing of genes using restriction enzymes |
| US6251597B1 (en) * | 1996-03-29 | 2001-06-26 | Millennium Pharmaceuticals, Inc. | Methods for detecting fohy030 |
| US5569583A (en) | 1995-04-25 | 1996-10-29 | Health Research Inc. | Rapid and sensitive detection of cytomegalovirus |
| US5635365A (en) * | 1995-08-07 | 1997-06-03 | Emory University | Noninvasive diagnosis for allograft rejection |
| US5773258A (en) | 1995-08-25 | 1998-06-30 | Roche Molecular Systems, Inc. | Nucleic acid amplification using a reversibly inactivated thermostable enzyme |
| US5665551A (en) | 1995-09-13 | 1997-09-09 | Roche Molecular Systems, Inc. | Purified nucleic acid encoding a thermostable pyrophosphatase |
| US7888466B2 (en) | 1996-01-11 | 2011-02-15 | Human Genome Sciences, Inc. | Human G-protein chemokine receptor HSATU68 |
| US5973137A (en) | 1996-02-13 | 1999-10-26 | Gentra Systems, Inc. | Low pH RNA isolation reagents, method, and kit |
| CA2247246A1 (en) * | 1996-02-16 | 1997-08-21 | Millennium Pharmaceuticals, Inc. | Compositions and methods for the treatment and diagnosis of cardiovascular disease |
| US6099823A (en) | 1996-02-16 | 2000-08-08 | Millennium Pharmaceuticals, Inc. | Compositions and methods for the treatment and diagnosis of cardiovascular disease |
| US5958342A (en) | 1996-05-17 | 1999-09-28 | Incyte Pharmaceuticals, Inc. | Jet droplet device |
| CZ293215B6 (en) | 1996-08-06 | 2004-03-17 | F. Hoffmann-La Roche Ag | Enzyme of thermally stable DNA polymerase, process of its preparation and a pharmaceutical composition and a kit containing thereof |
| US6146828A (en) | 1996-08-14 | 2000-11-14 | Exact Laboratories, Inc. | Methods for detecting differences in RNA expression levels and uses therefor |
| US6274312B1 (en) | 1996-12-11 | 2001-08-14 | Schering Corporation | Intracellular regulatory molecules; related reagents |
| US6060240A (en) * | 1996-12-13 | 2000-05-09 | Arcaris, Inc. | Methods for measuring relative amounts of nucleic acids in a complex mixture and retrieval of specific sequences therefrom |
| ATE280177T1 (en) | 1997-03-20 | 2004-11-15 | Hoffmann La Roche | MODIFIED PRIMERS |
| US6190857B1 (en) * | 1997-03-24 | 2001-02-20 | Urocor, Inc. | Diagnosis of disease state using MRNA profiles in peripheral leukocytes |
| US6090556A (en) | 1997-04-07 | 2000-07-18 | Japan Science & Technology Corporation | Method for quantitatively determining the expression of a gene |
| US5958688A (en) | 1997-04-28 | 1999-09-28 | The Trustees Of The University Of Pennsylvania | Characterization of mRNA patterns in neurites and single cells for medical diagnosis and therapeutics |
| US5994076A (en) | 1997-05-21 | 1999-11-30 | Clontech Laboratories, Inc. | Methods of assaying differential expression |
| US6010853A (en) * | 1997-05-29 | 2000-01-04 | Dana-Farber Cancer Institute | Siva genes, novel genes involved in CD27-mediated apoptosis |
| US6228628B1 (en) * | 1997-07-09 | 2001-05-08 | Roche Molecular Systems | Mutant chimeric DNA polymerase |
| AU9200398A (en) * | 1997-08-22 | 1999-03-16 | Yale University | A process to study changes in gene expression in granulocytic cells |
| US6187534B1 (en) * | 1997-09-24 | 2001-02-13 | Cornell Research Foundation, Inc. | Methods of evaluating transplant rejection |
| EP1027456B1 (en) * | 1997-10-31 | 2005-03-16 | Affymetrix, Inc. (a Delaware Corporation) | Expression profiles in adult and fetal organs |
| US6248528B1 (en) * | 1998-04-06 | 2001-06-19 | Millennium Pharmaceuticals, Inc. | Methods and compositions for the diagnosis and treatment of neuropsychiatric disorders |
| US6004755A (en) | 1998-04-07 | 1999-12-21 | Incyte Pharmaceuticals, Inc. | Quantitative microarray hybridizaton assays |
| US6048695A (en) * | 1998-05-04 | 2000-04-11 | Baylor College Of Medicine | Chemically modified nucleic acids and methods for coupling nucleic acids to solid support |
| US6218122B1 (en) * | 1998-06-19 | 2001-04-17 | Rosetta Inpharmatics, Inc. | Methods of monitoring disease states and therapies using gene expression profiles |
| CA2340884A1 (en) | 1998-08-25 | 2000-03-02 | Human Genome Sciences, Inc. | 49 human secreted proteins |
| US6410319B1 (en) * | 1998-10-20 | 2002-06-25 | City Of Hope | CD20-specific redirected T cells and their use in cellular immunotherapy of CD20+ malignancies |
| US6248527B1 (en) | 1998-10-21 | 2001-06-19 | Millennium Pharmaceuticals, Inc. | Method of detecting risk of type II diabetes based on mutations found in carboxypeptidase E |
| US6203987B1 (en) * | 1998-10-27 | 2001-03-20 | Rosetta Inpharmatics, Inc. | Methods for using co-regulated genesets to enhance detection and classification of gene expression patterns |
| US6194158B1 (en) * | 1998-11-12 | 2001-02-27 | Nyxis Neurotherapies, Inc. | Diagnostic assay for cancer |
| US6177254B1 (en) * | 1998-12-15 | 2001-01-23 | Jerome Bernard Rattner | Nucleolus autoantigenic marker for systemic lupus erthyematosus |
| US6222093B1 (en) * | 1998-12-28 | 2001-04-24 | Rosetta Inpharmatics, Inc. | Methods for determining therapeutic index from gene expression profiles |
| US6087112A (en) | 1998-12-30 | 2000-07-11 | Oligos Etc. Inc. | Arrays with modified oligonucleotide and polynucleotide compositions |
| US6303321B1 (en) | 1999-02-11 | 2001-10-16 | North Shore-Long Island Jewish Research Institute | Methods for diagnosing sepsis |
| US6150121A (en) | 1999-02-16 | 2000-11-21 | Wisconsin Alumni Research Foundation | Assessing immunological state of transplant recipients |
| US6280941B1 (en) | 1999-03-29 | 2001-08-28 | Cedars-Sinai Medical Center | Genetic marker test for lupus |
| US6242185B1 (en) * | 1999-04-01 | 2001-06-05 | Incyte Genomics, Inc. | Purified nucleic acid encoding transcription factor regulatory protein |
| US6162604A (en) | 1999-04-01 | 2000-12-19 | Jacob; Chaim O. | Methods for determining genetic predisposition to autoimmune diseases by genotyping apoptotic genes |
| US6245526B1 (en) * | 1999-05-26 | 2001-06-12 | Incyte Pharmaceuticals, Inc. | Lipid metabolism transcription factor |
| US6132997A (en) | 1999-05-28 | 2000-10-17 | Agilent Technologies | Method for linear mRNA amplification |
| US6168933B1 (en) * | 1999-06-08 | 2001-01-02 | Incyte Pharmaceuticals, Inc. | Phospholipid transfer protein |
| US6245527B1 (en) * | 1999-06-30 | 2001-06-12 | Millennium Pharmaceuticals, Inc. | Nucleic acid molecules encoding glycoprotein VI and recombinant uses thereof |
| US6555374B1 (en) | 1999-08-19 | 2003-04-29 | Artecel Sciences, Inc. | Multiple mesodermal lineage differentiation potentials for adipose tissue-derived stromal cells and uses thereof |
| US6225093B1 (en) * | 1999-09-07 | 2001-05-01 | Decode Genetics Ehf. | Detection of C4A deletion by long range PCR |
| WO2001038585A2 (en) | 1999-11-24 | 2001-05-31 | The Regents Of The University Of California | Polymer arrays and methods of using labeled probe molecules to identify and quantify target molecule expression |
| US20020090673A1 (en) * | 2000-01-31 | 2002-07-11 | Rosen Craig A. | Nucleic acids, proteins, and antibodies |
| US6900015B2 (en) * | 2000-04-24 | 2005-05-31 | Beth Israel Deaconess Medical Center, Inc. | Measurement of protective genes in allograft rejection |
| DE10021834A1 (en) | 2000-05-06 | 2001-11-15 | Lynx Therapeutics Gmbh | New mRNA indicative of T cell activation and functional status, useful for diagnosis and therapy e.g. of autoimmunity or transplant rejection |
| RU2270691C2 (en) | 2000-05-12 | 2006-02-27 | Бет Израел Диконесс Медикал Сентер, Инк. | Compositions and method for immunosuppression |
| EP1334113A4 (en) * | 2000-10-20 | 2007-08-08 | Expression Diagnostics Inc | Leukocyte expression profiling |
| JP2002300883A (en) | 2001-04-05 | 2002-10-15 | Jenokkusu Soyaku Kenkyusho:Kk | Method for testing steroid responsiveness |
| US7235358B2 (en) * | 2001-06-08 | 2007-06-26 | Expression Diagnostics, Inc. | Methods and compositions for diagnosing and monitoring transplant rejection |
| US7026121B1 (en) * | 2001-06-08 | 2006-04-11 | Expression Diagnostics, Inc. | Methods and compositions for diagnosing and monitoring transplant rejection |
| US6905827B2 (en) * | 2001-06-08 | 2005-06-14 | Expression Diagnostics, Inc. | Methods and compositions for diagnosing or monitoring auto immune and chronic inflammatory diseases |
| EP1410011B1 (en) * | 2001-06-18 | 2011-03-23 | Rosetta Inpharmatics LLC | Diagnosis and prognosis of breast cancer patients |
| WO2003004612A2 (en) | 2001-07-02 | 2003-01-16 | Yale University | Inhibitor of t cell activation |
| CN102402650A (en) | 2001-11-09 | 2012-04-04 | 生命技术公司 | Identification, monitoring and treatment of disease and characterization of biological condition using gene expression profiles |
| US20030225526A1 (en) | 2001-11-14 | 2003-12-04 | Golub Todd R. | Molecular cancer diagnosis using tumor gene expression signature |
| JP2005517637A (en) | 2001-11-29 | 2005-06-16 | セラコス・インコーポレイテッド | Methods for pretreatment of certain subjects with in vitro photophoresis and / or apoptosis cells |
| EP1319717A1 (en) * | 2001-12-11 | 2003-06-18 | Roche Diagnostics GmbH | Method for detection of inflammatory processes |
| AU2003212822A1 (en) * | 2002-01-22 | 2003-09-02 | Trustees Of The University Of Pennsylvania | Methods for determining drug responsiveness |
| DE10234524A1 (en) | 2002-07-24 | 2004-02-12 | Oligene Gmbh | Array of probes derived from monocyte-macrophage genes, useful e.g. for diagnosis, prognosis and therapeutic monitoring of rheumatoid arthritis and other inflammatory diseases |
| US7118865B2 (en) | 2002-08-16 | 2006-10-10 | Regents Of The University Of Minnesota | Methods for diagnosing severe systemic lupus erythematosus |
| US20070248978A1 (en) | 2006-04-07 | 2007-10-25 | Expression Diagnostics, Inc. | Steroid responsive nucleic acid expression and prediction of disease activity |
| US20060263813A1 (en) | 2005-05-11 | 2006-11-23 | Expression Diagnostics, Inc. | Methods of monitoring functional status of transplants using gene panels |
| WO2004108899A2 (en) | 2003-06-04 | 2004-12-16 | The Government Of The United States As Represented By The Secretary Of The Department Of Health And Human Services, Centers For Disease Control And Prevention | Pni microarray and uses |
| US20050281815A1 (en) | 2004-02-26 | 2005-12-22 | Dani Eshel | CD40 splice variants and their uses |
| US7645575B2 (en) * | 2004-09-08 | 2010-01-12 | Xdx, Inc. | Genes useful for diagnosing and monitoring inflammation related disorders |
| US7993832B2 (en) * | 2006-08-14 | 2011-08-09 | Xdx, Inc. | Methods and compositions for diagnosing and monitoring the status of transplant rejection and immune disorders |
-
2007
- 2007-11-09 WO PCT/US2007/023675 patent/WO2008140484A2/en active Application Filing
- 2007-11-09 US US11/938,227 patent/US8148067B2/en active Active
- 2007-11-09 EP EP20070874123 patent/EP2102367A2/en not_active Withdrawn
Non-Patent Citations (6)
| Title |
|---|
| BENNETT LYNDA ET AL: "Interferon and granulopoiesis signatures in systemic lupus erythematosus blood" JOURNAL OF EXPERIMENTAL MEDICINE, ROCKEFELLER UNIVERSITY PRESS, JP, vol. 197, no. 6, 17 March 2003 (2003-03-17), pages 711-723, XP002292183 ISSN: 0022-1007 * |
| CENTOLA M ET AL: "Genome-scale assessment of molecular pathology in systemic autoimmune diseases using microarray technology: a potential breakthrough diagnostic and individualized therapy-design tool." SCANDINAVIAN JOURNAL OF IMMUNOLOGY SEP 2006, vol. 64, no. 3, September 2006 (2006-09), pages 236-242, XP002516813 ISSN: 0300-9475 * |
| CROW MARY K ET AL: "Microarray analysis of gene expression in lupus." ARTHRITIS RESEARCH & THERAPY 2003, vol. 5, no. 6, 2003, pages 279-287, XP002516812 ISSN: 1478-6362 * |
| KIROU KYRIAKOS A ET AL: "Coordinate overexpression of interferon-alpha-induced genes in systemic lupus erythematosus." ARTHRITIS AND RHEUMATISM DEC 2004, vol. 50, no. 12, December 2004 (2004-12), pages 3958-3967, XP002516814 ISSN: 0004-3591 * |
| MANDEL M ET AL: "Gene expression studies in systemic lupus erythematosus" LUPUS, BASINGSTOKE, GB, vol. 15, no. 7, 1 July 2006 (2006-07-01), pages 451-456, XP008087445 ISSN: 0961-2033 * |
| RUS VIOLETA ET AL: "Expression of cytokine- and chemokine-related genes in peripheral blood mononuclear cells from lupus patients by cDNA array." CLINICAL IMMUNOLOGY (ORLANDO, FLA.) MAR 2002, vol. 102, no. 3, March 2002 (2002-03), pages 283-290, XP002516815 ISSN: 1521-6616 * |
Cited By (1)
| Publication number | Priority date | Publication date | Assignee | Title |
|---|---|---|---|---|
| US9617343B2 (en) | 2009-05-13 | 2017-04-11 | Genzyme Corporation | Methods and compositions for treating lupus |
Also Published As
| Publication number | Publication date |
|---|---|
| US20090298060A1 (en) | 2009-12-03 |
| US8148067B2 (en) | 2012-04-03 |
| WO2008140484A3 (en) | 2009-10-01 |
| EP2102367A2 (en) | 2009-09-23 |
Similar Documents
| Publication | Publication Date | Title |
|---|---|---|
| WO2008140484A2 (en) | Methods for diagnosing and monitoring the status of systemic lupus erythematosus | |
| US7771950B2 (en) | Methods and compositions for diagnosing and monitoring auto immune and chronic inflammatory diseases | |
| US7993832B2 (en) | Methods and compositions for diagnosing and monitoring the status of transplant rejection and immune disorders | |
| US7645575B2 (en) | Genes useful for diagnosing and monitoring inflammation related disorders | |
| US20100099098A1 (en) | Methods and compositions for diagnosing and monitoring transplant rejection | |
| WO2008051290A2 (en) | Steroid responsive nucleic acid expression and prediction of disease activity | |
| EP2909340B1 (en) | Diagnostic method for predicting response to tnf alpha inhibitor | |
| JP2010500038A (en) | Gene expression signatures in blood leukocytes enable differential diagnosis of acute infection | |
| WO2011006119A2 (en) | Gene expression profiles associated with chronic allograft nephropathy | |
| EP3041955A1 (en) | Compositions and methods for diagnosis and prediction of solid organ graft rejection | |
| EP2240601A2 (en) | Biomarkers for the prediction of renal injury | |
| JP2013526845A (en) | Genes and combinations of genes that predict an initial response or non-response of a subject suffering from an inflammatory disease to a cytokine targeted drug (CyTD) | |
| Gupta et al. | Long noncoding RNAs associated with phenotypic severity in multiple sclerosis | |
| EP2369016A1 (en) | Methods for diagnosing and treating graft rejection and inflammatory conditions | |
| WO2003016476A2 (en) | Gene expression profiles in glomerular diseases |
Legal Events
| Date | Code | Title | Description |
|---|---|---|---|
| NENP | Non-entry into the national phase |
Ref country code: DE |
|
| WWE | Wipo information: entry into national phase |
Ref document number: 2007874123 Country of ref document: EP |
|
| 121 | Ep: the epo has been informed by wipo that ep was designated in this application |
Ref document number: 07874123 Country of ref document: EP Kind code of ref document: A2 |