This application is a continuation-in-part of application Ser. No. 08/060,214, filed on May 7, 1993, issued as U.S. Pat. No. 5,346,306 which is a continuation of application Ser. No. 07/844,448 (the "parent application"), filed Mar. 2, 1992, issued as U.S. Pat. No. 5,224,775. Both applications are incorporated by reference herein.
The appendices to this application contain material which is subject to copyright protection. The copyright owner has no objection to the facsimile reproduction by anyone of the patent document or the patent disclosure, as it appears in the Patent and Trademark Office patent file or records, but otherwise reserves all copyright rights whatsoever.
BACKGROUND
1. Field of the Invention
The present invention relates to differential analytical techniques for determining the composition, phase, structure, or other properties of a sample of material.
2. Background of the Invention
Dynamic differential scanning calorimetry ("DDSC"), introduced by TA Instruments as modulated differential scanning calorimetry™ ("MDSC™"), and described in U.S. Pat. No. 5,224,775 (the "'775 patent"), has proved to be a major advance in Differential Scanning Calorimetry ("DSC"). It improves the accuracy of DSC and significantly increases the amount of information that can be deduced from DSC data.
DYNAMIC DSC
In DDSC, a rapid heating rate oscillation is added to a conventional linear temperature ramp. If the heating rate oscillation has a low amplitude but a high frequency, then it is possible to obtain a relatively high instantaneous heating rate even though the underlying heating rate is comparatively low. The heat flow to and from the sample is recorded, and then deconvoluted into rapidly reversible and non-rapidly reversible components.
FIG. 1 is a schematic diagram of TA Instruments' DDSC (or MDSC™) apparatus which is described in more detail in U.S. Pat. No. 5,224,775. Apparatus 111 comprises a sample pan 112; reference pan 113; sample temperature thermocouple 114; reference temperature thermocouple 115; thermoelectric disc 116; purge gas inlet 117; purge gas outlet 118; electric furnace 119 comprising silver block heater 120, silver ring 121, silver lid 122, and heater thermocouple 123; furnace chamber 124; heater controller 125; analog-to-digital converter 126; and microcomputer 127. It also comprises a personal computer 110 and digital plotter 109.
The differential scanning calorimeter measures the heat flow difference between sample pan 112 and reference pan 113, which are supported by a thermoelectric disc 116 inside a closed furnace chamber 124. The thermoelectric disc 116 serves as the major heat flow path for transferring heat from furnace 119 to sample pan 112 and reference pan 113. The disc is also used as the common material of the differential thermocouple for measuring the temperature difference between the sample and reference pans. Microcomputer 127 receives differential temperature and sample temperature from sample thermocouple 114 and reference thermocouple 115 via analog-to-digital converter 126. Microcomputer 127 also controls the temperature of the furnace 119 by controlling the power to the furnace using heater controller 125.
Personal computer 110 and digital plotter 109 are used to analyze, store, display and plot the analytical results. A purge gas is usually introduced via the purge gas inlet. The purge gas can be a gas that reacts with constituents of the sample being analyzed, or it can be an inert gas, i.e., a gas that does not react with the sample used to prevent reactions with air. Typical purge gases include dry air, oxygen, nitrogen, argon, helium, carbon monoxide and carbon dioxide.
DEFINITIONS
"Transition" or "Transformation", as used herein, mean any type of physical or chemical transformation, phase change, or structural change in a material.
"Analyzing", as used herein with respect to materials, means determining the composition, phase, structure, and/or identification of the material.
"Rapidly reversible", as used herein, means any portion of a signal, transition, or event which is a direct function of the rate of change of temperature. For example, the contribution to the heat flow signal in DSCs attributable to the rate of change of temperature of the sample material is a rapidly reversible transition. In DSC, for example, one of the contributions to the rapidly reversible portion of the heat flow signal is the heat capacity of the sample material. Rapidly reversible processes include those processes which are thermodynamically reversible and have small kinetic time constants relative to the rate of change of the driving variable.
"Non-rapidly reversible", as used herein, means any portion of a signal, transition or event which is a direct function of the value of the temperature. For example, the contribution to the heat flow signal in DSC attributable to the absolute temperature of the sample material is a non-rapidly reversible transition. This might be caused by a chemical or physical change taking place such as recrystallization. Non-rapidly reversible processes include those processes which are thermodynamically irreversible, as well as processes which are thermodynamically reversible, but which reverse very slowly relative to the rate of change of the driving variable due to the kinetic limitations of the process.
"Deconvolution" as used herein, means the process of separating the dependence of, e.g., heat flow in a differential scanning calorimeter, into one or more component parts so that the component parts can be utilized or analyzed separately, or compared with each other. For example, in DSCs, the dependence of heat flow on temperature can be deconvoluted into rapidly reversible and non-rapidly reversible components.
"Parset", as used herein, is a part-cycle of data.
SUMMARY OF THE INVENTION
The present invention enhances the interpretation of DDSC data by parsing the DDSC data into shorter sections or "parsets" of data depending upon the conditions that the sample is experiencing at any given moment in time. These parsets of data can then be analyzed individually to give a more accurate interpretation of the sample response to the DDSC temperature program.
In the first preferred embodiment of the present invention, the heat flow data is parsed according to whether it is obtained while the sample is being heated, cooled, or reheated. In the second preferred embodiment of the present invention, the heat flow data is parsed according to whether the cyclic component of the modulated heat flow data is positive or negative. In the third preferred embodiment of the present invention, the heat flow data is parsed depending upon whether the cyclic component of the temperature is positive or negative. In a fourth preferred embodiment of the present invention, the heat flow data is parsed according to whether the cyclic component of the derivative of the modulated temperature is positive or negative.
Each of the four preferred embodiments of the present invention can be applied to DDSC data obtained using a single modulation frequency ("standard DDSC") or to DDSC data using two or more modulation frequencies ("multiplexed DDSC"). Multiplexed DDSC can provide, in a single measurement, data showing the response of a sample to two (or more) different modulation frequencies. Thus it increases the throughput of a DDSC instrument, by using one DDSC run to obtain data that would otherwise require separate runs at each of the different modulation frequencies. Moreover, in some cases, the type of data that can be obtained from a single multiplexed DDSC measurement would not be obtainable from separate sequential DDSC measurements.
The first preferred embodiment of the present invention is shown in FIGS. 2a-2d. As shown in FIGS. 2a-2d, each DDSC scan is split up into three separate components depending upon whether the sample is undergoing heating, cooling or re-heating. The relative size of the heating, cooling and re-heating components is determined by the profile of the modulated temperature (i.e., by the DDSC parameters set by the operator). Once these three components have been isolated, they can each be analyzed individually to investigate the sample response to temperature change under each of these different regimes.
Computer programs implementing the first preferred embodiment of the present invention in Microsoft Qbasic are included at Appendix A. The first program (the "parsing program") splits the data into three separate files (heating, cooling and re-heating) by comparing the temperature at an instant with the previous recorded temperature. The parsing program contains a short "memory" to remove any ambiguity when two adjacent temperature values are the same. The second program (the "deconvolution program") deconvolutes the data in each file into rapidly reversible and non-rapidly reversible components. The programs implement the present invention in QuickBasic. The programs are:
1/ TEMPAR1.BAS--Queries the user for the parsing method and works upon two report files written from the module controller. The first file should contain Time(s), Modulated Temperature (°C.) and Underlying Temperature (°C.) and Derivative of Modulated Temperature (°C./s). The second file should contain Time(s), Derivative of the Average Temperature (°C./s), Modulated Heat Flow (mW) and Average Heat Flow (mW). The 1.5 cycle data delay induced by the DDSC software in the average signals is removed and then the data are subtracted from their respective modulated signals to leave the cyclic components. The output file consists of Time, Mod Temp, Cyclic Mod Temp, Cyclic deriv Mod Temp, Cyclic Mod Heat Flow.
2/ TEMPAR2.BAS--Works upon the output from TEMPAR1. The data is split into 3 separate files according to whether the sample is being heated, cooled or reheated. It works by comparing the Modulated Temperature at an instant with the previous temperature and it has a short `memory` to remove the ambiguity when two adjacent values are the same.
3/ TEMPAR3.BAS--Works upon the three output files in turn from TEMPAR2. It loads in one parset of data at a time and performs a linear regression on the Cyclic Deriv Mod Temp and the Cyclic Mod Heat Flow data. It then moves the Cyclic Mod Heat Flow data forward by one step in time and recalculates the line of best fit. This process continues until the phase difference is resolved (the relationship becomes as linear as possible--calculated by a least square fit). Time, parset number, gradient, intercept and phase lag are written to a file ready for analysis in LOTUS 1-2-3.
4/ CMTPAR2.BAS--Works upon the output from TEMPAR1. The data is split into 2 files depending upon whether the cyclic component of the modulated temperature is positive or negative at any moment in time, i.e., whether the sample experiences above average or below average heating rates.
5/ CDTPAR2.BAS--Works on the output from TEMPAR1. Parses as in CMTPAR2 except it depends upon the Cyclic derivative of modulated temperature.
6/ CHFPAR2.BAS--As CMTPAR2 except it parses according to Cyclic Heat Flow being positive or negative.
7/ CYCPAR3.BAS--Works upon the output from any of the above three programs. It calculates the heat capacity and phase lag data using the same principles as TEMPAR3 but the main program loop is executed twice rather than three times.
Computer programs implementing all four preferred embodiments of the present invention in Microsoft Qbasic are included at Appendix B.
Deconvolution
When the different components are contained in separate files, each file can be separately deconvoluted. However, the conventional DDSC deconvolution program cannot be used with the present invention, because it needs one and a half complete cycles of raw data to deconvolute each data point. The following shows how part-cycles of DDSC heat flow data can be deconvoluted.
The fundamental equation describing the response of a sample to a DDSC heating program is: ##EQU1## where: dQ/dt is the modulated heat flow;
(b+Aω Cos (ωt)) is the derivative of the modulated temperature, i.e., the measured quantity dT/dt;
Cp is the heat capacity;
f(t,T) is a function of time and temperature that governs the kinetic response of a physical or chemical transformation; and
f'(t,T) is f(t,T) averaged over the modulation period.
The equation for the underlying heat flow response to the modulated heating program is: ##EQU2## This underlying heat flow is equivalent to the heat flow obtained using conventional differential scanning calorimetry.
The underlying heat flow is subtracted from the modulated heat flow to calculate the cyclic component of the heat flow: ##EQU3## where (Aω cos (ωt)) is the cyclic derivative modulated temperature. C sin (ωt) is the kinetic response to the temperature modulation. This quantity is often insignificant in comparison to the signal arising from Cp.
In principle, the cyclic derivative of the modulated temperature and the cyclic heat flow are sinusoidal. There is a phase lag between these two signals as a consequence of both the effect of the kinetic response C sin (ωt) (when present) and the response time of the calorimeter. FIG. 3 is a plot of the cyclic heat flow signal versus time. As shown by FIG. 4, the phase lag causes the cyclic -dT/dt v. cyclic heat flow plot to be a curve, instead of a straight line. If one of the signals is shifted in such a way as to eliminate this phase lag, a plot of -dT/dt against dQ/dt will be a straight line. The slope of this straight line should be either (1) proportional to the sample's heat capacity when there is no significant kinetic effect, or (2) proportional to the apparent heat capacity when such an effect is present.
When taken over a whole cycle, this deconvolution technique is equivalent to the Fourier transform deconvolution technique described in U.S. Pat. No. 5,224,775. However, unlike that deconvolution technique, this technique can also be applied to any fraction of a modulation cycle, or to any set of data, irrespective of whether the data is distributed evenly over time.
As discussed above, the linearity of the data which appears as a curve in FIG. 4 can be improved by shifting the cyclic heat flow signal with respect to the cyclic -dT/dt signal. FIG. 5 shows the data of FIG. 4 shifted to partially improve its linearity. FIG. 6 shows how the data of FIG. 4 can be plotted as a straight line by optimally shifting the cyclic heat flow signal with respect to the cyclic -dT/dt signal.
The optimum shift is determined as follows:
1. Calculate the least squares fit of the first part-cycle of data (or parset) to a straight line, by subjecting the data (in its original form) to a linear regression.
2. Advance the cyclic heat flow data forwards by one step in time, i.e., by one data sampling interval.
3. Calculate the least squares fit of the shifted data to a straight line.
4. If the linearity of the data is improved, advance the cyclic heat flow data an additional sampling interval.
5. Continue calculating least squares fits and advancing the data (as in the example shown in FIG. 5) until the plot is as linear as possible (as in the example shown in FIG. 6). The slope or gradient of the line of best fit is now proportional to the heat capacity of that parset of data. This process is repeated for every parset in the data file.
This analysis is carried out for each heating, cooling and re-heating file, resulting in three additional files, each containing five columns of information: Initime, Sectn, Grad, Intcpt, Phase.
Initime: The real time of the first data point in each parset.
Sectn: The index number of the parset being analyzed.
Grad: The slope or gradient of line of best fit (i.e., the heat capacity for that parset).
Intcpt: The intercept of the line of best fit.
Phase: The phase lag for that parset.
Computer programs implementing this technique are included herein at Appendix A.
Generally, three measurements are carried out: one with an empty sample pan, one with a reference material (e.g., sapphire) in the sample pan, and one with a sample material in the sample pan. Each measurement is analyzed as described above. The apparatus is then calibrated (to correct for the heat capacity of the empty sample pan) by subtracting the heat capacities obtained with the reference material in the sample pan from the known values of the heat capacities of the reference material over the whole temperature range. Each point in the sample measurement is then multiplied by the calibration constant for that temperature to calculate the actual heat capacity of the sample at that temperature.
The present invention can be used to investigate the kinetics and thermodynamics of polymers during the melting and rearrangement of metastable crystallites. It can also be used to investigate transitions in other materials.
Accordingly, it is an object of the present invention to improve the understanding of transitions in polymers and other materials by parsing data obtained using a dynamic differential scanning calorimeter into separate subsets, depending upon the temperature conditions (described above) the sample was experiencing while the data was obtained.
It is another object of the present invention to improve the understanding of transitions in polymers and other materials by parsing data obtained using a dynamic differential scanning calorimeter into separate subsets, depending upon whether the data was obtained during heating, cooling or reheating of the sample.
It is another object of the present invention to improve the understanding of transitions in polymers and other materials by parsing data obtained using a dynamic differential scanning calorimeter into separate subsets, depending upon whether the data was obtained while the cyclic component of the modulated heat flow data was positive or negative.
It is another object of the present invention to improve the understanding of transitions in polymers and other materials by parsing data obtained using a dynamic differential scanning calorimeter into separate subsets, depending upon whether the data was obtained while the cyclic component of the temperature was positive or negative.
It is another object of the present invention to improve the understanding of transitions in polymers and other materials by parsing data obtained using a dynamic differential scanning calorimeter into separate subsets, depending upon whether the data was obtained while the cyclic component of the derivative of the modulated temperature was positive or negative.
BRIEF DESCRIPTION OF THE FIGURES
FIG. 1 is a schematic block diagram of a DDSC apparatus.
FIG. 2a is a plot of the temperature of an DDSC run, showing how the temperature is broken down into heating, cooling and re-heating components.
FIG. 2b is a plot of the heating component of the DDSC run shown in FIG. 1.
FIG. 2c is a plot of the cooling component of the DDSC run shown in FIG. 1.
FIG. 2d is a plot of the re-heating component of the DDSC run shown in FIG. 1.
FIG. 3 is a plot showing the cyclic heat flow through the melting peak of PET.
FIG. 4 is a plot of one parset of data, prior to correcting the data for instrumental phase lag.
FIG. 5 is a plot of one parset of data, partially corrected for instrumental phase lag.
FIG. 6 is a plot of one parset of data, fully corrected for instrumental phase lag.
FIG. 7 is a plot of empty sample pan DDSC data as calculated by parsing and second order polynomial fits.
FIG. 8 is a plot of empty sample pan data obtained using conventional DDSC.
FIG. 9 is a plot of empty sample pan phase lag data.
FIG. 10 is a plot of parsed sapphire heat capacities.
FIG. 11 is a plot of sapphire heat capacity and heat flow obtained using conventional DDSC.
FIG. 12 is a plot of phase lag data for sapphire and PET.
FIG. 13 is a plot of PET data obtained using conventional DDSC.
FIG. 14 is a plot of parsed PET heat capacities.
FIG. 15 is a comparison of calibrated PET heat capacity data with ATHAS recommended values.
FIG. 16 is a plot of the heat capacities of an empty sample pan.
FIG. 17 is a baseline plot of heat capacity and heat flow.
FIG. 18 is a plot of the heat capacities of a sapphire disk on heating, cooling and reheating.
FIG. 19 is a plot of the heat flow and heat capacity of a sapphire disk.
FIG. 20 is a plot of the heat flow and heat capacity of a PET sample.
FIG. 21 is a plot of the heat capacities of a sample of quenched PET on heating, cooling and reheating.
FIG. 22 is a comparison of parsed and literature data of the heat capacity of PET as a function of temperature.
FIG. 23 is a plot of phase lag data of quenched PET on heating, cooling and reheating.
FIG. 24 is a plot of the modulated temperature and the derivative of the modulated temperature used in Example 3.
FIG. 25 is a plot of the heat capacities and phase lag of quenched PET parsed according to cyclic modulated temperature.
FIG. 26 is a plot of the heat capacities and phase lag of quenched PET parsed according to cyclic heat flow.
FIG. 27 is a plot of the heat capacities and phase lag of quenched PET parsed according to cyclic derivative modulated temperature.
FIG. 28 is a plot of a multiplexed temperature profile and the derivative of the modulated temperature.
FIG. 29 is a plot of another multiplexed temperature profile and corresponding sample response.
FIG. 30 is a plot of multiplexed data and once-deconvoluted data.
FIG. 31 is a plot of the data of FIG. 30 after a second deconvolution.
FIG. 32 is a plot of the cyclic component of the primary modulation.
FIG. 33 is a plot of the primary modulation heat capacity.
FIG. 34 is a plot of the heat capacity after removal of the secondary period.
FIG. 35 is a comparison of the primary and secondary modulation heat capacities.
FIG. 36 is a comparison of the primary and secondary modulation heat capacities after calibration.
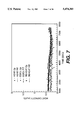
FIG. 37 shows that the noise problem increases significantly at 100° C. (if an insufficient number of significant figures is retained).
DETAILED DESCRIPTION OF THE INVENTION
Cooling a sample during a melt changes the type of results that are obtained by introducing an asymmetry in the response of the sample. Under these conditions, the standard DDSC deconvolution approach is invalid. However, it is not always possible to avoid cooling if a good signal to noise ratio is required. Parsing overcomes this problem and provides additional information about the sample and its propensity to supercool. It therefore has very general applicability and should be routinely used to check that an measurement contains no asymmetry, and to show that results obtained using Discrete Fourier transforms are valid.
General Observations
The present invention will be described in detail using the examples below. The following comments apply generally to all the embodiments of the present invention described in the examples.
Because the analysis method `loses` data points as the Cyclic Heat Flow column is moved forward in time, if there are not a sufficient number of data points, the linear fit will always improve whether or not the phase lag is being removed. To make sure that this does not occur, the data parsets must be as large as possible, with equal amounts of heating, cooling and reheating in each cycle. This limitation is not as severe in the Cyclic Parsing methods, because in those methods the data is split up symmetrically.
Also, analysis of each parset results in only one data point. Thus it results in a decrease in resolution of the processed data. In principle, alternative methods of analyzing parsed data are possible. However, the Linear Regression/Least Square Fit method illustrated herein as provided the best results.
Calibration
The measurements in the examples described below were calibrated by running separate Empty Pan and Sapphire Disk measurements under identical conditions to the Sample run. The Empty Pan measurement was run first, with the lid uncrimped so that the same pan could be used in all three runs. This eliminated any errors that might have arisen from using non-uniform sample pans. For the second measurement the lid is removed and a sapphire disk (60.637 mg) was placed in the pan, the lid being replaced on top. Finally the sapphire was removed and the sample was put in its place. A flat and thin sample was selected--the quenching process described below involved flattening the sample with the lid while it was isotherming in the melted state.
To calculate the response of the sample (and sapphire) only, the baseline data from the Empty Pan measurement was subtracted from the results of the other two measurements. The resulting sapphire data was compared to a polynomial fit of its literature values over the whole temperature range. The results were used to calculate individual calibration constants for every data point of the measurement. The sample data was then multiplied by these constants to give the final calibrated results.
EXAMPLE 1
The First Preferred Embodiment
The first preferred embodiment of the present invention, implemented using the programs listed in Appendix A, is illustrated in this example, with three DDSC runs. The first run was carried out using an empty sample pan, the second run was carried out using a sapphire sample, and the third run was carried out using a sample of poly(ethylene terephthalate) ("PET"). The empty pan and sapphire runs served to calibrate the method. The third run is an example of the actual use of parsed DDSC to obtain heat capacities parsed according to whether the sample was being heated, cooled or re-heated.
All DDSC runs were carried out on a TA Instruments DSC2910 Differential Scanning Calorimeter operating with a 25 cc/min Helium purge. The PET sample used was approximately 16 mg. of ICI MELINEX PET which was quenched by rapid cooling to room temperature from a ten-minute isotherm at 270° Celsius. It was then analyzed over the temperature range from -30° C. to 330° C., at an underlying heating rate of 3° C./min.
The modulation parameters which were found to be most useful for measuring the heat capacities of PET were a period of 80 seconds (the maximum obtainable on TA Instruments' DSC2910 DSC) and a programmed amplitude of 2° C. The programmed amplitude of 2° C. was not fully achieved by the DSC cell. The empty pan and sapphire disk runs were carried out using the same modulation parameters as the PET run.
The following data was recorded during each run: time (in seconds), modulated temperature (in °C.), modulated heat flow (in mW), underlying heat flow (in mW) and the derivative of the modulated temperature with respect to time (in °C./second). When a run was completed the data was converted to ASCII format, and then imported into LOTUS 1-2-3. The underlying heat flow data was subtracted from the modulated heat flow data (after correcting for the one and a half cycle delay induced by the DDSC deconvolution program) to provide the cyclic heat flow data, as shown in FIG. 3. The five columns of data (time, modulated temperature, cyclic heat flow and the derivative of the modulated temperature) were then exported from LOTUS 1-2-3 as another ASCII file. The data was then ready to be parsed.
The apparatus was calibrated to correct for the heat capacity of the empty sample pan by subtracting the empty sample pan run data from the sapphire run data, and then comparing the net sapphire data to literature values for sapphire over the whole temperature range. A calibration factor was thus obtained for every point in the PET measurement--each point in the PET data was multiplied by the calibration factor to obtain the actual measured PET heat capacities.
The heating, cooling and reheating components of the heat capacity obtained for the empty pan are shown in FIG. 7. These three components are very similar to each other, and their absolute values are comparable to the standard DDSC heat capacity calculated using the deconvolution algorithm disclosed in the parent application, shown in FIG. 8 (see Table 8). Second-order polynomials were then fitted to each of the three heating, cooling and re-heating empty-pan heat capacity data sets.
The phase lag measurements, shown in FIG. 9, exhibit excessive noise (in an ideal instrument, the phase lag would be zero over the whole temperature range). The noise in the empty sample phase lag data is high because the heat flow is low when the sample pan is empty. Thus any small anomalies have a disproportionate effect on the fitting algorithm. However, these errors do not have a very significant effect on the heat capacity measurements.
The data from the run with sapphire in the sample pan were then similarly reduced. The results are shown in FIGS. 10 and 11. The three components are again very similar to each other, and have the same value as the heat capacity of sapphire obtained using conventional DDSC. The sapphire data was also fitted to second order polynomials. The phase lag data is shown in FIG. 12. Like the empty pan phase lag data, the sapphire phase lag data is relatively noisy.
The raw data from the run with PET in the sample pan, reduced using conventional DDSC techniques, is shown in FIG. 13 (see Table 13). A recrystallization peak can be seen in the heat flow data but not in the heat capacity data. The raw data was then reduced according to the present invention, i.e., it was parsed, analyzed and then calibrated over the whole temperature range using the polynomials calculated from the empty pan and sapphire runs. The resulting plots are shown in FIGS. 14 and 15. There is excellent agreement of the heating, cooling and reheating components within the glassy temperature range and within the melt temperature range. The observed values compare very favorably with the ATHAS recommended literature heat capacity values. The excellent agreement with the ATHAS values serves to justify the calibration methodology.
However, the most interesting feature is apparent in the transition from the solid state to the melted state at approximately 250° C. There is a considerable difference in the observed heat capacity at the solid-to-melt transition according to whether the PET sample is being heated, cooled, or re-heated. Thus the present invention can be a powerful tool for characterizing materials and classifying transitions.
EXAMPLE 2
The First Preferred Embodiment
This example illustrates the first preferred embodiment of the present invention, implemented using the programs listed in Appendix B. In this example, a helium purge of 25 cc/min was used to increase the accuracy of the heat capacity measurements. The sample was 16,934 mg of ICI Melinex PET which had been quench cooled to room temperature after a 10 minute isotherm at 270° C. It was analyzed from -30° to 330° C., ramping at 3° C./minute with modulation period 80 s and amplitude 2° C. The period used is the maximum permitted by the DSC2910 control software to ensure that there are as many points as possible in each cycle. The amplitude was set high so that each parset (heating, cooling or reheating) contained approximately the same number of points. Identical Empty pan and Sapphire runs were previously recorded to use in calibration.
The results for the empty pan run are shown in FIG. 16. The corresponding results calculated using the standard DDSC algorithm are shown in FIG. 17 (see Table 17). Heating, cooling and reheating give very similar results and they compare well with the conventional data. The three data sets were fitted to second order polynomials in preparation for calibration. Analysis of the sapphire measurement gave FIG. 18 and FIG. 19 (see Tables 18 and 19). Again the three components are very similar to one another and compare well with the standard results. The data sets were also fitted to second order polynomials for the calibration.
The data from the PET measurement without parsing is shown in FIG. 20 (see Table 20). A recrystallization peak is apparent in the heat flow data but not in the heat capacity data. The raw data was parsed, analyzed using the Qbasic programs and then calibrated over the whole temperature range using the polynomials calculated from the previous two measurements. The resulting plots show some interesting features (FIG. 21 and FIG. 22). As in the first example, there is an excellent agreement of the heating, cooling and reheating components within the glassy (-30 to 60° C.) and the melt (270° to 330° C.) regions of the temperature range. The observed values in these regions compare very favorable with the ATHAS recommended literature values, proving that the methods of analysis and calibration are valid. However, the most interesting feature is the difference in the heat capacities between the recrystallization temperature and the melt. There is a considerable asymmetry between the three different components--it is clear that the observed heat capacity is dependent upon whether the sample is being heated, cooled or reheated. The heat capacity is much higher when the sample is undergoing heating. The Phase Lag data which is calculated inherently when determining the heat capacity values is shown in FIG. 23. The data is very noisy and hence of limited usefulness but the same basic features are apparent agreement of the heating, cooling and reheating values except in the melt where they are very different. It is also that the Cooling phase actually decreases through the melt showing that the process is exothermic.
EXAMPLE 3
The Second, Third and Fourth Preferred Embodiments
The second, third and fourth preferred embodiments of the present invention were implemented using a sample of quenched PET over the temperature range 130° to 330° C. at 5° C./min with a modulation period of 30 seconds and an amplitude of 0.2° C. The heating rate and modulation parameters were chosen such that the sample only undergoes heating.
The results are shown in FIG. 25, FIG. 26 and FIG. 27 (see Tables 26 and 27). Again, there is good agreement and symmetry above the melting peak. However, in this Example the agreement extends from the recrystallization temperature through to the melt as well. This trend is especially apparent in the Phase Lag data when compared to the measurement shown in Example 2. The heat capacity data, however, shows that the result is not perfectly symmetrical, although it exhibits great improvement compared to the measurement of Example 2, in which the sample was allowed to cool.
EXAMPLE 4
Multiplexed DDSC Theory
The heat flow in a standard DDSC measurement is given by: ##EQU4## where: dQ/dt is the modulated heat flow;
b+Aω Cos ωt is the derivative of the modulated temperature;
f"(t,T) is the average underlying kinetic function;
Cp is the heat capacity;
C is the amplitude of the kinetic response to the sine wave modulation.
The first two terms are measured quantities. The third term is automatically removed during the deconvolution process. This leaves the last two terms as the unknowns in the heat flow equation. Because there are two modulations in a multiplexed measurement, there will be two sets of equations. The unknown values can therefore be calculated from the simultaneous equations, including the amplitude C of the kinetic response to the sine wave modulation. This analysis should increase the understanding of kinetics during melting of semi-crystalline polymers. Because the two equations are obtained from the same measurement (and sample), the scope for error in these analyses is greatly reduced.
Also, frequency dependent heat capacities obtained at two or more frequencies can be extrapolated to the theoretical value for an infinitely high modulation frequency. This would then provide the true baseline for this type of melting.
Programming Multiplexed DDSC
Examples of multiplexed DDSC temperature profiles are shown in FIGS. 28 and 29 (see Tables 28 and 29). The primary modulation was controlled using the method editor on a TA Instruments Thermal Analyst 2000. The secondary modulation parameters were set using special Q-commands which allow direct communication with the module itself. These commands are set as multipliers of the primary modulation parameters. For example, when the primary modulation period is set at 30 seconds and the period Q-command is set at 3, then the secondary modulation period would be 90 seconds.
In some cases the parameters chosen require the cell to operate under extreme conditions, i.e., short periods and high amplitudes. In those cases, helium must be used as a purge gas, because it is a much better conductor of heat than nitrogen. Helium also has the added advantage of reducing any thermal conductivity errors that may be present due to the size and shape of the sample.
The data was converted to ASCII format using the TAGET and TAB2A commands available in RMX File Utilities. It was then imported into LOTUS 1-2-3 where the required data, Time (seconds), Modulated Temperature (°C.) and Modulated Heat Flow (mW), were selected and printed to another file for analysis.
The analysis program was developed using standard DDSC deconvolution software. In the program, the modulations are smoothed out over a complete cycle to provide the underlying signals and the amplitudes of these modulations are used along with a generated reference sine angle to calculate the heat capacity data. These processes are contained within the following four sub-programs:
1/ FTMPLX1.BAS--This sub-program uses the Lotus file containing Time (seconds), Multiplexed Temp (°C.) and Multiplexed Heat Flow (mW). It queries the user for the experimental and analysis parameters and then averages the multiplexed signals at the primary (shorter) modulation period to leave the secondary (longer) period modulation (FIG. 30; Table 30). The irregular form of the Heat Flow data is explained below.
2/ FTMPLX2.BAS--This sub-program uses the output from FTMPLX1. It averages at the secondary modulation period to obtain the underlying data. A Reference Sine Angle is generated and from the secondary modulation Temperature and Heat Flow amplitudes it calculates the Heat Capacity. Time, Underlying Temperature, Underlying Heat Flow and Heat Capacity are written to a file at user defined intervals ready for analysis in a LOTUS spreadsheet (FIG. 31; Table 31).
3/ FTMPLX3.BAS--This sub-program uses the original LOTUS file and the output from FTMPLX1. It checks the alignment in time of the two files and then proceeds to subtract the secondary modulation Temperature and Heat Flow data from the respective multiplexed data. This leaves the cyclic component of the primary modulation (FIG. 32; Table 32) which is also combined with a generated Reference Sine Angle to calculate the Temperature and Heat Flow amplitudes and hence the primary modulation Heat Capacity (FIG. 33; Table 33).
4/ FTMPLX4.BAS--This sub-program uses the output from FTMPLX3. The primary modulation Heat Capacity contains a dependence upon the secondary modulation so this program averages again over the longer modulation period. Time, Averaged Heat Capacity and the Amplitude of this dependence are written to a file at the user defined intervals for analysis in the LOTUS spreadsheet (FIG. 34; Table 34).
Analysis of the primary modulation showed a dependence upon the secondary (longer) modulation period which necessitated the final Fourier transform process, i.e., the primary heat capacity is averaged over the secondary period to get the smooth results. This allows access to the amplitude of this dependence. The results, as shown in FIG. 34 (see Table 34), show a near zero dependence over the whole temperature range with the exception of the melt and possibly the glass transition. This observation is surprising and demonstrates that there may be information present in a multiplexed measurement that cannot be obtained from two separate DDSC measurements.
Data Collection Rate
If the data collection rate of the instrument is not consistent, such that the Fourier transform analysis of the data does not take place over precise modulation cycles, the resulting data is distorted, as shown in FIG. 30 (see Table 30). The magnitude of this distortion depends upon the data collection rate and the period as set by the operator and is not significant in standard DDSC measurements. For example, it is of the order of up to 1 second/cycle in a 40 second period measurement with a data sampling rate of 2 seconds/point. Fourier transforming a single modulation produces a `straight` line with comparatively slow changes in magnitude, in which any slight variations from the ideal are not noticeable.
In Multiplexed measurements this error becomes significant because the result of the Fourier transformation is a rapidly changing sine wave signal which amplifies the effect of any slight irregularities. Because the primary modulation is calculated from the multiplexed data minus the distorted secondary modulation data, the errors are carried through and could generate noise in the primary heat capacity data.
As shown in the Figures discussed below, the heat capacities obtained using multiplexed DDSC agree with each other, but not with the ATHAS recommended literature values.
Applications
The advantage of multiplexing is that it enables the investigator to study the sample response to more than one frequency in a single measurement. This not only saves time but also avoids discrepancies that might arise from differences between different samples. Our evidence to date suggests melting transitions are strongly frequency dependent whereas other transitions are not. This is clearly evident in the PET example shown in FIGS. 35 and 36 (see Tables 35 and 36). This additional information is useful, therefore, in assigning events and more clearly delineating where a melting event starts.
Multiplexed DDSC Measurements
Multiplexed DDSC measurements were carried out on a TA Instruments DSC2910 Differential Scanning Calorimeter. The sample was 16.934 mg of ICI Melinex PET which had been quench cooled after isotherming at 270° C. for 10 minutes. It was heated from -60° to 330° C. at 3° C./minute with a primary modulation period of 20 seconds and an amplitude of 0.2° C. The multipliers were set at 4 and 0.2 respectively, giving a secondary modulation with a period of 80 seconds and an amplitude of 0.04° C. Temperature amplitude control was turned off to enable the cell to achieve the complex modulation. Identical measurements were also run on an empty pan and on a sapphire disk to use in calibration (see above).
FIG. 35 (see Table 35) shows the results after deconvolution. Clearly there are two heat capacity data sets (one from each modulation) and the values of the apparent heat capacities are dependent upon modulation frequency. Calibration resolves this difference, as shown in FIG. 36 (see Table 36). There is a very good agreement between the two heat capacities up to the recrystallization peak and above the melt which confirms that multiplexing produces useful data. However, a large difference is observed during the melt which proves that the apparent heat capacity during such an event is still dependent upon the frequency of the modulation. It is within this region that the most useful information can be gleaned.
Digitization Noise
The report files generated from the raw data must include a sufficient number of significant figures to avoid generating unnecessary noise. FIG. 37 (see Table 37) shows that this problem can be particularly significant at temperatures above 100° C., simply because one additional significant figure is required to express temperatures at or above 100° C., compared to temperatures below 100° C.
Parsing Multiplexed DDSC Measurements
The simplest method for parsing multiplexed DDSC data is to remove the higher frequency by averaging the data over the appropriate period, and then parse the data in accordance with the averaged data. Each parsed data set could then be analyzed in the manner described above for standard DDSC. The higher frequency can then be restored and parsed in accordance with the time intervals given by the parsing at the lower frequency. The higher frequency data could then be analyzed to calculate Cp and phase lag.
A second, more complicated, method is to parse the multiplexed signal itself. In this method, individual cycles in the higher frequency modulation will be separated, for example, into heating, cooling and reheating parsets (whereas, in the first method for parsing multiplexed DDSC data, discussed above, the data was not parsed at the higher frequency). The problem with this greater level of fragmentation of data is that sometimes only a small part of the cycle would be separated out, and this might not be enough for accurate analysis. The advantage of this more complicated second method is that it is more rigorous than the first simpler method, and potentially generates more information.
A third method is to essentially follow the second method, but ignore data sets that are too small. A fourth method also essentially follows the second method, but separates out the data sets which conform to simple behavior. In this fourth method, for example, only those data sets wherein both frequencies are heating, both frequencies are cooling and both frequencies are reheating are selected for analysis. The third and fourth methods could also be used in combination.
The foregoing disclosure of embodiments of the present invention has been presented for purposes of illustration and description. It is not intended to be exhaustive or to limit the invention to the precise forms disclosed. Many variations and modifications of the embodiments described herein will be obvious to one of ordinary skill in the art in light of the above disclosure. For example, the parsing method could readily be extended to provide a smooth continuous curve rather than the discrete points described herein. The scope of the invention is to be defined only by the claims appended hereto, and by their equivalents.
              TABLE 8
______________________________________
PARAMETERS USED TO
OBTAIN PLOT SHOWN IN FIG. 8
______________________________________
Sample:          Baseline
Size:            0.0000 mg
Method:          -60 to 330 R3 P80 A2
Comment:         -60 to 330° C. at
                 3° C./min.
                 Period 80s. Amp 2° C.
File:            A:PARS-1.029
Run Date:        10-Jan-94 13:52
Purge:           Helium
______________________________________
              TABLE 11
______________________________________
PARAMETERS USED TO
OBTAIN PLOT SHOWN IN FIG. 11
______________________________________
Sample:          Sapphire
Size:            60.6360 mg
Method:          -60 to 330 R3 P80 A2
Comment:         -60 to 330° C. at
                 3° C./min
                 Period 80s. Amp 2° C.
File:            A:PARS-1.030
Run Date:        11-Jan-94 09:04
Purge:           Helium
______________________________________
              TABLE 13
______________________________________
PARAMETERS USED TO
OBTAIN PLOT SHOWN IN FIG. 13
______________________________________
Sample:          PET
Size:            16.3140 mg
Method:          -60 to 330 R3 P80 A2
Comment:         -60 to 330° C. at
                 3° C./min.
                 Period 80s. Amp 2° C.
File:            A:PARS-1.031
Run Date:        11-Jan-94 12:21
Purge:           Helium
______________________________________
              TABLE 17
______________________________________
PARAMETERS USED TO
OBTAIN PLOT SHOWN IN FIG. 17
______________________________________
Sample:          Baseline (UNCRMPD:
                 22.509)
Size:            0.0000 mg
Method:          -60 to 330 R3 P80 A2
Comment:         -60 to 330° C. at
                 3° C./min.
                 Period 80s. Amp 2° C.
File:            A:PARS-1.029
Run Date:        10-Jan-94 13:52
Purge:           Helium
______________________________________
              TABLE 18
______________________________________
PARAMETERS USED TO
OBTAIN PLOT SHOWN IN FIG. 18
______________________________________
Heat Capacities of Sapphire Disk
Heating, Cooling and Reheating
______________________________________
              TABLE 19
______________________________________
PARAMETERS USED TO
OBTAIN PLOT SHOWN IN FIG. 19
______________________________________
Sample:          Sapphire (UNCRMPD:
                 22.509)
Size:            60.6360 mg
Method:          -60 to 330 R3 P80 A2
Comment:         -60 to 330° C. at
                 3° C./min.
                 Period 80s. Amp 2° C.
File:            A:PARS-1.030
Run Date:        11-Jan-94 09:04
Purge:           Helium
______________________________________
              TABLE 20
______________________________________
PARAMETERS USED TO
OBTAIN PLOT SHOWN IN FIG. 20
______________________________________
Sample:         PET (UNCRMPD: 22.509)
Size:           16.3140 mg
Method:         -60 to 330 R3 P80 A2
Comment:        -60 to 330° C. at 3° C./min
                Period 80s. Amp 2° C.
File:           A:PARS-1.031
Run Date:       11-Jan-94 12:21
Purge:          Helium
______________________________________
              TABLE 24
______________________________________
PARAMETERS USED TO
OBTAIN PLOT SHOWN IN FIG. 24
______________________________________
Sample:          PET
Size:            13.6610 mg
Method:          130 to 330 R5 P30 A0.2
Comment:         130 to 330° C. at
                 5° C./min.
                 P = 30s A = 0.2° C.
File:            A:PARS-1.034
Run Date:        24-Feb-94 13.47
Purge:           Helium
______________________________________
              TABLE 25
______________________________________
PARAMETERS USED TO
OBTAIN PLOT SHOWN IN FIG. 25
______________________________________
HEAT CAPACITIES AND PHASE LAG OF
QUENCHED PET
130 to 330C
Heating only
Parsed according to Cyclic Mod Temp: (+ve or -ve)
______________________________________
              TABLE 26
______________________________________
PARAMETERS USED TO
OBTAIN PLOT SHOWN IN FIG. 26
______________________________________
HEAT CAPACITIES AND PHASE LAG OF
QUENCHED PET
130 to 330C
Heating only
Parsed according to Cyclic Heat Flow: (+ve or -ve)
______________________________________
              TABLE 27
______________________________________
PARAMETERS USED TO OBTAIN PLOT SHOWN IN
FIG. 27
______________________________________
HEAT CAPACITIES AND PHASE LAG OF QUENCHED
PET
130 to 330 C.
Heating only
Parsed according to Cyclic Deriv Mod Temp:
(+ve or -ve)
______________________________________
              TABLE 28
______________________________________
PARAMETERS USED TO OBTAIN PLOT SHOWN IN
FIG. 28
______________________________________
Sample:          PET (UNCRMPD)
Size:            16.7040 mg
Method:          50 to 100 R5 P20 A0.10
Comment:         50 to 100 R: 5° C./min.
                 P: 20s Amp: 0.10° C.
                 QIO.2 QJ4 QH-1
File:            A:MDSC-14.027
Run Date:        2-Feb-94 15:14
Purge:           He
______________________________________
              TABLE 29
______________________________________
PARAMETERS USED TO OBTAIN PLOT SHOWN IN
FIG. 29
______________________________________
Sample:      QUENCHED PET (UNCRMPD)
Size:        16.4130 mg
Method:      -60 to 330 R5 P10 A0.15
Comment:     -60 to 330 R: 5° C./min.
             P: 10s Amp: 0.15° C.
             QIO.1 QJ4 QH-1
File:        A:MDSC-14.024
Run Date:    2-Feb-94 09:02
Purge:       He
______________________________________
              TABLE 30
______________________________________
PARAMETERS USED TO OBTAIN PLOT SHOWN IN
FIG. 30
______________________________________
MULTIPLEXED DATA AND 1ST DECONVOLUTION
From FTMPLX1.BAS -
Leaving secondary modulation
______________________________________
              TABLE 31
______________________________________
PARAMETERS USED TO OBTAIN PLOT SHOWN IN
FIG. 31
______________________________________
DECONVOLUTION OF SECONDARY MODULATION
From FTMPLX2.BAS -
Leaving the underlying signals
______________________________________
              TABLE 32
______________________________________
PARAMETERS USED To OBTAIN PLOT SHOWN IN
FIG. 32
______________________________________
CYCLIC COMPONENTS OF PRIMARY MODULATION
Multiplexed signals -
Secondary Modulation signals
Calc in FTMPLX3.BAS
______________________________________
              TABLE 33
______________________________________
PARAMETERS USED TO OBTAIN PLOT SHOWN IN
FIG. 33
______________________________________
HEAT CAPACITY OF PRIMARY MODULATION
Calculated from cyclic components of signals by
FTMPLX3.BAS
______________________________________
              TABLE 34
______________________________________
PARAMETERS USED TO OBTAIN PLOT SHOWN IN
FIG. 34
______________________________________
HEAT CAPACITY OF PRIMARY MODULATION
Fourier Transformed at secondary period
Calculated by FTMPLX4.BAS
______________________________________
              TABLE 35
______________________________________
PARAMETERS USED TO OBTAIN PLOT SHOWN IN
FIG. 35
______________________________________
APPARENT HEAT CAPACITIES OF QUENCHED PET
Multiplexed Experiment
______________________________________
              TABLE 36
______________________________________
PARAMETERS USED TO OBTAIN PLOT SHOWN IN
FIG. 36
______________________________________
CALIBRATED HEAT CAPACITIES OF QUENCHED PET
Multiplexed Experiment
______________________________________
              TABLE 37
______________________________________
PARAMETERS USED TO OBTAIN PLOT SHOWN IN
FIG. 37
______________________________________
EXAMPLE OF NOISE PROBLEMS IN HEAT CAPACITIES
OF PET
Multiplexed Experiment
Noise increases significantly at 100 C.
______________________________________
 ##SPC1##