US20020028024A1 - System and method for calculating an optimum display size for a visual object - Google Patents
System and method for calculating an optimum display size for a visual object Download PDFInfo
- Publication number
- US20020028024A1 US20020028024A1 US09/902,995 US90299501A US2002028024A1 US 20020028024 A1 US20020028024 A1 US 20020028024A1 US 90299501 A US90299501 A US 90299501A US 2002028024 A1 US2002028024 A1 US 2002028024A1
- Authority
- US
- United States
- Prior art keywords
- visual object
- display size
- size
- calculating
- optimum display
- Prior art date
- Legal status (The legal status is an assumption and is not a legal conclusion. Google has not performed a legal analysis and makes no representation as to the accuracy of the status listed.)
- Abandoned
Links
Images


Classifications
-
- G—PHYSICS
- G06—COMPUTING; CALCULATING OR COUNTING
- G06T—IMAGE DATA PROCESSING OR GENERATION, IN GENERAL
- G06T9/00—Image coding
- G06T9/007—Transform coding, e.g. discrete cosine transform
-
- G—PHYSICS
- G06—COMPUTING; CALCULATING OR COUNTING
- G06T—IMAGE DATA PROCESSING OR GENERATION, IN GENERAL
- G06T3/00—Geometric image transformation in the plane of the image
- G06T3/40—Scaling the whole image or part thereof
- G06T3/403—Edge-driven scaling
-
- G—PHYSICS
- G06—COMPUTING; CALCULATING OR COUNTING
- G06T—IMAGE DATA PROCESSING OR GENERATION, IN GENERAL
- G06T3/00—Geometric image transformation in the plane of the image
- G06T3/40—Scaling the whole image or part thereof
- G06T3/4092—Image resolution transcoding, e.g. client/server architecture
-
- G—PHYSICS
- G06—COMPUTING; CALCULATING OR COUNTING
- G06T—IMAGE DATA PROCESSING OR GENERATION, IN GENERAL
- G06T7/00—Image analysis
- G06T7/10—Segmentation; Edge detection
- G06T7/12—Edge-based segmentation
-
- G—PHYSICS
- G06—COMPUTING; CALCULATING OR COUNTING
- G06T—IMAGE DATA PROCESSING OR GENERATION, IN GENERAL
- G06T9/00—Image coding
-
- H—ELECTRICITY
- H04—ELECTRIC COMMUNICATION TECHNIQUE
- H04N—PICTORIAL COMMUNICATION, e.g. TELEVISION
- H04N19/00—Methods or arrangements for coding, decoding, compressing or decompressing digital video signals
- H04N19/10—Methods or arrangements for coding, decoding, compressing or decompressing digital video signals using adaptive coding
- H04N19/102—Methods or arrangements for coding, decoding, compressing or decompressing digital video signals using adaptive coding characterised by the element, parameter or selection affected or controlled by the adaptive coding
- H04N19/103—Selection of coding mode or of prediction mode
- H04N19/107—Selection of coding mode or of prediction mode between spatial and temporal predictive coding, e.g. picture refresh
-
- H—ELECTRICITY
- H04—ELECTRIC COMMUNICATION TECHNIQUE
- H04N—PICTORIAL COMMUNICATION, e.g. TELEVISION
- H04N19/00—Methods or arrangements for coding, decoding, compressing or decompressing digital video signals
- H04N19/10—Methods or arrangements for coding, decoding, compressing or decompressing digital video signals using adaptive coding
- H04N19/102—Methods or arrangements for coding, decoding, compressing or decompressing digital video signals using adaptive coding characterised by the element, parameter or selection affected or controlled by the adaptive coding
- H04N19/103—Selection of coding mode or of prediction mode
- H04N19/114—Adapting the group of pictures [GOP] structure, e.g. number of B-frames between two anchor frames
-
- H—ELECTRICITY
- H04—ELECTRIC COMMUNICATION TECHNIQUE
- H04N—PICTORIAL COMMUNICATION, e.g. TELEVISION
- H04N19/00—Methods or arrangements for coding, decoding, compressing or decompressing digital video signals
- H04N19/10—Methods or arrangements for coding, decoding, compressing or decompressing digital video signals using adaptive coding
- H04N19/134—Methods or arrangements for coding, decoding, compressing or decompressing digital video signals using adaptive coding characterised by the element, parameter or criterion affecting or controlling the adaptive coding
- H04N19/136—Incoming video signal characteristics or properties
- H04N19/137—Motion inside a coding unit, e.g. average field, frame or block difference
-
- H—ELECTRICITY
- H04—ELECTRIC COMMUNICATION TECHNIQUE
- H04N—PICTORIAL COMMUNICATION, e.g. TELEVISION
- H04N19/00—Methods or arrangements for coding, decoding, compressing or decompressing digital video signals
- H04N19/10—Methods or arrangements for coding, decoding, compressing or decompressing digital video signals using adaptive coding
- H04N19/134—Methods or arrangements for coding, decoding, compressing or decompressing digital video signals using adaptive coding characterised by the element, parameter or criterion affecting or controlling the adaptive coding
- H04N19/146—Data rate or code amount at the encoder output
- H04N19/152—Data rate or code amount at the encoder output by measuring the fullness of the transmission buffer
-
- H—ELECTRICITY
- H04—ELECTRIC COMMUNICATION TECHNIQUE
- H04N—PICTORIAL COMMUNICATION, e.g. TELEVISION
- H04N19/00—Methods or arrangements for coding, decoding, compressing or decompressing digital video signals
- H04N19/10—Methods or arrangements for coding, decoding, compressing or decompressing digital video signals using adaptive coding
- H04N19/169—Methods or arrangements for coding, decoding, compressing or decompressing digital video signals using adaptive coding characterised by the coding unit, i.e. the structural portion or semantic portion of the video signal being the object or the subject of the adaptive coding
- H04N19/17—Methods or arrangements for coding, decoding, compressing or decompressing digital video signals using adaptive coding characterised by the coding unit, i.e. the structural portion or semantic portion of the video signal being the object or the subject of the adaptive coding the unit being an image region, e.g. an object
- H04N19/172—Methods or arrangements for coding, decoding, compressing or decompressing digital video signals using adaptive coding characterised by the coding unit, i.e. the structural portion or semantic portion of the video signal being the object or the subject of the adaptive coding the unit being an image region, e.g. an object the region being a picture, frame or field
-
- H—ELECTRICITY
- H04—ELECTRIC COMMUNICATION TECHNIQUE
- H04N—PICTORIAL COMMUNICATION, e.g. TELEVISION
- H04N19/00—Methods or arrangements for coding, decoding, compressing or decompressing digital video signals
- H04N19/50—Methods or arrangements for coding, decoding, compressing or decompressing digital video signals using predictive coding
- H04N19/503—Methods or arrangements for coding, decoding, compressing or decompressing digital video signals using predictive coding involving temporal prediction
- H04N19/51—Motion estimation or motion compensation
- H04N19/527—Global motion vector estimation
-
- G—PHYSICS
- G06—COMPUTING; CALCULATING OR COUNTING
- G06T—IMAGE DATA PROCESSING OR GENERATION, IN GENERAL
- G06T2207/00—Indexing scheme for image analysis or image enhancement
- G06T2207/10—Image acquisition modality
- G06T2207/10016—Video; Image sequence
-
- G—PHYSICS
- G06—COMPUTING; CALCULATING OR COUNTING
- G06T—IMAGE DATA PROCESSING OR GENERATION, IN GENERAL
- G06T2207/00—Indexing scheme for image analysis or image enhancement
- G06T2207/20—Special algorithmic details
- G06T2207/20172—Image enhancement details
- G06T2207/20192—Edge enhancement; Edge preservation
-
- H—ELECTRICITY
- H04—ELECTRIC COMMUNICATION TECHNIQUE
- H04N—PICTORIAL COMMUNICATION, e.g. TELEVISION
- H04N5/00—Details of television systems
- H04N5/14—Picture signal circuitry for video frequency region
- H04N5/147—Scene change detection
Definitions
- the present invention relates generally to video processing techniques. More particularly, the present invention relates to a method and system for calculating an optimum display size for a visual object.
- Computer networks such as the internet, local area networks, and wide area networks have become the preferred communication medium for sending and receiving both traditional and new forms of multi-media content.
- receiving digital video over the internet that is displayed on a computer screen has become very popular.
- Digital video involves storing, moving, and calculating extremely large volumes of data compared to other kinds of computer files. While the data rate and file size of uncompressed digital video can overwhelm many personal computers and hard disks, compressed video can lower the data rate of the digital video into a range that a particular computer system can handle.
- Compression is often defined as the coding of data to save storage space or transmission time.
- data can be coded in digital form for computer processing, data can be coded more efficiently with compression, using fewer bits.
- Video compression involves the compression of sequences of images. Video compression algorithms typically use the fact that there are usually only small changes from one “frame” to the next so they only need to encode the starting frame and a sequence of differences between frames.
- MPEG Moving Picture Experts Group
- MPEG-1 was the first MPEG format for compressed video that was optimized for CD-ROM.
- MPEG-1 was designed for transmission rates of about 1.1 megabits per second achievable with video-CD and CD-i.
- MPEG-2 is a variant of the MPEG video and audio compression algorithm in file format that was optimized for broadcast quality video.
- MPEG-2 was designed to transmit images using progressive coding at 4 megabits per second or higher for use in broadcast digital TV and DVD.
- MPEG-3 was intended as an extension of MPEG-2 to cater for HDTV but was eventually merged into MPEG-2.
- MPEG-4 is another video compression algorithm that was planned for the year of 1998. MPEG-4 extends the earlier MPEG-1 and MPEG-2 algorithms with synthesis of speech and video, fractal compression, computer visualization and artificial intelligence-based image processing techniques.
- MPEG-1 format For compressed video.
- the MPEG-1 format utilizes discrete cosine transform (“DCT”) and Huffinan Coding to remove spatially redundant data within a frame and block-based motion compensated prediction (“MCP”) to remove data which is temporally redundant between frames.
- DCT discrete cosine transform
- MCP block-based motion compensated prediction
- Audio with the MPEG-1 format is typically compressed using subband encoding.
- the MPEG-1 algorithm allows better than VHS quality video and almost CD quality audio to be compressed onto and streamed off of a single speed (1x) CD-ROM drive.
- compression techniques may permit the transmission of visual objects over a computer network
- compression techniques can introduce artifacts or distortion in the video as a direct result of the compression techniques.
- MPEG-1 encoding can introduce artifacts such as blockiness, mosquito noise, color bleeding, and shimmering effects within the video in addition to a lack of detail in quantization effects in audio.
- effects of the compression techniques on the video segments of a multimedia presentation may be negligible in some instances, typically the artifacts and distortion generated by the compression techniques become quite apparent to a user when a visual object such as video is enlarged on a display device.
- the video decoder sets a nominal fixed display size and the user of the video decoder may have options for manually enlarging the display size by activating pixel repetition or interpolation routines in the media player.
- a decoded or uncompressed video signal is enlarged, both the raw components of the original uncompressed video signal as well as the distortion caused by the compression techniques are enlarged.
- an enlarged image with a conventional media player typically enlarges or amplifies both the original video signal and the distortion.
- low bit rates can also contribute to the artifacts or distortion when compressed video is decoded.
- Low bit rates can be defined as data transmission rates that are at approximately twenty-five percent (25%) of a standard speed. For example, if MPEG-1 is a reference standard, then transmission rates of about 1.1 megabits per second would be the norm for the standard rate. A low rate would be about twenty-five percent (25%) of the normal rate and, therefore, 250 megabits per second could be categorized as a low bit rate.
- FIG. 1A this figure illustrates one exemplary frame 100 A of a visual object 105 A at a first size relative to the frame's original size.
- FIG. 1A could be referred to as the optimum display size for the exemplary frame 100 A since artifacts or distortion are not readily perceived by the user.
- FIG. 1B illustrates an exemplary frame 100 B of the visual object 105 B illustrated in FIG. 1A at a second size of the frame's original size that is much larger than the first size illustrated in FIG. 1A.
- artifacts or distortion such as mosquito noise 110 , 115 and the shimmering effects 120 can be perceived in this enlargement of the exemplary frame of a visual object 100 B.
- the present invention is generally drawn to a method and system for automatically selecting the optimal size of a visual object that can be displayed on a display device.
- the present invention can determine the best or optimum size to display a visual object received from a computer network to a computer screen such that image degradations due to compression or transmission defects are less noticeable or perceivable.
- the best or optimum size to display a visual object can comprise a size that is also the maximum in which the visual object can be displayed without any degradations or defects.
- the present invention can automatically perform the sizing of the received visual object.
- the invention can display a message indicating the optimal display size and receive input as to whether the optimal display size is selected by a user.
- the visual object can comprise one of video, a graphical image, and other like visual objects.
- the visual object can be transmitted across various types of communication mediums in various formats.
- the communication mediums can comprise computer networks, wireless networks, infra-red transmissions, electromagnetic couplings, and other similar communication mediums.
- the formats of the visual objects can include downloadable files, internet streaming, and visual objects retrievable from storage mediums such as CD-ROMs or DVDs.
- the display devices for the present invention can include a printer, cathode ray tubes (CRTs), liquid crystal displays (LCDs), light emitting diode (LED) displays, and projectors. These display devices can be part of various equipment such as computers (laptops, desktops, handhelds—such as PDAs, etc.), televisions, cellular telephones, and other similar equipment.
- CTRs cathode ray tubes
- LCDs liquid crystal displays
- LED light emitting diode
- projectors projectors.
- These display devices can be part of various equipment such as computers (laptops, desktops, handhelds—such as PDAs, etc.), televisions, cellular telephones, and other similar equipment.
- a coding difficulty value can be calculated after compressing a visual object in a conventional format, such as Moving Picture Experts Group (MPEG) format, for computer network transmission.
- One exemplary coding difficulty value can comprise a harmonic average of the Peak Signal to Noise Ratio (PSNR) for a number of frames taken from the visual object.
- PSNR Peak Signal to Noise Ratio
- An encoder can calculate the harmonic average of the PSNR based upon the original visual object to be encoded. More specifically, the visual object encoder can calculate the PSNR for each frame of the original visual object or by reviewing a set of frames or a sample of frames and comparing the frame or set of frames to the compressed video. Using the PSNR values for the number of frames evaluated, the encoder can then calculate the harmonic mean of the PSNR values.
- the coding difficulty value of the present invention is not limited to the harmonic average of the PSNR.
- Other coding difficulty values are not beyond the scope of the present invention.
- the coding difficulty value could comprise the straight average of the PSNR values for a number of frames of visual object or any other subjectively relevant metric.
- the optimum display size for the encoded visual object can be determined based upon the coding difficulty value and one or more other parameters. More specifically, according to one aspect, the optimum display size can be determined based upon the coding difficulty value and the coding bit rate. With at least these two parameters, the coding bit rate and the coding difficulty value, the optimum display size that can provide the most clear and largest presentation of the encoded visual object can be determined. The optimum display size along with the encoded visual object can then be transmitted to a receiver or decoder side of the system.
- the present invention is not limited to the coding difficulty and coding bit rate parameters for determining an optimum display size.
- Other parameters include, but are not limited to, screen quality such as screen size and screen resolution (dots per inch—dpi) capability.
- the coding difficulty value can then be transmitted with the encoded visual object over a communications medium such as a computer network.
- the optimum display size for the encoded visual object can be determined based upon the coding difficulty value and one or more other parameters. More specifically, according to one aspect, the optimum display size can be determined based upon the coding difficulty value and the coding bit rate. With these two parameters, the coding bit rate and the coding difficulty value, the optimum display size that can provide the most clear and largest presentation of the encoded visual object can be determined.
- the optimum display size can be determined by mapping the coding difficulty value and the visual object transmission rate on a graph, where the coding difficulty value can define the x-coordinate and the visual object transmission rate can define the y-coordinate in a Cartesian coordinate system.
- the Cartesian coordinate system can further comprise a plurality of diagonal zones as well as stair-step type functions. Depending upon where a particular set of coordinates will fall within a particular stair-step type function can provide information as to the amount a particular visual object can be sized.
- each stair step type function may be associated with a fixed value defining a size of the visual object relative to a computer screen.
- each stair step function can comprise a twenty to twenty-five percent increase in size relative to each other and vice-versa.
- the diagonal zones and stair step functions can be calculated empirically.
- the present invention can automatically size the visual object according to this calculation or the calculated display size can be displayed as an option that can be selected. If the option is selected, then the visual object can be decoded and displayed at the calculated optimum display size.
- a coding difficulty value can be calculated after a visual object has been compressed in a conventional format, such as Moving Picture Experts Group (MPEG) format, for computer network transmission.
- a decoder can review the step size history of the compression format's quantizers. That is, in many compression formats, quantization methods can be used to round off or quantize discrete cosine transform (DCT) coefficients.
- DCT discrete cosine transform
- a step size can comprise the quantization of DCT coefficients.
- This estimation of the harmonic average of the PSNR can be derived empirically. Once the estimated harmonic average of the PSNR is determined, the optimum display size can be calculated, as discussed above, by mapping the harmonic average of the PSNR and the visual object transmission rate and determining the zone in which the coordinates are located.
- the optimum display size can be calculated as a function of the coding difficulty value alone.
- the optimum display size can be calculated as a function of the visual object transmission rate or encoding rate alone.
- FIG. 1A illustrates one exemplary frame of a visual object at a first size of its original size according to one exemplary embodiment of the present invention.
- FIG. 1B illustrates a conventional exemplary frame of the visual object depicted in FIG. 1A at a second size of its original size that is larger than the first size.
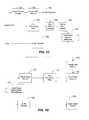
- FIG. 1C illustrates an encoding system for calculating a coding difficulty value and for encoding a visual object according to one exemplary embodiment of the present invention.
- FIG. 1D illustrates a decoding system for calculating a coding difficulty value and for decoding an encoded visual object after receiving the encoded visual object according to another exemplary embodiment of the present invention.
- FIG. 2A illustrates a method for calculating an optimum display size at an encoder, transmitting the calculated optimum display size to a receiver, and rendering a visual object according to the calculated optimum display size in one exemplary embodiment of the present invention.
- FIG. 2B illustrates a method for calculating a coding difficulty value at an encoder, transmitting the calculated coding difficulty value to a receiver, and rendering a visual object according to the calculated optimum display size in one exemplary embodiment of the present invention.
- FIG. 2C illustrates a method for calculating an optimum display size at an encoder based on a coding difficulty value alone, transmitting the calculated optimum display size to a receiver, and rendering a visual object according to the calculated optimum display size in one exemplary embodiment of the present invention.
- FIG. 2D illustrates a method for calculating a coding difficulty value at an encoder, transmitting the calculated coding difficulty value to a receiver, and rendering a visual object according to the calculated optimum display size based on the coding difficulty value alone in one exemplary embodiment of the present invention.
- FIG. 3A illustrates a subroutine of FIGS. 2A, 2B, and 4 A for determining the optimum display size of a visual object according to one exemplary embodiment of the present invention.
- FIG. 3B is a graph illustrating relationships between harmonic peak signal to noise ratios and a visual object transmission rate that may comprise stair step type functions or diagonal zones in accordance with an exemplary embodiment of the present invention.
- FIG. 4A illustrates a method for calculating an optimum display size at a decoder and rendering visual object according to the calculated optimum display size according to one exemplary embodiment of the present invention.
- FIG. 4B illustrates a method for calculating an optimum display size at a decoder based upon the visual object transmission rate alone and rendering visual object according to the calculated optimum display size according to one exemplary embodiment of the present invention.
- FIG. 4C illustrates a method for calculating an optimum display size at a decoder and rendering visual object according to the calculated optimum display size that is based on a coding difficulty value alone according to one exemplary embodiment of the present invention.
- the present invention can determine the maximum size to display a visual object received from a computer network to a computer screen such that image degradations due to compression or transmission defects are the least noticeable.
- the visual object can comprise one of video, a graphical image, and other like visual objects.
- a coding difficulty value can be calculated during compression of a visual object in a conventional format, such as Moving Picture Experts Group (MPEG) format, for computer network transmission.
- MPEG Moving Picture Experts Group
- a coding difficulty value can be calculated from a received coded or compressed visual object that was transmitted over a computer network.
- An optimum display size can be calculated by mapping the harmonic average of the PSNR and the visual object transmission rate and determining the zone in which the coordinates are located.
- the present invention can be embodied in software that runs on a computer.
- the processes and operations performed by a computer include the manipulation of signals by a processor and the maintenance of these signals within data structures resident in one or more memory storage devices.
- a process is generally conceived to be a sequence of computer-executed steps leading to a desired result. These steps usually require physical manipulations of physical quantities. Usually, though not necessarily, these quantities take the form of electrical, magnetic, or optical signals capable of being stored, transferred, combined, compared, or otherwise manipulated. It is convention for those skilled in the art to refer to representations of these signals as bits, bytes, words, information, elements, symbols, characters, numbers, points, data, entries, objects, images, files, or the like. It should be kept in mind, however, that these and similar terms are associated with appropriate physical quantities for computer operations, and that these terms are merely conventional labels applied to physical quantities that exist within and during operation of the computer.
- manipulations within the computer are often referred to in terms such as creating, adding, calculating, comparing, moving, receiving, determining, identifying, populating, loading, executing, etc. that are often associated with manual operations performed by a human operator.
- the operations described herein can be machine operations performed in conjunction with various input provided by a human operator or user that interacts with the computer.
- FIG. 1A illustrates one exemplary frame 100 A of a visual object 105 A at a first size relative to its original size.
- the size of the exemplary frame 100 A illustrated in FIG. 1A can be the optimum display size for the visual object 105 A.
- the optimum size of a visual object 105 A can be defined as the size of a visual object 105 A at which artifacts or distortion are not literally perceivable or apparent to a user.
- the optimum display size can be defined as the maximum size at which a visual object 105 A can be displayed on the display device without apparent or readily perceivable artifacts or distortion caused by compression or transmission rate or both.
- a visual object can comprise one of video, a single graphical image, or other like visual objects.
- the graphical image can comprise one of a banner advertisement, a photograph, and a graphical object.
- the video can comprise one of a live television signal and stored video. More specifically, the formats of the visual objects can include downloadable files, internet streaming, and visual objects retrievable from storage mediums such as CD-ROMs or DVDs.
- the display devices that can render frame 100 A of FIG. 1A can comprise printers, monitors for desktop or laptop computers such as cathode ray tubes (CRT) or liquid crystal displays (LCDs), handheld computers such as Personal Digital Assistants (PDAs), cellular telephones, watch displays, and other like devices.
- Frame 100 A can be transmitted over various communication mediums.
- frame 100 A can be transmitted over a computer network such as a local area network (LAN) or the Internet.
- LAN local area network
- the present invention is not limited to these communication mediums.
- Other communication mediums include, but are not limited to, wireless communication links such as radio frequency communications, infra red communications, electromagnetic coupling, and other similar communication mediums.
- FIG. 1C this figure illustrates a functional block diagram of an encoding system 100 for calculating a coding difficulty value of a visual object according to one exemplary embodiment of the present invention.
- the exemplary encoding system 125 can comprise a scene change detector 130 , a temporal bit allocator 135 , a rate controller 140 , and a preprocessing filter 145 .
- the scene change detector 130 is connected to the temporal bit allocator 135 .
- the temporal bit allocator is connected to the rate controller 140 .
- the encoding system 100 receives a video input signal and an audio input signal.
- the video input is typically a series of digitized images that are linked together in series.
- the audio input is simply the audio signal that is associated with the series of images making up the video input.
- the video input is first passed through a pre-processing filter 145 that, among other things, filters noise from the video input to prepare the input video stream for encoding.
- the input video stream is then passed to the visual object or video encoder 150 .
- the video encoder 150 compresses the video signal by eliminating irrelevant and/or redundant data from the input video signal.
- the video encoder 150 may reduce the input video signal to a predetermined size to match the transmission requirements of the encoding system 100 .
- the video encoder 150 may simply be configured to minimize the size of the encoded video signal. This configuration might be used, for example, to maximize the storage capacity of a storage medium (e.g., hard drive).
- the video encoder 150 can perform the compression process by reducing the input data rate to a level that can be supported by the storage or transmission medium. It can also translate the compressed bit stream into a signal suitable for either storage or transmission. The video encoder 150 can also calculate the mean square error (MSE) for the one or more frames of the visual object of interest. The video encoder 150 can further calculate a coding difficulty value as will be discussed in further detail below with respect to FIG. 2.
- MSE mean square error
- the audio input is compressed by the audio encoder 160 .
- the encoded audio signal is then passed with the encoded video signal to the video stream multiplexer 165 .
- the video stream multiplexer 165 combines the encoded audio signal and the encoded video signal so that the signals can be separated and played-back substantially simultaneously.
- the encoding system outputs the combined signal as an encoded video stream.
- the encoded video stream is thus prepared for transmission, storage, or other processing as needed by a particular application. Often, the encoded video stream will be transmitted to a decoding system that will decode the encoding video stream and prepare it for subsequent display.
- the video input stream can be further processed prior to encoding.
- the encoding system 100 of exemplary embodiment of the present invention also can prepare the input video stream for encoding by modifying the input video stream to facilitate compression.
- the exemplary encoding system 100 includes a picture grouping module or scene change detector 130 , a bit allocation module or temporal allocator 135 , and a bit rate controller 140 .
- the picture grouping module 130 can process a video input stream by selecting and classifying I-pictures in the video stream.
- the picture grouping module 130 can also select and classify P-pictures in the video stream.
- the picture grouping module 130 can significantly improve the quality of the encoded video stream.
- Conventional encoding systems arbitrarily select I-pictures, by adhering to fixed-size picture groups.
- the coding system 100 is more fully described in co-pending non-provisional patent application entitled, “VIDEO COMPRESSION USING ADAPTIVE SELECTION OF GROUPS OF FRAMES, ADAPTIVE BIT ALLOCATION, AND ADAPTIVE REPLENISHMENT,” (attorney docket number 07816-105004) filed on Jul. 11, 2001 and assigned U.S. application Ser. No. ______, the contents of which are hereby incorporated by reference.
- the bit allocation module 135 can be used to enhance the quality of the encoded video bit stream by adaptively allocating bits among the groups of pictures defined by the picture grouping module 130 and by allocating bits among the pictures within a given group of pictures. Whereas conventional decoding systems often allocate bits in an arbitrary manner, the allocation module 135 can reallocate bits from the picture groups requiring less video data to picture groups requiring more video data. Consequently, the quality of the encoded video bit stream is enhanced by improving the quality of the groups of pictures requiring more video data for high quality representation.
- the bit rate controller 140 can use an improved method of conditional replenishment to further reduce the presence of noise in an encoded video bit stream.
- Conditional replenishment is a well-known aspect of video data compression.
- a picture element or a picture block will be encoded in a particular picture if the picture element or block has changed when compared to a previous picture.
- the encoder will typically set a flag or send an instruction to the decoder to simply replenish the picture element or block with the corresponding picture element or block from the previous picture.
- the bit rate controller 140 can focus on macroblocks and may condition the replenishment of a macroblock on the change of one or more picture elements and/or blocks within the macroblock, as discussed in co-pending non-provisional patent application entitled, “VIDEO COMPRESSION USING ADAPTIVE SELECTION OF GROUPS OF FRAMES, ADAPTIVE BIT ALLOCATION, AND ADAPTIVE REPLENISHMENT,” (attorney docket number 07816-105004) filed on Jul. 11, 2001 and assigned U.S. application Ser. No. ______, the contents of which are hereby incorporated by reference.
- the bit rate controller 140 may condition the replacement of a macroblock on a quantification of the change within the macroblock (e.g., the average change of each block) meeting a certain threshold requirement.
- the objective of the bit rate controller 140 is to further reduce the presence of noise in video data and to simplify the encoding of a video stream.
- the exemplary encoding system 125 may further comprise a display size selector 155 .
- the display size selector 155 can then determine the optimum display size by utilizing the coding difficulty value calculated by the visual object encoder 150 in addition to other parameters as will be discussed in further detail below with respect to FIG. 2.
- the display size selector 155 has been illustrated with dashed lines to indicate that in other exemplary embodiments, this element can be eliminated when the coding difficulty value is transmitted over a communications medium so that a decoder 167 with a display size selector 175 can determine the optimum display size as will be discussed below with respect to the exemplary embodiment illustrated in FIG. 2B.
- FIG. 1D this figure illustrates a functional block diagram of a decoding system 167 for calculating a coding difficulty value after receiving the encoded visual object according to another exemplary embodiment of the present invention.
- the decoding system 167 receives an encoded video stream as input to a video stream demultiplexer 170 .
- the video stream demultiplexer 170 separates the encoded video signal and the encoded audio signal from the encoded video stream.
- the encoded video signal is passed from the video stream demultiplexer 170 to the video decoder 172 .
- the encoded audio signal is passed from the video stream demultiplexer 170 to the audio decoder 182 .
- the video decoder 172 and a audio decoder 182 expand the video signal and the audio signal to a size that is substantially identical to the size of the video input and audio input.
- the post-processing filter 177 is used to counteract some of the well-known noise found in a decoded video signal. That has been encoded and/or decoded using a lossy process. Examples of such well-known noise types include mosquito noise, salt-and-pepper noise, and blockiness.
- the conventional post-processing filter 177 includes well-known algorithms to detect and counteract these and other known noise problems.
- the post-processing filter 177 generates a filtered, decoded video output.
- the post processing filter 177 can filter the decoded visual object to improve a user's perception of the accuracy of the rendered visual object.
- the post-processing filter 177 typically has no impact on the process for determining the optimal display size of the visual object.
- the post-processing filter 177 in some exemplary embodiments, does not directly affect the display size algorithm, but helps increase the impact of a decoded visual object.
- Lowering noise level with a post-processing filter 177 can create a conservative situation for displaying a visual object at a larger size.
- the display size selector 175 can determine the optimum display size of a visual object by utilizing an estimate of the coding difficulty value based upon the step sizes calculated by the visual object encoder 150 as will be discussed in further detail below with respect to FIG. 4A.
- the visual object renderer 180 can change the size of a visual object by repeating pixels or performing linear extrapolation by using linear filtering methods. The visual object renderer 180 will size the visual object based upon information received from the display size selector 175 .
- the video output and the audio output may be fed to appropriate ports on a display device, such as a television, or may be provided to some other display means such as a software-based media playback component on a computer. Alternatively, the video output and the audio output may be stored for subsequent display.
- the video decoder 172 decompresses or expands the encoded video signal. While there are various well-known methods for encoding and decoding a video signal, in all of the methods, the decoder must be able to interpret the encoded signal. The typical decoder is able to interpret the encoded signal received from an encoder, as long as the encoded signal conforms to an accepted video signal encoding standard, such as the well-known MPEG1 and MPEG2 standards. In addition to raw video data, the encoder typically encodes instructions to the decoder as to how the raw video data should be interpreted and represented (i.e., displayed).
- an encoded video stream may include instructions that a subsequent video picture is identical to a previous picture in a video stream.
- the encoded video stream can be further compressed, because the encoder need not send any raw video data for the subsequent video picture.
- the decoder When the decoder receives the instruction, the decoder will simply represent the subsequent picture using the same raw video data provided for the previous picture.
- Such instructions can be provided in a variety of ways, including setting a flag or bit within a data stream.
- Step 205 A is the first step of the process for calculating an optimum display size at an encoder.
- a visual object such as a video segment is encoded according to a predetermined format.
- the visual object encoder 150 can encode the received visual object according to the MPEG-1 video compression format.
- a coding difficulty value can be calculated as a function of the signal-to-noise ratio (SNR).
- SNR signal-to-noise ratio
- the peak signal-to-noise ratio (PSNR) of a particular frame can be calculated with the encoder 150 by comparing the original visual object with the encoded visual object.
- the noise signal energy is defined as the energy measured for a hypothetical signal that is the difference between the encoder input signal and the decoder output signal. Once the peak signal-to-noise ratio is calculated for the frames of interest for the visual object, then the coding difficulty value can be calculated.
- the coding difficulty value can comprise a harmonic mean of the peak signal-to-noise ratio (PSNR) for one or more frames taken from the visual object.
- PSDNR peak signal-to-noise ratio
- the harmonic mean of the Peak Signal to Noise Ratio (PSNR) can be used to identify the difficulty of scenes within a visual object.
- This exemplary coding difficulty value can reflect a presence of visual object segments that will likely be coded poorly during the compression process.
- the coding difficulty and the signal noise ratio are usually inversely related. In other words, the ease of coding is proportional to the harmonic mean and the coding difficulty is the inverse effect so when the harmonic average is higher, larger display sizes are usually suggested.
- step 210 can be performed by the visual object encoder 150 .
- the harmonic mean is a statistic which can emphasize the weakest link in a chain or series of data points.
- the harmonic mean physically emphasizes the lower end.
- the harmonic mean of the peak to signal noise ratio usually gives a conservative measure of the weakest link or the video segment which may likely have the poorest quality. If the peak values of the signal to noise ratio (PSNR) are used themselves as the measurement of scene complexity, such values may give an overly optimistic view of how successful the video compression has been.
- PSNR signal to noise ratio
- the harmonic mean is typically referred to as an overall statistic that is conservative in nature that is well suited for determining optimal display sizes for visual objects.
- the coding difficulty value of the present invention is not limited to the harmonic mean of the peak signal-to-noise ratio.
- Other coding difficulty values are not beyond the scope of the present invention.
- the coding difficulty value could comprise the straight average of the peak signal-to-noise ratio values for a number of frames of a visual object.
- routine 215 the optimum display size for the visual object 105 A can be determined based upon the coding difficulty value and the transmission rate of the visual object. Further details of routine 215 will be discussed below with respect to FIG. 3. Alternatively, as will be discussed below with respect to the exemplary embodiments illustrated in FIGS. 2 C, 2 D, 4 B, and 4 C, the optimum display size can be calculated based upon either the coding difficulty value or the visual object transmission rate. Further, the optimum display size calculation can also evaluate other parameters in addition to the coding difficulty value and visual object transmission rate.
- the optimum display size can consider the quality of the display device such as its resolution capabilities (dots per inch - dpi) and the size of the display device, just to name a few alternative and exemplary parameters. Those skilled in the art will recognize that other parameters affecting the calculation of the optimum display size are not beyond the scope of the present invention. Calculation of the optimum display size can be biased or weighted appropriately depending upon these other parameters such as display device quality and size.
- the encoded visual object and optimum display size value are forwarded over a communications medium.
- the encoded visual object and optimum display size can be transmitted across a computer network such as the Internet or a local area network.
- the present invention is not limited to communication mediums comprising computer networks.
- the communication mediums can include, but are not limited to, wireless networks, infra red transmissions, electromagnetic couplings, and other similar communication mediums.
- step 225 A the received visual object is decoded.
- decision step 230 A it is determined whether the visual object is displayed with the calculated optimum display size.
- decision step 230 A can comprise various options for the system designer. That is, decision step 230 A can comprise a prompt for input from a user. In other words, the user could select the optimum display size function as the default size for any visual object received from a network.
- decision step 230 A can be embodied in options that are dependent upon payment for a particular service. Stated differently, decision step 230 A can be connected to the type of service selected and paid for by a user. In one exemplary embodiment, decision step 230 A can be conditioned upon the receipt of a form of payment in order to determine the optimum display size for the visual object. Decision step 230 A may further comprise a step of displaying the calculated optimum display size as message so that a user may see the actual calculated optimum display size value.
- step 230 A If the inquiry to decision step 230 A is positive, then the “yes” branch is followed to step 235 A, in which the visual object with the calculated optimum display size is displayed. If the inquiry to decision step 230 A is negative, then the “no” branch is followed to step 240 A, in which the visual object is displayed with a default or selected display size activated by the user varied.
- FIG. 2B this figure illustrates a method for calculating a coding difficulty value at an encoder, such as encoding system 125 , transmitting the coding difficulty value over a communications medium, and rendering a visual object according to the calculated optimum display size.
- an encoder such as encoding system 125
- transmitting the coding difficulty value over a communications medium and rendering a visual object according to the calculated optimum display size.
- step 215 A for calculating the optimum display size has been moved to the decoder side or receiver side of the process, as step 227 .
- step 220 A has been modified as step 221 B such that the coding difficulty value instead of the calculated optimum display size is transmitted over the communications medium.
- FIG. 2C this figure illustrates a method for calculating a coding difficulty value and an optimum display size at an encoder, such as encoding system 125 , the optimum display size being calculated based on only the coding difficulty value, transmitting the optimum display size over a communications medium, and rendering a visual object according to the calculated optimum display size.
- an encoder such as encoding system 125
- the optimum display size being calculated based on only the coding difficulty value
- transmitting the optimum display size over a communications medium and rendering a visual object according to the calculated optimum display size.
- FIG. 2C differs slightly from the process described in FIG. 2A.
- step 215 has been modified as step 216 to calculate the optimum display size based upon only the coding difficulty value instead of the combination of the coding difficulty value and the visual object transmission rate as discussed above.
- FIG. 2D this figure illustrates a method for calculating a coding difficulty value at an encoder, such as encoding system 125 , transmitting the coding difficulty value over a communications medium, calculating an optimum display size based on the coding difficulty value alone, and rendering a visual object according to the calculated optimum display size.
- an encoder such as encoding system 125
- transmitting the coding difficulty value over a communications medium calculating an optimum display size based on the coding difficulty value alone
- rendering a visual object according to the calculated optimum display size.
- step 227 has been modified as step 228 to calculate the optimum display size based upon only the coding difficulty value instead of both the coding difficulty value and the visual object transmission rate.
- Step 305 is the first step of routine 215 in which the coding difficulty value calculated in step 210 is ascertained.
- the visual object transmission rate is also ascertained.
- the visual object transmission rate comprises one or more values measured in units of information per unit of time period. More specifically, the visual object transmission rate can comprise a speed at which binary digits are transmitted.
- the visual object transmission rate in one exemplary embodiment can comprise bits per second.
- step 315 the coding difficulty value and visual object transmission rate value are mapped to a chart, table, graph, grid or other similar data association mechanism.
- the coding difficulty value defines an X coordinate while the visual object transmission rate defines a Y coordinate in a Cartesian coordinate system.
- step 320 from the coordinates identified in step 315 , a zone value corresponding to the coding difficulty value and transmission rate can be identified.
- this zone value can be associated with an optimum display size value such as the percentage in which a visual object should be enlarged. Further details of steps 315 , 320 , and 325 will be discussed below with respect to FIG. 3B.
- FIG. 3B this figure is a graph illustrating relationships between the harmonic mean for the peak signal-to-noise ratios (HM-PSNR) and the visual object transmission rate (in kilobits per second or kbps).
- the harmonic average of the peak signal-to-noise ratio defines the X-axis while the transmission rate defines the Y-axis.
- FIG. 3B illustrates empirically derived relationships between data transmission rates and a harmonic average of the peak signal-to-noise ratio of a compression technique.
- the zones A, B, C, D and E can be associated with percent increases of picture size for displaying visual objects.
- Zone A comprises the region between the X-axis and a first stair step type function 335 .
- Zone B defines a region between the first stair step function 335 and a second stair step function 340 .
- Zone C defines a region between the second stair step type function 340 and a third stair step type function 345 .
- Zone D defines a region between the third stair step type function and a fourth stair step type function 350 .
- Zone E defines a region extending above the fourth stair step type function 350 .
- Each zone of Zones A to E can be associated with a respective percentage increase of the visual object size for each respective zone depicted in FIG. 3B.
- each zone could define a 20% increase in size relative to a neighboring zone.
- the present invention is not limited to the 20% increments. Other increments, higher or lower, are not beyond the scope of the present invention.
- FIG. 3B it can be assumed that there are five different display size levels.
- the original size of an encoded image can be assumed to be one quarter (usually, 320 ⁇ 240) of full size (usually, 640 ⁇ 480). Therefore, Zone A can be interpreted to mean there is no blow-up. That is, the decoder can just display the image at the original display size.
- zone 3B can be 200% of the original size, and this size is associated with zone E.
- Diagonal Zones I, II, III, IV, V and VI can rationalize the empirical procedure taken to define the graph illustrated in FIG. 3B.
- the diagonal Zones I, II, III, IV, V and VI demonstrate that for a particular sample object, such as Sample Object 1 which is represented by a triangle in FIG. 3B, each of the data points for the Sample Object 1 appear to fall within a diagonal zone of II.
- the data points for each sample visual object were calculated by taking a visual object such as a video segment and adjusting the transmission rate. Since the transmission rate affects the coding or compression of a visual object, different harmonic means of the PSNRs were derived for the same sample visual object. For example, for a first data point 360 of Sample Visual Object 1, this data point 360 was encoded for a bit rate of approximately 110 kilobits per second. Such a transmission speed yielded a harmonic average of the PSNR of approximately 30. This data point 360 is located in Zone B. Zone B has an associated percent increase value of 20%. Therefore, the decoded visual object is recommended to be displayed at 120% of its original size to provide the optimal size in which artifacts or distortion caused by the transmission rate or compression algorithm or both are less noticeable.
- the present invention is not limited to formatting data into a graph or chart format. That is, the present invention can also take the data illustrated in FIG. 3B and place it into a table where the Cartesian coordinates of FIG. 3B are associated with respective values of the stair step type functions in a tabular or table format. Further, when the present invention is embodied in a chart or table format, the process can be automated without departing from the scope and spirit of the present invention.
- Step 405 A is the first step of the optimum display size calculation process 400 A in which an encoded visual object is received from a communications medium such as from across a computer network such as the internet or a local area network.
- Step 410 A from each frame, a set of frames, or a sample of frames, or a combination thereof, an average step size is determined from the visual object based on a first transform coefficient.
- the decoder 172 can review the step size history of a visual object compression format's quantizers. That is, in many compression formats, quantization methods can be used to round off or quantize Discrete Cosine Transform (DCT) coefficients.
- DCT Discrete Cosine Transform
- Discrete Cosine Transform is a technique for expressing a waveform as a weighted sum of cosines.
- the method can be expressed as follows: Given data A(i), where i is an integer in the range 0 to N-1, the forward DCT (which would be used e.g.
- DCT discrete Fourier transform
- Step 415 A similar to Step 410 A, for each frame, a set of frames, a sample of frames, or a combination thereof, an average step size based on a second transformed coefficient can be determined from the visual object.
- Step 420 A the appropriate function can be calculated with the first and second average step size sets. In one exemplary embodiment, a mean value could be calculated from the first and second average step size sets.
- Step 425 A the final step size parameter can be calculated from the appropriate functions defined above. Once the final step size parameter is calculated in Step 425 A, then in Step 430 A, a coding difficulty value can be ascertained based upon the final step size parameter. In Step 430 A, an estimated harmonic mean of the peak signal to noise ratio can be calculated. Similar to FIG. 3B, the relationship between the final step size parameter calculated in Step 425 A and the estimated harmonic mean of the peaked signal noise ratio can be empirically determined.
- Routine 435 A the optimum display size for the visual object is determined based upon the coding difficulty value (the estimated harmonic mean of the PSNR) and the transmission rate. Subsequently, in Step 440 A, the received and coded visual object is decoded. In decision Step 445 A, it is determined whether the visual object the calculated optimum display size should be displayed. If the inquiry to decision Step 445 A is positive, then the “yes” branch is followed to Step 450 A in which the visual object with the calculated optimum display size is displayed. If the inquiry to decision Step 445 A is negative, then the “no” branch is followed to Step 455 A in which the visual object is displayed with a default or selected display size.
- decision Step 445 A can comprise various options. That is, decision Step 445 A can be embodied in a default setting for rendering a visual object. Alternatively, Step 445 A can be embodied in pull down menus that enable a user to select whether automated display size calculation will be performed.
- FIG. 4B this figure illustrates a method for calculating an optimum display size based upon a visual object transmission rate. As noted above, certain steps can be performed in a different order with out departing from the spirit and scope of the present invention. The process depicted in FIG. 4B differs slightly from the process described in FIG. 4A.
- steps 410 A through 435 have been deleted and replaced with step 437 where the optimum display size is calculated only as a function of the visual object transmission rate.
- FIG. 4C this figure illustrates a method for calculating an optimum display size based upon a coding difficulty value alone. As noted above, certain steps can be performed in a different order with out departing from the spirit and scope of the present invention. The process depicted in FIG. 4C differs slightly from the process described in FIG. 4A.
- step 435 has been replaced with step 438 where the optimum display size is calculated only as a function of the coding difficulty value.
- steps 405 A through 430 A could be eliminated since the coding difficulty value could be received with the encoded visual object.
Landscapes
- Engineering & Computer Science (AREA)
- Multimedia (AREA)
- Signal Processing (AREA)
- Physics & Mathematics (AREA)
- General Physics & Mathematics (AREA)
- Theoretical Computer Science (AREA)
- Computer Vision & Pattern Recognition (AREA)
- Discrete Mathematics (AREA)
- Compression Or Coding Systems Of Tv Signals (AREA)
- Testing, Inspecting, Measuring Of Stereoscopic Televisions And Televisions (AREA)
- Facsimile Image Signal Circuits (AREA)
- Image Processing (AREA)
Abstract
Description
- The present application claims priority to provisional patent application entitled, “VIDEO PROCESSING METHOD WITH GENERAL AND SPECIFIC APPLICATIONS,” filed on Jul. 11, 2000 and assigned U.S. application Ser. No. 60/217,301. The present application is also related to non-provisional application entitled, “ADAPTIVE EDGE DETECTION AND ENHANCEMENT FOR IMAGE PROCESSING,” (attorney docket number 07816-105003) filed on Jul. 11, 2001 and assigned U.S. application Ser. No. ______; and non-provisional application entitled, “VIDEO COMPRESSION USING ADAPTIVE SELECTION OF GROUPS OF FRAMES, ADAPTIVE BIT ALLOCATION, AND ADAPTIVE REPLENISHMENT,” (attorney docket number 07816-105004) filed on Jul. 11, 2001 and assigned U.S. application Ser. No.______.
- The present invention relates generally to video processing techniques. More particularly, the present invention relates to a method and system for calculating an optimum display size for a visual object.
- Computer networks such as the internet, local area networks, and wide area networks have become the preferred communication medium for sending and receiving both traditional and new forms of multi-media content. For example, receiving digital video over the internet that is displayed on a computer screen has become very popular. Digital video involves storing, moving, and calculating extremely large volumes of data compared to other kinds of computer files. While the data rate and file size of uncompressed digital video can overwhelm many personal computers and hard disks, compressed video can lower the data rate of the digital video into a range that a particular computer system can handle.
- Compression is often defined as the coding of data to save storage space or transmission time. Although data can be coded in digital form for computer processing, data can be coded more efficiently with compression, using fewer bits. Video compression involves the compression of sequences of images. Video compression algorithms typically use the fact that there are usually only small changes from one “frame” to the next so they only need to encode the starting frame and a sequence of differences between frames.
- The ISO Committee that generates standards for digital video compression and audio is the Moving Picture Experts Group (“MPEG”). MPEG also refers to the name of this Committee's algorithms for video compression. MPEG-1 was the first MPEG format for compressed video that was optimized for CD-ROM. MPEG-1 was designed for transmission rates of about 1.1 megabits per second achievable with video-CD and CD-i. Another compression algorithm is MPEG-2, which is a variant of the MPEG video and audio compression algorithm in file format that was optimized for broadcast quality video. MPEG-2 was designed to transmit images using progressive coding at 4 megabits per second or higher for use in broadcast digital TV and DVD.
- A proposed variant of the MPEG video and audio compression algorithm in file format was MPEG-3. MPEG-3 was intended as an extension of MPEG-2 to cater for HDTV but was eventually merged into MPEG-2. MPEG-4 is another video compression algorithm that was planned for the year of 1998. MPEG-4 extends the earlier MPEG-1 and MPEG-2 algorithms with synthesis of speech and video, fractal compression, computer visualization and artificial intelligence-based image processing techniques.
- Many conventional media players that are designed to receive multimedia from the internet, such as the WINDOWS® Media Player and APPLE® Quick Time, utilize the MPEG-1 format for compressed video. The MPEG-1 format utilizes discrete cosine transform (“DCT”) and Huffinan Coding to remove spatially redundant data within a frame and block-based motion compensated prediction (“MCP”) to remove data which is temporally redundant between frames. Audio with the MPEG-1 format is typically compressed using subband encoding. The MPEG-1 algorithm allows better than VHS quality video and almost CD quality audio to be compressed onto and streamed off of a single speed (1x) CD-ROM drive.
- While the aforementioned compression techniques may permit the transmission of visual objects over a computer network, such compression techniques can introduce artifacts or distortion in the video as a direct result of the compression techniques. For example, MPEG-1 encoding can introduce artifacts such as blockiness, mosquito noise, color bleeding, and shimmering effects within the video in addition to a lack of detail in quantization effects in audio. While the effects of the compression techniques on the video segments of a multimedia presentation may be negligible in some instances, typically the artifacts and distortion generated by the compression techniques become quite apparent to a user when a visual object such as video is enlarged on a display device.
- For example, in many conventional systems utilizing compressed video, the video decoder sets a nominal fixed display size and the user of the video decoder may have options for manually enlarging the display size by activating pixel repetition or interpolation routines in the media player. When a decoded or uncompressed video signal is enlarged, both the raw components of the original uncompressed video signal as well as the distortion caused by the compression techniques are enlarged. In order words, an enlarged image with a conventional media player typically enlarges or amplifies both the original video signal and the distortion.
- Consequently, in conventional real time streaming of the video, frequently the size of the video is fairly small relative to the size of the display device. In other words, conventional streamed video is typically not a full screen experience since it is recognized that both the original uncompressed video signal as well as the distortion caused by the compression techniques can be noticeable or recognizable by a user when a large screen rendition of a video object is selected. Therefore, some conventional media players do not even permit the selection for enlarging a video segment. The video segments are typically fixed at small display sizes in order compensate for the artifacts or distortion created by the video compression techniques.
- In addition to compression related artifacts discussed above, there also exists packet loss related artifacts that are a result of the transmission speed of a multimedia segment. For example, low bit rates can also contribute to the artifacts or distortion when compressed video is decoded. Low bit rates can be defined as data transmission rates that are at approximately twenty-five percent (25%) of a standard speed. For example, if MPEG-1 is a reference standard, then transmission rates of about 1.1 megabits per second would be the norm for the standard rate. A low rate would be about twenty-five percent (25%) of the normal rate and, therefore, 250 megabits per second could be categorized as a low bit rate.
- Referring now FIG. 1A, this figure illustrates one
exemplary frame 100A of avisual object 105A at a first size relative to the frame's original size. FIG. 1A could be referred to as the optimum display size for theexemplary frame 100A since artifacts or distortion are not readily perceived by the user. - Opposite to FIG. 1A, FIG. 1B illustrates an
exemplary frame 100B of thevisual object 105B illustrated in FIG. 1A at a second size of the frame's original size that is much larger than the first size illustrated in FIG. 1A. In FIG. 1B, artifacts or distortion such asmosquito noise shimmering effects 120 can be perceived in this enlargement of the exemplary frame of avisual object 100B. - While the enlargement techniques of the conventional art may magnify or amplify the artifacts or distortion caused by compression or low transmission rates, enlarging of visual objects as well as reducing the size of visual objects are features that are desirable to the user. In other words, permitting enlargement or reduction in size of a visual object enables efficient use of the work space on a display device. However, as noted above, a balance should be struck between displaying a visual object large enough to be comfortably viewed by a user while at the same time, displaying the visual object at a size that does not permit image degradations due to compression or transmission to be noticeable or easily perceived by the user.
- Accordingly, there is a need in the art for a method and system for calculating an optimum display size for a visual object. That is, there is a need in the art for a method and system for automatically selecting the optimal size of a visual object that can be displayed on a display device. Further, there is an need in the art for a method and system that can determine the best size to display a visual object received from a computer network to a computer screen such that image degradations due to compression or transmission defects or both are less noticeable or not readily perceivable by a user. There is a further need in the art for a method and system that can display a message indicating the optimal display size and receive input as to whether the optimal display size is selected by a user.
- The present invention is generally drawn to a method and system for automatically selecting the optimal size of a visual object that can be displayed on a display device. For example, the present invention can determine the best or optimum size to display a visual object received from a computer network to a computer screen such that image degradations due to compression or transmission defects are less noticeable or perceivable. Typically, the best or optimum size to display a visual object can comprise a size that is also the maximum in which the visual object can be displayed without any degradations or defects.
- According to one exemplary aspect, the present invention can automatically perform the sizing of the received visual object. According to another exemplary aspect, the invention can display a message indicating the optimal display size and receive input as to whether the optimal display size is selected by a user. The visual object can comprise one of video, a graphical image, and other like visual objects. The visual object can be transmitted across various types of communication mediums in various formats. The communication mediums can comprise computer networks, wireless networks, infra-red transmissions, electromagnetic couplings, and other similar communication mediums. The formats of the visual objects can include downloadable files, internet streaming, and visual objects retrievable from storage mediums such as CD-ROMs or DVDs. The display devices for the present invention can include a printer, cathode ray tubes (CRTs), liquid crystal displays (LCDs), light emitting diode (LED) displays, and projectors. These display devices can be part of various equipment such as computers (laptops, desktops, handhelds—such as PDAs, etc.), televisions, cellular telephones, and other similar equipment.
- According to one aspect, a coding difficulty value can be calculated after compressing a visual object in a conventional format, such as Moving Picture Experts Group (MPEG) format, for computer network transmission. One exemplary coding difficulty value can comprise a harmonic average of the Peak Signal to Noise Ratio (PSNR) for a number of frames taken from the visual object. This coding difficulty value can reflect the presence of visual object segments that will likely be coded poorly. An encoder can calculate the harmonic average of the PSNR based upon the original visual object to be encoded. More specifically, the visual object encoder can calculate the PSNR for each frame of the original visual object or by reviewing a set of frames or a sample of frames and comparing the frame or set of frames to the compressed video. Using the PSNR values for the number of frames evaluated, the encoder can then calculate the harmonic mean of the PSNR values.
- The coding difficulty value of the present invention is not limited to the harmonic average of the PSNR. Other coding difficulty values are not beyond the scope of the present invention. For example, the coding difficulty value could comprise the straight average of the PSNR values for a number of frames of visual object or any other subjectively relevant metric.
- According to one exemplary aspect of the present invention, once the coding difficulty value is determined, the optimum display size for the encoded visual object can be determined based upon the coding difficulty value and one or more other parameters. More specifically, according to one aspect, the optimum display size can be determined based upon the coding difficulty value and the coding bit rate. With at least these two parameters, the coding bit rate and the coding difficulty value, the optimum display size that can provide the most clear and largest presentation of the encoded visual object can be determined. The optimum display size along with the encoded visual object can then be transmitted to a receiver or decoder side of the system.
- The present invention is not limited to the coding difficulty and coding bit rate parameters for determining an optimum display size. Other parameters include, but are not limited to, screen quality such as screen size and screen resolution (dots per inch—dpi) capability.
- According to a further exemplary aspect of the present invention, once the coding difficulty value is determined, the coding difficulty value can then be transmitted with the encoded visual object over a communications medium such as a computer network. Next, during reception of the encoded visual object and coding difficulty value, the optimum display size for the encoded visual object can be determined based upon the coding difficulty value and one or more other parameters. More specifically, according to one aspect, the optimum display size can be determined based upon the coding difficulty value and the coding bit rate. With these two parameters, the coding bit rate and the coding difficulty value, the optimum display size that can provide the most clear and largest presentation of the encoded visual object can be determined.
- According to one aspect, the optimum display size can be determined by mapping the coding difficulty value and the visual object transmission rate on a graph, where the coding difficulty value can define the x-coordinate and the visual object transmission rate can define the y-coordinate in a Cartesian coordinate system. The Cartesian coordinate system can further comprise a plurality of diagonal zones as well as stair-step type functions. Depending upon where a particular set of coordinates will fall within a particular stair-step type function can provide information as to the amount a particular visual object can be sized. In other words, each stair step type function may be associated with a fixed value defining a size of the visual object relative to a computer screen. For example, each stair step function can comprise a twenty to twenty-five percent increase in size relative to each other and vice-versa. The diagonal zones and stair step functions can be calculated empirically.
- Once the optimum display size is calculated for a particular visual object that is to be decoded, the present invention can automatically size the visual object according to this calculation or the calculated display size can be displayed as an option that can be selected. If the option is selected, then the visual object can be decoded and displayed at the calculated optimum display size.
- According to another aspect of the present invention, a coding difficulty value can be calculated after a visual object has been compressed in a conventional format, such as Moving Picture Experts Group (MPEG) format, for computer network transmission. A decoder can review the step size history of the compression format's quantizers. That is, in many compression formats, quantization methods can be used to round off or quantize discrete cosine transform (DCT) coefficients. A step size can comprise the quantization of DCT coefficients. By evaluating the steps sizes for frames of a particular encoded visual object, then the PSNR can be estimated. More specifically, the harmonic average of the PSNR can be estimated or approximated by looking at a mean value of step sizes for a set of frames for an encoded visual object. This estimation of the harmonic average of the PSNR can be derived empirically. Once the estimated harmonic average of the PSNR is determined, the optimum display size can be calculated, as discussed above, by mapping the harmonic average of the PSNR and the visual object transmission rate and determining the zone in which the coordinates are located.
- According to a further aspect of the present invention, the optimum display size can be calculated as a function of the coding difficulty value alone. Alternatively, the optimum display size can be calculated as a function of the visual object transmission rate or encoding rate alone.
- FIG. 1A illustrates one exemplary frame of a visual object at a first size of its original size according to one exemplary embodiment of the present invention.
- FIG. 1B illustrates a conventional exemplary frame of the visual object depicted in FIG. 1A at a second size of its original size that is larger than the first size.
- FIG. 1C illustrates an encoding system for calculating a coding difficulty value and for encoding a visual object according to one exemplary embodiment of the present invention.
- FIG. 1D illustrates a decoding system for calculating a coding difficulty value and for decoding an encoded visual object after receiving the encoded visual object according to another exemplary embodiment of the present invention.
- FIG. 2A illustrates a method for calculating an optimum display size at an encoder, transmitting the calculated optimum display size to a receiver, and rendering a visual object according to the calculated optimum display size in one exemplary embodiment of the present invention.
- FIG. 2B illustrates a method for calculating a coding difficulty value at an encoder, transmitting the calculated coding difficulty value to a receiver, and rendering a visual object according to the calculated optimum display size in one exemplary embodiment of the present invention.
- FIG. 2C illustrates a method for calculating an optimum display size at an encoder based on a coding difficulty value alone, transmitting the calculated optimum display size to a receiver, and rendering a visual object according to the calculated optimum display size in one exemplary embodiment of the present invention.
- FIG. 2D illustrates a method for calculating a coding difficulty value at an encoder, transmitting the calculated coding difficulty value to a receiver, and rendering a visual object according to the calculated optimum display size based on the coding difficulty value alone in one exemplary embodiment of the present invention.
- FIG. 3A illustrates a subroutine of FIGS. 2A, 2B, and 4A for determining the optimum display size of a visual object according to one exemplary embodiment of the present invention.
- FIG. 3B is a graph illustrating relationships between harmonic peak signal to noise ratios and a visual object transmission rate that may comprise stair step type functions or diagonal zones in accordance with an exemplary embodiment of the present invention.
- FIG. 4A illustrates a method for calculating an optimum display size at a decoder and rendering visual object according to the calculated optimum display size according to one exemplary embodiment of the present invention.
- FIG. 4B illustrates a method for calculating an optimum display size at a decoder based upon the visual object transmission rate alone and rendering visual object according to the calculated optimum display size according to one exemplary embodiment of the present invention.
- FIG. 4C illustrates a method for calculating an optimum display size at a decoder and rendering visual object according to the calculated optimum display size that is based on a coding difficulty value alone according to one exemplary embodiment of the present invention.
- The present invention can determine the maximum size to display a visual object received from a computer network to a computer screen such that image degradations due to compression or transmission defects are the least noticeable. The visual object can comprise one of video, a graphical image, and other like visual objects. In one exemplary embodiment, a coding difficulty value can be calculated during compression of a visual object in a conventional format, such as Moving Picture Experts Group (MPEG) format, for computer network transmission. According to another aspect of the present invention, a coding difficulty value can be calculated from a received coded or compressed visual object that was transmitted over a computer network. An optimum display size can be calculated by mapping the harmonic average of the PSNR and the visual object transmission rate and determining the zone in which the coordinates are located.
- Illustrative Operating Environment
- The present invention can be embodied in software that runs on a computer. The processes and operations performed by a computer include the manipulation of signals by a processor and the maintenance of these signals within data structures resident in one or more memory storage devices. For the purposes of this discussion, a process is generally conceived to be a sequence of computer-executed steps leading to a desired result. These steps usually require physical manipulations of physical quantities. Usually, though not necessarily, these quantities take the form of electrical, magnetic, or optical signals capable of being stored, transferred, combined, compared, or otherwise manipulated. It is convention for those skilled in the art to refer to representations of these signals as bits, bytes, words, information, elements, symbols, characters, numbers, points, data, entries, objects, images, files, or the like. It should be kept in mind, however, that these and similar terms are associated with appropriate physical quantities for computer operations, and that these terms are merely conventional labels applied to physical quantities that exist within and during operation of the computer.
- It should also be understood that manipulations within the computer are often referred to in terms such as creating, adding, calculating, comparing, moving, receiving, determining, identifying, populating, loading, executing, etc. that are often associated with manual operations performed by a human operator. The operations described herein can be machine operations performed in conjunction with various input provided by a human operator or user that interacts with the computer.
- In addition, it should be understood that the programs, processes, methods, etc. described herein are not related or limited to any particular computer or apparatus. Rather, various types of general purpose machines may be used with the functions described herein. Similarly, it may prove advantageous to construct a specialized apparatus to perform the method steps described herein by way of dedicated computer systems in a specific network architecture with hard-wired logic or programs stored in nonvolatile memory, such as read-only memory.
- Referring now to the drawings, in which like numerals represent like elements throughout the several Figures, aspects of the present invention and the illustrative operating environment will be described. FIG. 1A illustrates one
exemplary frame 100A of avisual object 105A at a first size relative to its original size. The size of theexemplary frame 100A illustrated in FIG. 1A can be the optimum display size for thevisual object 105A. The optimum size of avisual object 105A can be defined as the size of avisual object 105A at which artifacts or distortion are not literally perceivable or apparent to a user. Stated differently, the optimum display size can be defined as the maximum size at which avisual object 105A can be displayed on the display device without apparent or readily perceivable artifacts or distortion caused by compression or transmission rate or both. - A visual object can comprise one of video, a single graphical image, or other like visual objects. The graphical image can comprise one of a banner advertisement, a photograph, and a graphical object. The video can comprise one of a live television signal and stored video. More specifically, the formats of the visual objects can include downloadable files, internet streaming, and visual objects retrievable from storage mediums such as CD-ROMs or DVDs. The display devices that can render
frame 100A of FIG. 1A can comprise printers, monitors for desktop or laptop computers such as cathode ray tubes (CRT) or liquid crystal displays (LCDs), handheld computers such as Personal Digital Assistants (PDAs), cellular telephones, watch displays, and other like devices.Frame 100A can be transmitted over various communication mediums. - For example,
frame 100A can be transmitted over a computer network such as a local area network (LAN) or the Internet. However, the present invention is not limited to these communication mediums. Other communication mediums include, but are not limited to, wireless communication links such as radio frequency communications, infra red communications, electromagnetic coupling, and other similar communication mediums. - System for Calculating Optimum Display Size of a Visual Object
- Referring now to FIG. 1C, this figure illustrates a functional block diagram of an
encoding system 100 for calculating a coding difficulty value of a visual object according to one exemplary embodiment of the present invention. The exemplary encoding system 125 can comprise ascene change detector 130, a temporal bit allocator 135, arate controller 140, and apreprocessing filter 145. Thescene change detector 130 is connected to the temporal bit allocator 135. The temporal bit allocator is connected to therate controller 140. Theencoding system 100 receives a video input signal and an audio input signal. The video input is typically a series of digitized images that are linked together in series. The audio input is simply the audio signal that is associated with the series of images making up the video input. - The video input is first passed through a
pre-processing filter 145 that, among other things, filters noise from the video input to prepare the input video stream for encoding. The input video stream is then passed to the visual object orvideo encoder 150. Thevideo encoder 150 compresses the video signal by eliminating irrelevant and/or redundant data from the input video signal. Thevideo encoder 150 may reduce the input video signal to a predetermined size to match the transmission requirements of theencoding system 100. Alternatively, thevideo encoder 150 may simply be configured to minimize the size of the encoded video signal. This configuration might be used, for example, to maximize the storage capacity of a storage medium (e.g., hard drive). Thevideo encoder 150 can perform the compression process by reducing the input data rate to a level that can be supported by the storage or transmission medium. It can also translate the compressed bit stream into a signal suitable for either storage or transmission. Thevideo encoder 150 can also calculate the mean square error (MSE) for the one or more frames of the visual object of interest. Thevideo encoder 150 can further calculate a coding difficulty value as will be discussed in further detail below with respect to FIG. 2. - In a similar fashion, the audio input is compressed by the
audio encoder 160. The encoded audio signal is then passed with the encoded video signal to thevideo stream multiplexer 165. Thevideo stream multiplexer 165 combines the encoded audio signal and the encoded video signal so that the signals can be separated and played-back substantially simultaneously. After the encoded video and encoded audio signals have been combined, the encoding system outputs the combined signal as an encoded video stream. The encoded video stream is thus prepared for transmission, storage, or other processing as needed by a particular application. Often, the encoded video stream will be transmitted to a decoding system that will decode the encoding video stream and prepare it for subsequent display. - In an exemplary embodiment of the present invention, the video input stream can be further processed prior to encoding. In addition to the pre-processing performed by the
pre-processing filter 145, theencoding system 100 of exemplary embodiment of the present invention also can prepare the input video stream for encoding by modifying the input video stream to facilitate compression. Theexemplary encoding system 100 includes a picture grouping module orscene change detector 130, a bit allocation module ortemporal allocator 135, and abit rate controller 140. - The
picture grouping module 130 can process a video input stream by selecting and classifying I-pictures in the video stream. Thepicture grouping module 130 can also select and classify P-pictures in the video stream. Thepicture grouping module 130 can significantly improve the quality of the encoded video stream. Conventional encoding systems arbitrarily select I-pictures, by adhering to fixed-size picture groups. Thecoding system 100 is more fully described in co-pending non-provisional patent application entitled, “VIDEO COMPRESSION USING ADAPTIVE SELECTION OF GROUPS OF FRAMES, ADAPTIVE BIT ALLOCATION, AND ADAPTIVE REPLENISHMENT,” (attorney docket number 07816-105004) filed on Jul. 11, 2001 and assigned U.S. application Ser. No. ______, the contents of which are hereby incorporated by reference. - The
bit allocation module 135 can be used to enhance the quality of the encoded video bit stream by adaptively allocating bits among the groups of pictures defined by thepicture grouping module 130 and by allocating bits among the pictures within a given group of pictures. Whereas conventional decoding systems often allocate bits in an arbitrary manner, theallocation module 135 can reallocate bits from the picture groups requiring less video data to picture groups requiring more video data. Consequently, the quality of the encoded video bit stream is enhanced by improving the quality of the groups of pictures requiring more video data for high quality representation. - The
bit rate controller 140 can use an improved method of conditional replenishment to further reduce the presence of noise in an encoded video bit stream. Conditional replenishment is a well-known aspect of video data compression. In conventional encoding systems, a picture element or a picture block will be encoded in a particular picture if the picture element or block has changed when compared to a previous picture. Where the picture element or block has not changed, the encoder will typically set a flag or send an instruction to the decoder to simply replenish the picture element or block with the corresponding picture element or block from the previous picture. - The
bit rate controller 140 can focus on macroblocks and may condition the replenishment of a macroblock on the change of one or more picture elements and/or blocks within the macroblock, as discussed in co-pending non-provisional patent application entitled, “VIDEO COMPRESSION USING ADAPTIVE SELECTION OF GROUPS OF FRAMES, ADAPTIVE BIT ALLOCATION, AND ADAPTIVE REPLENISHMENT,” (attorney docket number 07816-105004) filed on Jul. 11, 2001 and assigned U.S. application Ser. No. ______, the contents of which are hereby incorporated by reference. Alternatively, thebit rate controller 140 may condition the replacement of a macroblock on a quantification of the change within the macroblock (e.g., the average change of each block) meeting a certain threshold requirement. In any event, the objective of thebit rate controller 140 is to further reduce the presence of noise in video data and to simplify the encoding of a video stream. - The exemplary encoding system 125 may further comprise a
display size selector 155. Thedisplay size selector 155 can then determine the optimum display size by utilizing the coding difficulty value calculated by thevisual object encoder 150 in addition to other parameters as will be discussed in further detail below with respect to FIG. 2. Thedisplay size selector 155 has been illustrated with dashed lines to indicate that in other exemplary embodiments, this element can be eliminated when the coding difficulty value is transmitted over a communications medium so that a decoder 167 with adisplay size selector 175 can determine the optimum display size as will be discussed below with respect to the exemplary embodiment illustrated in FIG. 2B. - Referring now to FIG. 1D, this figure illustrates a functional block diagram of a decoding system 167 for calculating a coding difficulty value after receiving the encoded visual object according to another exemplary embodiment of the present invention. The decoding system 167 receives an encoded video stream as input to a
video stream demultiplexer 170. Thevideo stream demultiplexer 170 separates the encoded video signal and the encoded audio signal from the encoded video stream. The encoded video signal is passed from thevideo stream demultiplexer 170 to thevideo decoder 172. Similarly, the encoded audio signal is passed from thevideo stream demultiplexer 170 to theaudio decoder 182. Thevideo decoder 172 and aaudio decoder 182 expand the video signal and the audio signal to a size that is substantially identical to the size of the video input and audio input. - Those skilled in the art will appreciate that various well-known algorithms and processes exist for decoding an encoded video and/or audio signal. It will also be appreciated that most encoding and decoding processes are lossy, in that some of the data in the original input signal is lost. Accordingly, the
video decoder 172 will reconstruct the video signal with some signal degradation is often receivable as flaws in the output image. The video orvisual object decoder 172 can review the step size history of the compressed visual object as will be discussed in further detail below with respect to FIG. 4A. - The
post-processing filter 177 is used to counteract some of the well-known noise found in a decoded video signal. That has been encoded and/or decoded using a lossy process. Examples of such well-known noise types include mosquito noise, salt-and-pepper noise, and blockiness. Theconventional post-processing filter 177 includes well-known algorithms to detect and counteract these and other known noise problems. Thepost-processing filter 177 generates a filtered, decoded video output. Thepost processing filter 177 can filter the decoded visual object to improve a user's perception of the accuracy of the rendered visual object. - However, in one exemplary embodiment, the
post-processing filter 177 typically has no impact on the process for determining the optimal display size of the visual object. In other words, thepost-processing filter 177, in some exemplary embodiments, does not directly affect the display size algorithm, but helps increase the impact of a decoded visual object. Lowering noise level with apost-processing filter 177 can create a conservative situation for displaying a visual object at a larger size. - The
display size selector 175 can determine the optimum display size of a visual object by utilizing an estimate of the coding difficulty value based upon the step sizes calculated by thevisual object encoder 150 as will be discussed in further detail below with respect to FIG. 4A. Thevisual object renderer 180 can change the size of a visual object by repeating pixels or performing linear extrapolation by using linear filtering methods. Thevisual object renderer 180 will size the visual object based upon information received from thedisplay size selector 175. - The video output and the audio output (via audio output device 185) may be fed to appropriate ports on a display device, such as a television, or may be provided to some other display means such as a software-based media playback component on a computer. Alternatively, the video output and the audio output may be stored for subsequent display.
- As described above, the
video decoder 172 decompresses or expands the encoded video signal. While there are various well-known methods for encoding and decoding a video signal, in all of the methods, the decoder must be able to interpret the encoded signal. The typical decoder is able to interpret the encoded signal received from an encoder, as long as the encoded signal conforms to an accepted video signal encoding standard, such as the well-known MPEG1 and MPEG2 standards. In addition to raw video data, the encoder typically encodes instructions to the decoder as to how the raw video data should be interpreted and represented (i.e., displayed). - For example, an encoded video stream may include instructions that a subsequent video picture is identical to a previous picture in a video stream. In this case, the encoded video stream can be further compressed, because the encoder need not send any raw video data for the subsequent video picture. When the decoder receives the instruction, the decoder will simply represent the subsequent picture using the same raw video data provided for the previous picture. Those skilled in the art will appreciate that such instructions can be provided in a variety of ways, including setting a flag or bit within a data stream.
- Exemplary Methods for Calculating an Optimum Display Size of a Visual Object
- Certain steps in the processes described below must naturally precede others for the present invention to function as described. However, the present invention is not limited to the order of the steps described if such order or sequence does not alter the functionality of the present invention. That is, it is recognized that some steps may be performed before or after other steps without departing from the scope and spirit of the present invention.
- Referring now to FIG. 2A, this figure illustrates a method for calculating an optimum display size at an encoder, such as encoding system 125, and rendering a visual object according to the calculated optimum display size.
Step 205A is the first step of the process for calculating an optimum display size at an encoder. Instep 205A, a visual object such as a video segment is encoded according to a predetermined format. For example, thevisual object encoder 150 can encode the received visual object according to the MPEG-1 video compression format. - Next, in
step 210A, for each frame or a set of frames or a sample of frames from the original visual object, a coding difficulty value can be calculated as a function of the signal-to-noise ratio (SNR). Instep 210A, the peak signal-to-noise ratio (PSNR) of a particular frame can be calculated with theencoder 150 by comparing the original visual object with the encoded visual object. PSNR can be calculated as follows:
- The noise signal energy is defined as the energy measured for a hypothetical signal that is the difference between the encoder input signal and the decoder output signal. Once the peak signal-to-noise ratio is calculated for the frames of interest for the visual object, then the coding difficulty value can be calculated.
- There can be two parameters that control the coding difficulty of a display size: (1) the degree of compression which is signified by the data rate; (2) the inherent difficulty of a scene. The difficulty or complexity of a scene can have many different types of measurements associated with it.
- The coding difficulty value can comprise a harmonic mean of the peak signal-to-noise ratio (PSNR) for one or more frames taken from the visual object. The harmonic mean of the Peak Signal to Noise Ratio (PSNR) can be used to identify the difficulty of scenes within a visual object. This exemplary coding difficulty value can reflect a presence of visual object segments that will likely be coded poorly during the compression process. The coding difficulty and the signal noise ratio are usually inversely related. In other words, the ease of coding is proportional to the harmonic mean and the coding difficulty is the inverse effect so when the harmonic average is higher, larger display sizes are usually suggested. The harmonic mean of the PSNR values (HM-PSNR) for all the frames in the input sequence can be derived from the following equation:

- where HM-PSNR=the harmonic average of the peak signal-to-noise ratio; where N=the number of frames of a visual object; and where MSE=the mean square error for each of the frames of the visual object. Basically, step 210 can be performed by the
visual object encoder 150. - The harmonic mean is a statistic which can emphasize the weakest link in a chain or series of data points. In the context of the present invention, if different segments of the visual object have different levels of fidelity which is measured by the signal to noise ratio, then the harmonic mean physically emphasizes the lower end. In other words, the harmonic mean of the peak to signal noise ratio usually gives a conservative measure of the weakest link or the video segment which may likely have the poorest quality. If the peak values of the signal to noise ratio (PSNR) are used themselves as the measurement of scene complexity, such values may give an overly optimistic view of how successful the video compression has been. If the arithmetic average of the peak to noise ratio is utilized, such a measurement may give a somewhat optimistic view of how good the overall quality of the compression of the video was performed. Therefore, the harmonic mean is typically referred to as an overall statistic that is conservative in nature that is well suited for determining optimal display sizes for visual objects.
- The coding difficulty value of the present invention is not limited to the harmonic mean of the peak signal-to-noise ratio. Other coding difficulty values are not beyond the scope of the present invention. For example, the coding difficulty value could comprise the straight average of the peak signal-to-noise ratio values for a number of frames of a visual object.
- Once the coding difficulty value is calculated in
step 210A, inroutine 215, the optimum display size for thevisual object 105A can be determined based upon the coding difficulty value and the transmission rate of the visual object. Further details of routine 215 will be discussed below with respect to FIG. 3. Alternatively, as will be discussed below with respect to the exemplary embodiments illustrated in FIGS. 2C, 2D, 4B, and 4C, the optimum display size can be calculated based upon either the coding difficulty value or the visual object transmission rate. Further, the optimum display size calculation can also evaluate other parameters in addition to the coding difficulty value and visual object transmission rate. For example, the optimum display size can consider the quality of the display device such as its resolution capabilities (dots per inch - dpi) and the size of the display device, just to name a few alternative and exemplary parameters. Those skilled in the art will recognize that other parameters affecting the calculation of the optimum display size are not beyond the scope of the present invention. Calculation of the optimum display size can be biased or weighted appropriately depending upon these other parameters such as display device quality and size. - Next, in
step 220A, the encoded visual object and optimum display size value are forwarded over a communications medium. For example, the encoded visual object and optimum display size can be transmitted across a computer network such as the Internet or a local area network. The present invention is not limited to communication mediums comprising computer networks. The communication mediums can include, but are not limited to, wireless networks, infra red transmissions, electromagnetic couplings, and other similar communication mediums. - In
step 225A, the received visual object is decoded. Next, indecision step 230A, it is determined whether the visual object is displayed with the calculated optimum display size. Basically,decision step 230A can comprise various options for the system designer. That is,decision step 230A can comprise a prompt for input from a user. In other words, the user could select the optimum display size function as the default size for any visual object received from a network. - Alternatively,
decision step 230A can be embodied in options that are dependent upon payment for a particular service. Stated differently,decision step 230A can be connected to the type of service selected and paid for by a user. In one exemplary embodiment,decision step 230A can be conditioned upon the receipt of a form of payment in order to determine the optimum display size for the visual object.Decision step 230A may further comprise a step of displaying the calculated optimum display size as message so that a user may see the actual calculated optimum display size value. - If the inquiry to
decision step 230A is positive, then the “yes” branch is followed to step 235A, in which the visual object with the calculated optimum display size is displayed. If the inquiry todecision step 230A is negative, then the “no” branch is followed to step 240A, in which the visual object is displayed with a default or selected display size activated by the user varied. - Referring now to FIG. 2B, this figure illustrates a method for calculating a coding difficulty value at an encoder, such as encoding system 125, transmitting the coding difficulty value over a communications medium, and rendering a visual object according to the calculated optimum display size. As noted above, certain steps can be performed in a different order with out departing from the spirit and scope of the present invention. The process depicted in FIG. 2B differs slightly from the process described in FIG. 2A.
- Only the differences between FIGS. 2A and 2B will be discussed with respect to FIG. 2B. Accordingly, in FIG. 2B, step 215A for calculating the optimum display size has been moved to the decoder side or receiver side of the process, as
step 227.Step 220A has been modified asstep 221B such that the coding difficulty value instead of the calculated optimum display size is transmitted over the communications medium. - Referring now to FIG. 2C, this figure illustrates a method for calculating a coding difficulty value and an optimum display size at an encoder, such as encoding system 125, the optimum display size being calculated based on only the coding difficulty value, transmitting the optimum display size over a communications medium, and rendering a visual object according to the calculated optimum display size. As noted above, certain steps can be performed in a different order with out departing from the spirit and scope of the present invention. The process depicted in FIG. 2C differs slightly from the process described in FIG. 2A.
- Only the differences between FIGS. 2A and 2C will be discussed with respect to FIG. 2C. Accordingly, in FIG.
2C step 215 has been modified asstep 216 to calculate the optimum display size based upon only the coding difficulty value instead of the combination of the coding difficulty value and the visual object transmission rate as discussed above. - Referring now to FIG. 2D, this figure illustrates a method for calculating a coding difficulty value at an encoder, such as encoding system 125, transmitting the coding difficulty value over a communications medium, calculating an optimum display size based on the coding difficulty value alone, and rendering a visual object according to the calculated optimum display size. As noted above, certain steps can be performed in a different order with out departing from the spirit and scope of the present invention. The process depicted in FIG. 2D differs slightly from the process described in FIG. 2B.
- Only the differences between FIGS. 2B and 2D will be discussed with respect to FIG. 2D. Accordingly, in FIG.
2D step 227 has been modified asstep 228 to calculate the optimum display size based upon only the coding difficulty value instead of both the coding difficulty value and the visual object transmission rate. - Referring now to FIG. 3A, this figure illustrates the
subroutine 215 of FIG. 2A, in which the optimum display size for a visual object is calculated by thedisplay size selector 155. Step 305 is the first step of routine 215 in which the coding difficulty value calculated in step 210 is ascertained. Instep 310, the visual object transmission rate is also ascertained. In one exemplary embodiment he visual object transmission rate comprises one or more values measured in units of information per unit of time period. More specifically, the visual object transmission rate can comprise a speed at which binary digits are transmitted. For example, the visual object transmission rate in one exemplary embodiment can comprise bits per second. - In
step 315, the coding difficulty value and visual object transmission rate value are mapped to a chart, table, graph, grid or other similar data association mechanism. In one exemplary embodiment, the coding difficulty value defines an X coordinate while the visual object transmission rate defines a Y coordinate in a Cartesian coordinate system. Instep 320, from the coordinates identified instep 315, a zone value corresponding to the coding difficulty value and transmission rate can be identified. Instep 325, this zone value can be associated with an optimum display size value such as the percentage in which a visual object should be enlarged. Further details ofsteps - Referring now to FIG. 3B, this figure is a graph illustrating relationships between the harmonic mean for the peak signal-to-noise ratios (HM-PSNR) and the visual object transmission rate (in kilobits per second or kbps). In FIG. 3B, the harmonic average of the peak signal-to-noise ratio defines the X-axis while the transmission rate defines the Y-axis. FIG. 3B illustrates empirically derived relationships between data transmission rates and a harmonic average of the peak signal-to-noise ratio of a compression technique. The zones A, B, C, D and E can be associated with percent increases of picture size for displaying visual objects. Zone A comprises the region between the X-axis and a first stair
step type function 335. Zone B defines a region between the firststair step function 335 and a secondstair step function 340. - Zone C defines a region between the second stair
step type function 340 and a third stairstep type function 345. Similarly, Zone D defines a region between the third stair step type function and a fourth stairstep type function 350. And lastly, Zone E defines a region extending above the fourth stairstep type function 350. - Each zone of Zones A to E can be associated with a respective percentage increase of the visual object size for each respective zone depicted in FIG. 3B. For example, each zone could define a 20% increase in size relative to a neighboring zone. However, the present invention is not limited to the 20% increments. Other increments, higher or lower, are not beyond the scope of the present invention. In FIG. 3B, it can be assumed that there are five different display size levels. The original size of an encoded image can be assumed to be one quarter (usually, 320×240) of full size (usually, 640×480). Therefore, Zone A can be interpreted to mean there is no blow-up. That is, the decoder can just display the image at the original display size. The maximum display size in FIG. 3B can be 200% of the original size, and this size is associated with zone E. The blow-up factor or percent increase associated with each zone can be as follows: (1-dimensional factors; that is, the actual increased display size will be the square of the following factors): zone A =1x, zone B=1.2x, zone C=1.4x, zone D=1.7x, and zone E=2x.
- Diagonal Zones I, II, III, IV, V and VI can rationalize the empirical procedure taken to define the graph illustrated in FIG. 3B. The diagonal Zones I, II, III, IV, V and VI demonstrate that for a particular sample object, such as
Sample Object 1 which is represented by a triangle in FIG. 3B, each of the data points for theSample Object 1 appear to fall within a diagonal zone of II. - The data points for each sample visual object were calculated by taking a visual object such as a video segment and adjusting the transmission rate. Since the transmission rate affects the coding or compression of a visual object, different harmonic means of the PSNRs were derived for the same sample visual object. For example, for a
first data point 360 ofSample Visual Object 1, thisdata point 360 was encoded for a bit rate of approximately 110 kilobits per second. Such a transmission speed yielded a harmonic average of the PSNR of approximately 30. Thisdata point 360 is located in Zone B. Zone B has an associated percent increase value of 20%. Therefore, the decoded visual object is recommended to be displayed at 120% of its original size to provide the optimal size in which artifacts or distortion caused by the transmission rate or compression algorithm or both are less noticeable. - Similarly, for another
second data point 365 ofSample Visual Object 1, the sample was encoded for a bit rate of approximately 240 kilobits per second. Such a transmission speed yielded a harmonic average of the PSNR of approximately 32.5. Thissecond data point 365 is located in Zone E. Zone E has an associated percent increase value of 100%. Therefore, the decoded visual object is recommended to be displayed at 200% of its original size to provide the optimal size in which artifacts or distortion caused by the transmission rate or compression algorithm or both are less noticeable. - While only six sample visual objects were used to empirically define the relationships illustrated in the graph of FIG. 3B, more or fewer sample objects may be employed without departing from the scope and spirit of the present invention. Further, the present invention is not limited to formatting data into a graph or chart format. That is, the present invention can also take the data illustrated in FIG. 3B and place it into a table where the Cartesian coordinates of FIG. 3B are associated with respective values of the stair step type functions in a tabular or table format. Further, when the present invention is embodied in a chart or table format, the process can be automated without departing from the scope and spirit of the present invention.
- Referring now to FIG. 4A, this figure illustrates an exemplary method for calculating an optimum display size at a decoder and rendering a visual object according to the calculated optimum display size.
Step 405A is the first step of the optimum displaysize calculation process 400A in which an encoded visual object is received from a communications medium such as from across a computer network such as the internet or a local area network. Next, inStep 410A, from each frame, a set of frames, or a sample of frames, or a combination thereof, an average step size is determined from the visual object based on a first transform coefficient. In other words, thedecoder 172 can review the step size history of a visual object compression format's quantizers. That is, in many compression formats, quantization methods can be used to round off or quantize Discrete Cosine Transform (DCT) coefficients. A step size can comprise the quantization of DCT coefficients. - Discrete Cosine Transform is a technique for expressing a waveform as a weighted sum of cosines. The method can be expressed as follows: Given data A(i), where i is an integer in the range 0 to N-1, the forward DCT (which would be used e.g. by an encoder) is:

- The inverse DCT (which would be used e.g. by a decoder) is:

- The main difference between DCT and a discrete Fourier transform (DFT) is that the DFT traditionally assumes that the data A(i) is periodically continued with a period of N, whereas the DCT assumes that the data is continued with its mirror image, then periodically continued with a period of 2N. Mathematically, this transform pair is exact, i.e. AA(i)==A(i), resulting in lossless coding; only when some of the coefficients are approximated does compression occur.
- In
Step 415A, similar toStep 410A, for each frame, a set of frames, a sample of frames, or a combination thereof, an average step size based on a second transformed coefficient can be determined from the visual object. InStep 420A, the appropriate function can be calculated with the first and second average step size sets. In one exemplary embodiment, a mean value could be calculated from the first and second average step size sets. - In
Step 425A, the final step size parameter can be calculated from the appropriate functions defined above. Once the final step size parameter is calculated inStep 425A, then inStep 430A, a coding difficulty value can be ascertained based upon the final step size parameter. InStep 430A, an estimated harmonic mean of the peak signal to noise ratio can be calculated. Similar to FIG. 3B, the relationship between the final step size parameter calculated inStep 425A and the estimated harmonic mean of the peaked signal noise ratio can be empirically determined. - Next, in Routine 435A, the optimum display size for the visual object is determined based upon the coding difficulty value (the estimated harmonic mean of the PSNR) and the transmission rate. Subsequently, in
Step 440A, the received and coded visual object is decoded. Indecision Step 445A, it is determined whether the visual object the calculated optimum display size should be displayed. If the inquiry todecision Step 445A is positive, then the “yes” branch is followed to Step 450A in which the visual object with the calculated optimum display size is displayed. If the inquiry todecision Step 445A is negative, then the “no” branch is followed to Step 455A in which the visual object is displayed with a default or selected display size. - As noted above with respect to
decision Step 230A,decision Step 445A can comprise various options. That is,decision Step 445A can be embodied in a default setting for rendering a visual object. Alternatively,Step 445A can be embodied in pull down menus that enable a user to select whether automated display size calculation will be performed. - Referring now to FIG. 4B, this figure illustrates a method for calculating an optimum display size based upon a visual object transmission rate. As noted above, certain steps can be performed in a different order with out departing from the spirit and scope of the present invention. The process depicted in FIG. 4B differs slightly from the process described in FIG. 4A.
- Only the differences between FIGS. 4A and 4B will be discussed with respect to FIG. 4B. Accordingly, in FIG. 4B, steps 410A through 435 have been deleted and replaced with
step 437 where the optimum display size is calculated only as a function of the visual object transmission rate. - Referring now to FIG. 4C, this figure illustrates a method for calculating an optimum display size based upon a coding difficulty value alone. As noted above, certain steps can be performed in a different order with out departing from the spirit and scope of the present invention. The process depicted in FIG. 4C differs slightly from the process described in FIG. 4A.
- Only the differences between FIGS. 4A and 4C will be discussed with respect to FIG. 4C. Accordingly, in FIG. 4C,
step 435 has been replaced withstep 438 where the optimum display size is calculated only as a function of the coding difficulty value. - It is noted that if the coding difficulty calculation is performed prior to
step 405A of FIG. 4, then steps 405A through 430A could be eliminated since the coding difficulty value could be received with the encoded visual object. - It should be understood that the foregoing relates only to illustrative embodiments of the present invention, and that numerous changes may be made therein without departing from the spirit and scope of the invention as defined by the following claims.
Claims (51)
Priority Applications (1)
| Application Number | Priority Date | Filing Date | Title |
|---|---|---|---|
| US09/902,995 US20020028024A1 (en) | 2000-07-11 | 2001-07-11 | System and method for calculating an optimum display size for a visual object |
Applications Claiming Priority (2)
| Application Number | Priority Date | Filing Date | Title |
|---|---|---|---|
| US21730100P | 2000-07-11 | 2000-07-11 | |
| US09/902,995 US20020028024A1 (en) | 2000-07-11 | 2001-07-11 | System and method for calculating an optimum display size for a visual object |
Publications (1)
| Publication Number | Publication Date |
|---|---|
| US20020028024A1 true US20020028024A1 (en) | 2002-03-07 |
Family
ID=22810485
Family Applications (3)
| Application Number | Title | Priority Date | Filing Date |
|---|---|---|---|
| US09/902,995 Abandoned US20020028024A1 (en) | 2000-07-11 | 2001-07-11 | System and method for calculating an optimum display size for a visual object |
| US09/903,028 Expired - Lifetime US7155067B2 (en) | 2000-07-11 | 2001-07-11 | Adaptive edge detection and enhancement for image processing |
| US09/902,976 Abandoned US20020021756A1 (en) | 2000-07-11 | 2001-07-11 | Video compression using adaptive selection of groups of frames, adaptive bit allocation, and adaptive replenishment |
Family Applications After (2)
| Application Number | Title | Priority Date | Filing Date |
|---|---|---|---|
| US09/903,028 Expired - Lifetime US7155067B2 (en) | 2000-07-11 | 2001-07-11 | Adaptive edge detection and enhancement for image processing |
| US09/902,976 Abandoned US20020021756A1 (en) | 2000-07-11 | 2001-07-11 | Video compression using adaptive selection of groups of frames, adaptive bit allocation, and adaptive replenishment |
Country Status (3)
| Country | Link |
|---|---|
| US (3) | US20020028024A1 (en) |
| AU (3) | AU2001273326A1 (en) |
| WO (3) | WO2002005562A2 (en) |
Cited By (15)
| Publication number | Priority date | Publication date | Assignee | Title |
|---|---|---|---|---|
| US20020112243A1 (en) * | 2001-02-12 | 2002-08-15 | World Theatre | Video distribution system |
| US20020124251A1 (en) * | 2001-02-12 | 2002-09-05 | Hunter Charles E. | Systems and methods for distribution of entertainment and advertising content |
| US20020143975A1 (en) * | 2001-04-02 | 2002-10-03 | Junichi Kimura | Media distribution systems and multi-media conversion server |
| US20030149989A1 (en) * | 2001-09-14 | 2003-08-07 | Hunter Charles Eric | Broadcast distribution of content for storage on hardware protected optical storage media |
| US20050034173A1 (en) * | 2003-08-08 | 2005-02-10 | Kabushiki Kaisha Toshiba | Digital broadcasting receiver and digital broadcasting receiving method |
| US20050163223A1 (en) * | 2003-08-11 | 2005-07-28 | Warner Bros. Entertainment Inc. | Digital media distribution device |
| US20050182730A1 (en) * | 1999-08-27 | 2005-08-18 | Ochoa Optics, Llc | Music distribution system and associated antipiracy protection |
| US20050223335A1 (en) * | 2004-03-31 | 2005-10-06 | Tetsuya Ichikawa | Button processing method and data processing apparatus |
| US20060195548A1 (en) * | 1999-08-27 | 2006-08-31 | Ochoa Optics Llc | Video distribution system |
| US20060212892A1 (en) * | 1999-08-27 | 2006-09-21 | Ochoa Optics Llc | Video distribution system |
| US20060229904A1 (en) * | 1999-08-27 | 2006-10-12 | Ochoa Optics Llc | Music distribution systems |
| US7612792B1 (en) * | 2005-09-07 | 2009-11-03 | Avaya Inc | Method and apparatus for adaptive video encoding based on user perception and use |
| USRE41137E1 (en) | 2000-02-10 | 2010-02-16 | Charles Eric Hunter | Music distribution systems |
| US8090619B1 (en) | 1999-08-27 | 2012-01-03 | Ochoa Optics Llc | Method and system for music distribution |
| US9252898B2 (en) | 2000-01-28 | 2016-02-02 | Zarbaña Digital Fund Llc | Music distribution systems |
Families Citing this family (130)
| Publication number | Priority date | Publication date | Assignee | Title |
|---|---|---|---|---|
| WO1999057683A1 (en) * | 1998-05-04 | 1999-11-11 | The Johns Hopkins University | Method and apparatus for segmenting small structures in images |
| US7177482B2 (en) * | 1999-12-16 | 2007-02-13 | Sony Corporation | Boundary line detection apparatus and method, and image processing apparatus and method as well as recording medium |
| US20020028024A1 (en) * | 2000-07-11 | 2002-03-07 | Mediaflow Llc | System and method for calculating an optimum display size for a visual object |
| JP4150947B2 (en) * | 2000-08-23 | 2008-09-17 | ソニー株式会社 | Image processing apparatus and method, and recording medium |
| KR20020095350A (en) * | 2001-06-14 | 2002-12-26 | 엘지전자 주식회사 | Pattern-adaptive error diffusion apparatus |
| AU2003219404A1 (en) * | 2002-04-23 | 2003-11-10 | Koninklijke Philips Electronics N.V. | Digital image processing method for low-rate applications |
| US11124207B2 (en) * | 2014-03-18 | 2021-09-21 | Transportation Ip Holdings, Llc | Optical route examination system and method |
| US11022982B2 (en) * | 2014-03-18 | 2021-06-01 | Transforation Ip Holdings, Llc | Optical route examination system and method |
| EP1520431B1 (en) | 2002-07-01 | 2018-12-26 | E G Technology Inc. | Efficient compression and transport of video over a network |
| DE10231286B4 (en) | 2002-07-10 | 2004-05-19 | T-Mobile Deutschland Gmbh | Method for the transmission of additional data within a video data transmission |
| JP2004266744A (en) * | 2003-03-04 | 2004-09-24 | Brother Ind Ltd | Image processor, image processing method, and storage medium |
| US7010538B1 (en) * | 2003-03-15 | 2006-03-07 | Damian Black | Method for distributed RDSMS |
| US7336845B2 (en) * | 2003-04-21 | 2008-02-26 | Transpacific Ip Ltd. | Improving modulation transfer function of an image |
| SG115540A1 (en) * | 2003-05-17 | 2005-10-28 | St Microelectronics Asia | An edge enhancement process and system |
| ES2363772T3 (en) * | 2003-09-23 | 2011-08-16 | Thomson Licensing | VIDEO COMFORT NOISE ADDITION TECHNIQUE. |
| JP2005141477A (en) * | 2003-11-06 | 2005-06-02 | Noritsu Koki Co Ltd | Image sharpening process and image processor implementing this process |
| KR100654431B1 (en) * | 2004-03-08 | 2006-12-06 | 삼성전자주식회사 | Method for scalable video coding with variable GOP size, and scalable video coding encoder for the same |
| US7266246B2 (en) * | 2004-04-29 | 2007-09-04 | Hewlett-Packard Development Company, L.P. | System and method for estimating compression noise in images |
| FR2869749B1 (en) * | 2004-04-30 | 2006-10-20 | Sagem | METHOD AND SYSTEM FOR PROCESSING IMAGE BY FILTERING BLOCKS OF IMAGE PIXELS |
| JP5073484B2 (en) * | 2004-05-28 | 2012-11-14 | コーニンクレッカ フィリップス エレクトロニクス エヌ ヴィ | Method, computer program, apparatus and imaging system for image processing |
| KR100618849B1 (en) * | 2004-07-22 | 2006-09-01 | 삼성전자주식회사 | Apparatus and method for filtering blocking effect in image |
| KR20060043050A (en) * | 2004-09-23 | 2006-05-15 | 엘지전자 주식회사 | Method for encoding and decoding video signal |
| US8036932B2 (en) | 2004-11-19 | 2011-10-11 | Repucom America, Llc | Method and system for valuing advertising content |
| US8712831B2 (en) | 2004-11-19 | 2014-04-29 | Repucom America, Llc | Method and system for quantifying viewer awareness of advertising images in a video source |
| JP2006264301A (en) * | 2005-02-22 | 2006-10-05 | Seiko Epson Corp | Printing apparatus, printing program, printing method, image processing apparatus, image processing program, image processing method, and recording medium with programs recorded thereon |
| US7864840B2 (en) * | 2005-04-15 | 2011-01-04 | Inlet Technologies, Inc. | Scene-by-scene digital video processing |
| US7680355B2 (en) * | 2005-05-02 | 2010-03-16 | Intel Corporation | Detection of artifacts resulting from image signal decompression |
| US7657098B2 (en) * | 2005-05-02 | 2010-02-02 | Samsung Electronics Co., Ltd. | Method and apparatus for reducing mosquito noise in decoded video sequence |
| US8422546B2 (en) * | 2005-05-25 | 2013-04-16 | Microsoft Corporation | Adaptive video encoding using a perceptual model |
| KR101120092B1 (en) * | 2005-06-04 | 2012-03-23 | 삼성전자주식회사 | Method for improving quality of composite video signal and the apparatus therefore and method for decoding composite video signal and the apparatus therefore |
| US7865035B2 (en) * | 2005-10-06 | 2011-01-04 | Samsung Electronics Co., Ltd. | Video quality adaptive coding artifact reduction |
| US9479794B2 (en) | 2005-11-10 | 2016-10-25 | Freescale Semiconductor, Inc. | Resource efficient video processing via prediction error computational adjustments |
| JP4455487B2 (en) * | 2005-12-16 | 2010-04-21 | 株式会社東芝 | Decoding device, decoding method, and program |
| JP4747917B2 (en) * | 2006-04-03 | 2011-08-17 | 株式会社日立製作所 | Digital broadcast receiver |
| US8059721B2 (en) | 2006-04-07 | 2011-11-15 | Microsoft Corporation | Estimating sample-domain distortion in the transform domain with rounding compensation |
| US7995649B2 (en) | 2006-04-07 | 2011-08-09 | Microsoft Corporation | Quantization adjustment based on texture level |
| US20070237237A1 (en) * | 2006-04-07 | 2007-10-11 | Microsoft Corporation | Gradient slope detection for video compression |
| US8503536B2 (en) * | 2006-04-07 | 2013-08-06 | Microsoft Corporation | Quantization adjustments for DC shift artifacts |
| US8711925B2 (en) * | 2006-05-05 | 2014-04-29 | Microsoft Corporation | Flexible quantization |
| US8077775B2 (en) * | 2006-05-12 | 2011-12-13 | Freescale Semiconductor, Inc. | System and method of adaptive rate control for a video encoder |
| US7773672B2 (en) * | 2006-05-30 | 2010-08-10 | Freescale Semiconductor, Inc. | Scalable rate control system for a video encoder |
| TWI332351B (en) * | 2006-10-05 | 2010-10-21 | Realtek Semiconductor Corp | Image processing method and device thereof for reduction mosquito noise |
| US9883202B2 (en) * | 2006-10-06 | 2018-01-30 | Nxp Usa, Inc. | Scaling video processing complexity based on power savings factor |
| US20080101338A1 (en) * | 2006-11-01 | 2008-05-01 | Reynolds Douglas F | METHODS AND APPARATUS TO IMPLEMENT HIGHER DATA RATE VOICE OVER INTERNET PROTOCOL (VoIP) SERVICES |
| US8238424B2 (en) * | 2007-02-09 | 2012-08-07 | Microsoft Corporation | Complexity-based adaptive preprocessing for multiple-pass video compression |
| US7881497B2 (en) * | 2007-03-08 | 2011-02-01 | Honeywell International Inc. | Vision based navigation and guidance system |
| US20080240257A1 (en) * | 2007-03-26 | 2008-10-02 | Microsoft Corporation | Using quantization bias that accounts for relations between transform bins and quantization bins |
| US8498335B2 (en) * | 2007-03-26 | 2013-07-30 | Microsoft Corporation | Adaptive deadzone size adjustment in quantization |
| JP4851976B2 (en) * | 2007-03-28 | 2012-01-11 | 富士フイルム株式会社 | Video compression apparatus and operation control method thereof |
| US8243797B2 (en) * | 2007-03-30 | 2012-08-14 | Microsoft Corporation | Regions of interest for quality adjustments |
| US8442337B2 (en) * | 2007-04-18 | 2013-05-14 | Microsoft Corporation | Encoding adjustments for animation content |
| KR101180059B1 (en) * | 2007-05-11 | 2012-09-04 | 삼성전자주식회사 | Image forming apparatus and method thereof |
| US8331438B2 (en) | 2007-06-05 | 2012-12-11 | Microsoft Corporation | Adaptive selection of picture-level quantization parameters for predicted video pictures |
| US8432804B2 (en) * | 2007-11-29 | 2013-04-30 | Hewlett-Packard Development Company, L.P. | Transmitting video streams |
| US20090220169A1 (en) * | 2008-02-28 | 2009-09-03 | Microsoft Corporation | Image enhancement |
| US8245005B2 (en) * | 2008-03-03 | 2012-08-14 | Microsoft Corporation | Probabilistic object relocation |
| US9110791B2 (en) | 2008-03-03 | 2015-08-18 | Microsoft Technology Licensing, Llc | Optimistic object relocation |
| US8189933B2 (en) * | 2008-03-31 | 2012-05-29 | Microsoft Corporation | Classifying and controlling encoding quality for textured, dark smooth and smooth video content |
| US8031963B2 (en) * | 2008-04-09 | 2011-10-04 | Eyep Inc. | Noise filter |
| US8897359B2 (en) | 2008-06-03 | 2014-11-25 | Microsoft Corporation | Adaptive quantization for enhancement layer video coding |
| TWI360790B (en) * | 2008-08-11 | 2012-03-21 | Chunghwa Picture Tubes Ltd | Image compression/decompression device and method |
| CN102318203B (en) * | 2008-11-12 | 2014-10-08 | 汤姆逊许可证公司 | Method and equipment used for encoding video frame containing light change |
| EP2345258A4 (en) * | 2008-11-12 | 2012-04-25 | Thomson Licensing | I-frame de-flickering for gop-parallel multi-thread video encoding |
| WO2010056327A1 (en) * | 2008-11-13 | 2010-05-20 | Thomson Licensing | Multiple thread video encoding using hrd information sharing and bit allocation waiting |
| JP2011029954A (en) * | 2009-07-27 | 2011-02-10 | Sony Corp | Image encoding device and image encoding method |
| US9258531B2 (en) | 2009-07-27 | 2016-02-09 | Utc Fire & Security Corporation | System and method for video-quality enhancement |
| US8279259B2 (en) * | 2009-09-24 | 2012-10-02 | Microsoft Corporation | Mimicking human visual system in detecting blockiness artifacts in compressed video streams |
| CN102483905A (en) * | 2009-09-29 | 2012-05-30 | 松下电器产业株式会社 | Display device and display method |
| US8538163B2 (en) * | 2009-10-13 | 2013-09-17 | Sony Corporation | Method and system for detecting edges within an image |
| KR101114698B1 (en) * | 2010-01-29 | 2012-02-29 | 삼성전자주식회사 | Apparatus and method for edge enhancement according to image characteristics |
| US8472449B2 (en) * | 2010-03-02 | 2013-06-25 | Intrusion, Inc. | Packet file system |
| TWI469631B (en) * | 2010-11-05 | 2015-01-11 | Inst Information Industry | Image processing apparatus and image processing method |
| US9094641B1 (en) * | 2011-06-08 | 2015-07-28 | Arris Enterprises, Inc. | Group of pictures size adjustment |
| US9014255B2 (en) * | 2012-04-03 | 2015-04-21 | Xerox Corporation | System and method for identifying unique portions of videos with validation and predictive scene changes |
| US9978156B2 (en) * | 2012-10-03 | 2018-05-22 | Avago Technologies General Ip (Singapore) Pte. Ltd. | High-throughput image and video compression |
| KR20140110221A (en) * | 2013-03-06 | 2014-09-17 | 삼성전자주식회사 | Video encoder, method of detecting scene change and method of controlling video encoder |
| TW201437966A (en) | 2013-03-29 | 2014-10-01 | Automotive Res & Testing Ct | Adaptive image edge amending apparatus and method thereof |
| KR102025184B1 (en) * | 2013-07-31 | 2019-09-25 | 엘지디스플레이 주식회사 | Apparatus for converting data and display apparatus using the same |
| CN103888761A (en) * | 2013-09-22 | 2014-06-25 | 天津思博科科技发展有限公司 | Decoder for enhancing image quality |
| US10262430B2 (en) * | 2014-04-28 | 2019-04-16 | Eizo Corporation | Annotation line determining unit, annotation line removing unit, medical display, and method therefor |
| US9686449B1 (en) * | 2016-03-18 | 2017-06-20 | Interra Systems, Inc. | Methods and systems for detection of blur artifact in digital video due to high quantization |
| US10096097B2 (en) * | 2016-08-01 | 2018-10-09 | The United States Of America As Represented By The Secretary Of The Navy | Content-aware bidirectional image edge highlighting |
| CN106210718B (en) * | 2016-08-08 | 2019-04-26 | 飞狐信息技术(天津)有限公司 | Scene switching detection method and device in a kind of video sequence |
| US11042161B2 (en) | 2016-11-16 | 2021-06-22 | Symbol Technologies, Llc | Navigation control method and apparatus in a mobile automation system |
| CN108737838A (en) * | 2017-04-19 | 2018-11-02 | 北京金山云网络技术有限公司 | A kind of method for video coding and device |
| US10663590B2 (en) | 2017-05-01 | 2020-05-26 | Symbol Technologies, Llc | Device and method for merging lidar data |
| US11449059B2 (en) | 2017-05-01 | 2022-09-20 | Symbol Technologies, Llc | Obstacle detection for a mobile automation apparatus |
| US10591918B2 (en) | 2017-05-01 | 2020-03-17 | Symbol Technologies, Llc | Fixed segmented lattice planning for a mobile automation apparatus |
| US10726273B2 (en) | 2017-05-01 | 2020-07-28 | Symbol Technologies, Llc | Method and apparatus for shelf feature and object placement detection from shelf images |
| US11367092B2 (en) | 2017-05-01 | 2022-06-21 | Symbol Technologies, Llc | Method and apparatus for extracting and processing price text from an image set |
| US11093896B2 (en) | 2017-05-01 | 2021-08-17 | Symbol Technologies, Llc | Product status detection system |
| US10949798B2 (en) | 2017-05-01 | 2021-03-16 | Symbol Technologies, Llc | Multimodal localization and mapping for a mobile automation apparatus |
| WO2018201423A1 (en) | 2017-05-05 | 2018-11-08 | Symbol Technologies, Llc | Method and apparatus for detecting and interpreting price label text |
| US10489677B2 (en) * | 2017-09-07 | 2019-11-26 | Symbol Technologies, Llc | Method and apparatus for shelf edge detection |
| US10572763B2 (en) | 2017-09-07 | 2020-02-25 | Symbol Technologies, Llc | Method and apparatus for support surface edge detection |
| US10521914B2 (en) | 2017-09-07 | 2019-12-31 | Symbol Technologies, Llc | Multi-sensor object recognition system and method |
| US11327504B2 (en) | 2018-04-05 | 2022-05-10 | Symbol Technologies, Llc | Method, system and apparatus for mobile automation apparatus localization |
| US10832436B2 (en) | 2018-04-05 | 2020-11-10 | Symbol Technologies, Llc | Method, system and apparatus for recovering label positions |
| US10823572B2 (en) | 2018-04-05 | 2020-11-03 | Symbol Technologies, Llc | Method, system and apparatus for generating navigational data |
| US10809078B2 (en) | 2018-04-05 | 2020-10-20 | Symbol Technologies, Llc | Method, system and apparatus for dynamic path generation |
| US10740911B2 (en) | 2018-04-05 | 2020-08-11 | Symbol Technologies, Llc | Method, system and apparatus for correcting translucency artifacts in data representing a support structure |
| US10497258B1 (en) * | 2018-09-10 | 2019-12-03 | Sony Corporation | Vehicle tracking and license plate recognition based on group of pictures (GOP) structure |
| US11010920B2 (en) | 2018-10-05 | 2021-05-18 | Zebra Technologies Corporation | Method, system and apparatus for object detection in point clouds |
| US11506483B2 (en) | 2018-10-05 | 2022-11-22 | Zebra Technologies Corporation | Method, system and apparatus for support structure depth determination |
| US11090811B2 (en) | 2018-11-13 | 2021-08-17 | Zebra Technologies Corporation | Method and apparatus for labeling of support structures |
| US11003188B2 (en) | 2018-11-13 | 2021-05-11 | Zebra Technologies Corporation | Method, system and apparatus for obstacle handling in navigational path generation |
| US11079240B2 (en) | 2018-12-07 | 2021-08-03 | Zebra Technologies Corporation | Method, system and apparatus for adaptive particle filter localization |
| US11416000B2 (en) | 2018-12-07 | 2022-08-16 | Zebra Technologies Corporation | Method and apparatus for navigational ray tracing |
| US11100303B2 (en) | 2018-12-10 | 2021-08-24 | Zebra Technologies Corporation | Method, system and apparatus for auxiliary label detection and association |
| US11015938B2 (en) | 2018-12-12 | 2021-05-25 | Zebra Technologies Corporation | Method, system and apparatus for navigational assistance |
| US10731970B2 (en) | 2018-12-13 | 2020-08-04 | Zebra Technologies Corporation | Method, system and apparatus for support structure detection |
| CA3028708A1 (en) | 2018-12-28 | 2020-06-28 | Zih Corp. | Method, system and apparatus for dynamic loop closure in mapping trajectories |
| US11080566B2 (en) | 2019-06-03 | 2021-08-03 | Zebra Technologies Corporation | Method, system and apparatus for gap detection in support structures with peg regions |
| US11151743B2 (en) | 2019-06-03 | 2021-10-19 | Zebra Technologies Corporation | Method, system and apparatus for end of aisle detection |
| US11402846B2 (en) | 2019-06-03 | 2022-08-02 | Zebra Technologies Corporation | Method, system and apparatus for mitigating data capture light leakage |
| US11960286B2 (en) | 2019-06-03 | 2024-04-16 | Zebra Technologies Corporation | Method, system and apparatus for dynamic task sequencing |
| US11341663B2 (en) | 2019-06-03 | 2022-05-24 | Zebra Technologies Corporation | Method, system and apparatus for detecting support structure obstructions |
| US11662739B2 (en) | 2019-06-03 | 2023-05-30 | Zebra Technologies Corporation | Method, system and apparatus for adaptive ceiling-based localization |
| US11200677B2 (en) | 2019-06-03 | 2021-12-14 | Zebra Technologies Corporation | Method, system and apparatus for shelf edge detection |
| US11507103B2 (en) | 2019-12-04 | 2022-11-22 | Zebra Technologies Corporation | Method, system and apparatus for localization-based historical obstacle handling |
| US11107238B2 (en) | 2019-12-13 | 2021-08-31 | Zebra Technologies Corporation | Method, system and apparatus for detecting item facings |
| US20210192681A1 (en) * | 2019-12-18 | 2021-06-24 | Ati Technologies Ulc | Frame reprojection for virtual reality and augmented reality |
| US11822333B2 (en) | 2020-03-30 | 2023-11-21 | Zebra Technologies Corporation | Method, system and apparatus for data capture illumination control |
| US11450024B2 (en) | 2020-07-17 | 2022-09-20 | Zebra Technologies Corporation | Mixed depth object detection |
| US11593915B2 (en) | 2020-10-21 | 2023-02-28 | Zebra Technologies Corporation | Parallax-tolerant panoramic image generation |
| US11392891B2 (en) | 2020-11-03 | 2022-07-19 | Zebra Technologies Corporation | Item placement detection and optimization in material handling systems |
| US11847832B2 (en) | 2020-11-11 | 2023-12-19 | Zebra Technologies Corporation | Object classification for autonomous navigation systems |
| CN112702616A (en) * | 2020-12-08 | 2021-04-23 | 珠海格力电器股份有限公司 | Processing method and device for playing content |
| CN112967273B (en) * | 2021-03-25 | 2021-11-16 | 北京的卢深视科技有限公司 | Image processing method, electronic device, and storage medium |
| US11954882B2 (en) | 2021-06-17 | 2024-04-09 | Zebra Technologies Corporation | Feature-based georegistration for mobile computing devices |
Citations (29)
| Publication number | Priority date | Publication date | Assignee | Title |
|---|---|---|---|---|
| US5072297A (en) * | 1990-03-27 | 1991-12-10 | Nippon Hoso Kyokai | Method and system for transmitting and receiving PCM audio signals in combination with a video signal |
| US5469212A (en) * | 1992-04-11 | 1995-11-21 | Goldstar Co., Ltd. | Apparatus for compression-encoding and decoding video signals |
| US5566001A (en) * | 1994-07-27 | 1996-10-15 | Motorola, Inc. | Method and apparatus for fax messaging in a selective call receiver system using multiple code-book data compression |
| US5621429A (en) * | 1993-03-16 | 1997-04-15 | Hitachi, Ltd. | Video data display controlling method and video data display processing system |
| US5649052A (en) * | 1994-01-18 | 1997-07-15 | Daewoo Electronics Co Ltd. | Adaptive digital audio encoding system |
| US5699119A (en) * | 1994-03-31 | 1997-12-16 | Samsung Electronics Co., Ltd. | Quantization method and circuit therefor |
| US5805224A (en) * | 1995-02-15 | 1998-09-08 | U.S. Philips Corporation | Method and device for transcoding video signals |
| US5805222A (en) * | 1996-03-29 | 1998-09-08 | Fujitsu Limited | Video coding apparatus |
| US5892847A (en) * | 1994-07-14 | 1999-04-06 | Johnson-Grace | Method and apparatus for compressing images |
| US6014694A (en) * | 1997-06-26 | 2000-01-11 | Citrix Systems, Inc. | System for adaptive video/audio transport over a network |
| US6025880A (en) * | 1997-05-01 | 2000-02-15 | Fujitsu Limited | Moving picture encoding system and method |
| US6091767A (en) * | 1997-02-03 | 2000-07-18 | Westerman; Larry Alan | System for improving efficiency of video encoders |
| US6151074A (en) * | 1997-09-30 | 2000-11-21 | Texas Instruments Incorporated | Integrated MPEG decoder and image resizer for SLM-based digital display system |
| US6204887B1 (en) * | 1998-12-11 | 2001-03-20 | Hitachi America, Ltd. | Methods and apparatus for decoding and displaying multiple images using a common processor |
| US6208689B1 (en) * | 1996-03-04 | 2001-03-27 | Mitsubishi Denki Kabushiki Kaisha | Method and apparatus for digital image decoding |
| US6310909B1 (en) * | 1998-12-23 | 2001-10-30 | Broadcom Corporation | DSL rate adaptation |
| US20020006231A1 (en) * | 2000-07-11 | 2002-01-17 | Mediaflow, Llc | Adaptive edge detection and enhancement for image processing |
| US20020071031A1 (en) * | 2000-12-07 | 2002-06-13 | Philips Electronics North America Corporation | Remote monitoring via a consumer electronic appliance |
| US6442331B1 (en) * | 1998-07-08 | 2002-08-27 | Lsi Logic Corporation | Optical disk system incorporating computer graphics rendering capability to create and display three-dimensional (3-D) objects synchronized with 3-D sound |
| US6456305B1 (en) * | 1999-03-18 | 2002-09-24 | Microsoft Corporation | Method and system for automatically fitting a graphical display of objects to the dimensions of a display window |
| US6469753B1 (en) * | 1996-05-03 | 2002-10-22 | Starsight Telecast, Inc. | Information system |
| US6483983B1 (en) * | 1998-01-07 | 2002-11-19 | Hitachi, Ltd. | Information reproducing method, information reproducing apparatus and information recording/reproducing apparatus |
| US6489997B1 (en) * | 1998-04-29 | 2002-12-03 | John J. Stapleton | Versatile video transformation device |
| US6563547B1 (en) * | 1999-09-07 | 2003-05-13 | Spotware Technologies, Inc. | System and method for displaying a television picture within another displayed image |
| US6650705B1 (en) * | 2000-05-26 | 2003-11-18 | Mitsubishi Electric Research Laboratories Inc. | Method for encoding and transcoding multiple video objects with variable temporal resolution |
| US6681043B1 (en) * | 1999-08-16 | 2004-01-20 | University Of Washington | Interactive video object processing environment which visually distinguishes segmented video object |
| US6859802B1 (en) * | 1999-09-13 | 2005-02-22 | Microsoft Corporation | Image retrieval based on relevance feedback |
| US6864921B2 (en) * | 2000-10-17 | 2005-03-08 | Sony Corporation | Display control system for controlling a display screen formed of multiple display units |
| US6876703B2 (en) * | 2000-05-11 | 2005-04-05 | Ub Video Inc. | Method and apparatus for video coding |
Family Cites Families (30)
| Publication number | Priority date | Publication date | Assignee | Title |
|---|---|---|---|---|
| US4742556A (en) * | 1985-09-16 | 1988-05-03 | Davis Jr Ray E | Character recognition method |
| JP2589298B2 (en) * | 1987-01-28 | 1997-03-12 | キヤノン株式会社 | Decoding device for encoded image data |
| US5237316A (en) * | 1990-02-02 | 1993-08-17 | Washington University | Video display with high speed reconstruction and display of compressed images at increased pixel intensity range and retrofit kit for same |
| JPH05328160A (en) * | 1992-05-27 | 1993-12-10 | Victor Co Of Japan Ltd | Automatic changeover device for video display size |
| US5418574A (en) * | 1992-10-12 | 1995-05-23 | Matsushita Electric Industrial Co., Ltd. | Video signal correction apparatus which detects leading and trailing edges to define boundaries between colors and corrects for bleeding |
| JP3711571B2 (en) * | 1994-09-29 | 2005-11-02 | ソニー株式会社 | Image coding apparatus and image coding method |
| EP0721286A3 (en) * | 1995-01-09 | 2000-07-26 | Matsushita Electric Industrial Co., Ltd. | Video signal decoding apparatus with artifact reduction |
| JP3661711B2 (en) * | 1995-04-27 | 2005-06-22 | ソニー株式会社 | Image coding method and apparatus |
| JPH0974566A (en) * | 1995-09-04 | 1997-03-18 | Sony Corp | Compression encoder and recording device for compression encoded data |
| GB2306831B (en) * | 1995-10-30 | 2000-05-24 | Sony Uk Ltd | Video data compression |
| US5909249A (en) * | 1995-12-15 | 1999-06-01 | General Instrument Corporation | Reduction of noise visibility in a digital video system |
| US5850294A (en) * | 1995-12-18 | 1998-12-15 | Lucent Technologies Inc. | Method and apparatus for post-processing images |
| US5872598A (en) * | 1995-12-26 | 1999-02-16 | C-Cube Microsystems | Scene change detection using quantization scale factor rate control |
| US6057893A (en) * | 1995-12-28 | 2000-05-02 | Sony Corporation | Picture encoding method, picture encoding apparatus, picture transmitting method and picture recording medium |
| EP1182888A3 (en) * | 1996-04-25 | 2004-11-03 | Matsushita Electric Industrial Co., Ltd. | Video coding with bit rate dependent quantisation |
| US5883971A (en) * | 1996-10-23 | 1999-03-16 | International Business Machines Corporation | System and method for determining if a fingerprint image contains an image portion representing a smudged fingerprint impression |
| US5953506A (en) * | 1996-12-17 | 1999-09-14 | Adaptive Media Technologies | Method and apparatus that provides a scalable media delivery system |
| JPH10210315A (en) * | 1997-01-23 | 1998-08-07 | Fuji Xerox Co Ltd | Image-processing unit |
| US5903673A (en) * | 1997-03-14 | 1999-05-11 | Microsoft Corporation | Digital video signal encoder and encoding method |
| US6246783B1 (en) * | 1997-09-17 | 2001-06-12 | General Electric Company | Iterative filter framework for medical images |
| US6229578B1 (en) * | 1997-12-08 | 2001-05-08 | Intel Corporation | Edge-detection based noise removal algorithm |
| AUPP128498A0 (en) * | 1998-01-12 | 1998-02-05 | Canon Kabushiki Kaisha | A method for smoothing jagged edges in digital images |
| US6278735B1 (en) * | 1998-03-19 | 2001-08-21 | International Business Machines Corporation | Real-time single pass variable bit rate control strategy and encoder |
| US6434196B1 (en) * | 1998-04-03 | 2002-08-13 | Sarnoff Corporation | Method and apparatus for encoding video information |
| EP1005233A1 (en) * | 1998-10-12 | 2000-05-31 | STMicroelectronics S.r.l. | Constant bit-rate coding control in a video coder by way of pre-analysis of the slices of the pictures |
| US6259822B1 (en) * | 1998-10-30 | 2001-07-10 | Eastman Kodak Company | Edge enhancement which reduces the visibility of false contours |
| JP2001189936A (en) * | 1999-12-28 | 2001-07-10 | Canon Inc | Image display device, image display method and computer- readable recording medium |
| US6473092B1 (en) * | 2000-04-07 | 2002-10-29 | Agilent Technologies, Inc. | Apparatus and method for color illumination in display devices |
| US6731685B1 (en) * | 2000-09-20 | 2004-05-04 | General Instrument Corporation | Method and apparatus for determining a bit rate need parameter in a statistical multiplexer |
| US6694060B2 (en) * | 2000-12-21 | 2004-02-17 | General Instrument Corporation | Frame bit-size allocation for seamlessly spliced, variable-encoding-rate, compressed digital video signals |
-
2001
- 2001-07-11 US US09/902,995 patent/US20020028024A1/en not_active Abandoned
- 2001-07-11 AU AU2001273326A patent/AU2001273326A1/en not_active Abandoned
- 2001-07-11 WO PCT/US2001/021848 patent/WO2002005562A2/en active Application Filing
- 2001-07-11 WO PCT/US2001/021756 patent/WO2002005121A2/en active Application Filing
- 2001-07-11 US US09/903,028 patent/US7155067B2/en not_active Expired - Lifetime
- 2001-07-11 AU AU2001276871A patent/AU2001276871A1/en not_active Abandoned
- 2001-07-11 AU AU2001276876A patent/AU2001276876A1/en not_active Abandoned
- 2001-07-11 WO PCT/US2001/021873 patent/WO2002005214A2/en active Application Filing
- 2001-07-11 US US09/902,976 patent/US20020021756A1/en not_active Abandoned
Patent Citations (30)
| Publication number | Priority date | Publication date | Assignee | Title |
|---|---|---|---|---|
| US5072297A (en) * | 1990-03-27 | 1991-12-10 | Nippon Hoso Kyokai | Method and system for transmitting and receiving PCM audio signals in combination with a video signal |
| US5469212A (en) * | 1992-04-11 | 1995-11-21 | Goldstar Co., Ltd. | Apparatus for compression-encoding and decoding video signals |
| US5621429A (en) * | 1993-03-16 | 1997-04-15 | Hitachi, Ltd. | Video data display controlling method and video data display processing system |
| US5649052A (en) * | 1994-01-18 | 1997-07-15 | Daewoo Electronics Co Ltd. | Adaptive digital audio encoding system |
| US5699119A (en) * | 1994-03-31 | 1997-12-16 | Samsung Electronics Co., Ltd. | Quantization method and circuit therefor |
| US5892847A (en) * | 1994-07-14 | 1999-04-06 | Johnson-Grace | Method and apparatus for compressing images |
| US5566001A (en) * | 1994-07-27 | 1996-10-15 | Motorola, Inc. | Method and apparatus for fax messaging in a selective call receiver system using multiple code-book data compression |
| US5805224A (en) * | 1995-02-15 | 1998-09-08 | U.S. Philips Corporation | Method and device for transcoding video signals |
| US6208689B1 (en) * | 1996-03-04 | 2001-03-27 | Mitsubishi Denki Kabushiki Kaisha | Method and apparatus for digital image decoding |
| US5805222A (en) * | 1996-03-29 | 1998-09-08 | Fujitsu Limited | Video coding apparatus |
| US6469753B1 (en) * | 1996-05-03 | 2002-10-22 | Starsight Telecast, Inc. | Information system |
| US6091767A (en) * | 1997-02-03 | 2000-07-18 | Westerman; Larry Alan | System for improving efficiency of video encoders |
| US6025880A (en) * | 1997-05-01 | 2000-02-15 | Fujitsu Limited | Moving picture encoding system and method |
| US6014694A (en) * | 1997-06-26 | 2000-01-11 | Citrix Systems, Inc. | System for adaptive video/audio transport over a network |
| US6151074A (en) * | 1997-09-30 | 2000-11-21 | Texas Instruments Incorporated | Integrated MPEG decoder and image resizer for SLM-based digital display system |
| US6483983B1 (en) * | 1998-01-07 | 2002-11-19 | Hitachi, Ltd. | Information reproducing method, information reproducing apparatus and information recording/reproducing apparatus |
| US6489997B1 (en) * | 1998-04-29 | 2002-12-03 | John J. Stapleton | Versatile video transformation device |
| US6442331B1 (en) * | 1998-07-08 | 2002-08-27 | Lsi Logic Corporation | Optical disk system incorporating computer graphics rendering capability to create and display three-dimensional (3-D) objects synchronized with 3-D sound |
| US6204887B1 (en) * | 1998-12-11 | 2001-03-20 | Hitachi America, Ltd. | Methods and apparatus for decoding and displaying multiple images using a common processor |
| US6310909B1 (en) * | 1998-12-23 | 2001-10-30 | Broadcom Corporation | DSL rate adaptation |
| US6456305B1 (en) * | 1999-03-18 | 2002-09-24 | Microsoft Corporation | Method and system for automatically fitting a graphical display of objects to the dimensions of a display window |
| US6681043B1 (en) * | 1999-08-16 | 2004-01-20 | University Of Washington | Interactive video object processing environment which visually distinguishes segmented video object |
| US6563547B1 (en) * | 1999-09-07 | 2003-05-13 | Spotware Technologies, Inc. | System and method for displaying a television picture within another displayed image |
| US6859802B1 (en) * | 1999-09-13 | 2005-02-22 | Microsoft Corporation | Image retrieval based on relevance feedback |
| US6876703B2 (en) * | 2000-05-11 | 2005-04-05 | Ub Video Inc. | Method and apparatus for video coding |
| US6650705B1 (en) * | 2000-05-26 | 2003-11-18 | Mitsubishi Electric Research Laboratories Inc. | Method for encoding and transcoding multiple video objects with variable temporal resolution |
| US20020021756A1 (en) * | 2000-07-11 | 2002-02-21 | Mediaflow, Llc. | Video compression using adaptive selection of groups of frames, adaptive bit allocation, and adaptive replenishment |
| US20020006231A1 (en) * | 2000-07-11 | 2002-01-17 | Mediaflow, Llc | Adaptive edge detection and enhancement for image processing |
| US6864921B2 (en) * | 2000-10-17 | 2005-03-08 | Sony Corporation | Display control system for controlling a display screen formed of multiple display units |
| US20020071031A1 (en) * | 2000-12-07 | 2002-06-13 | Philips Electronics North America Corporation | Remote monitoring via a consumer electronic appliance |
Cited By (28)
| Publication number | Priority date | Publication date | Assignee | Title |
|---|---|---|---|---|
| US7647618B1 (en) | 1999-08-27 | 2010-01-12 | Charles Eric Hunter | Video distribution system |
| US9659285B2 (en) | 1999-08-27 | 2017-05-23 | Zarbaña Digital Fund Llc | Music distribution systems |
| US8719878B2 (en) * | 1999-08-27 | 2014-05-06 | Ochoa Optics Llc | Video distribution system |
| US8656423B2 (en) | 1999-08-27 | 2014-02-18 | Ochoa Optics Llc | Video distribution system |
| US8090619B1 (en) | 1999-08-27 | 2012-01-03 | Ochoa Optics Llc | Method and system for music distribution |
| US20050182730A1 (en) * | 1999-08-27 | 2005-08-18 | Ochoa Optics, Llc | Music distribution system and associated antipiracy protection |
| US8019688B2 (en) | 1999-08-27 | 2011-09-13 | Ochoa Optics Llc | Music distribution system and associated antipiracy protections |
| US20060195548A1 (en) * | 1999-08-27 | 2006-08-31 | Ochoa Optics Llc | Video distribution system |
| US20060212892A1 (en) * | 1999-08-27 | 2006-09-21 | Ochoa Optics Llc | Video distribution system |
| US20060229904A1 (en) * | 1999-08-27 | 2006-10-12 | Ochoa Optics Llc | Music distribution systems |
| US20070186272A1 (en) * | 1999-08-27 | 2007-08-09 | Ochoa Optics | Video Distribution System |
| US9252898B2 (en) | 2000-01-28 | 2016-02-02 | Zarbaña Digital Fund Llc | Music distribution systems |
| USRE41137E1 (en) | 2000-02-10 | 2010-02-16 | Charles Eric Hunter | Music distribution systems |
| US20020112243A1 (en) * | 2001-02-12 | 2002-08-15 | World Theatre | Video distribution system |
| US20020124251A1 (en) * | 2001-02-12 | 2002-09-05 | Hunter Charles E. | Systems and methods for distribution of entertainment and advertising content |
| US8112311B2 (en) | 2001-02-12 | 2012-02-07 | Ochoa Optics Llc | Systems and methods for distribution of entertainment and advertising content |
| US20020143975A1 (en) * | 2001-04-02 | 2002-10-03 | Junichi Kimura | Media distribution systems and multi-media conversion server |
| US7960005B2 (en) | 2001-09-14 | 2011-06-14 | Ochoa Optics Llc | Broadcast distribution of content for storage on hardware protected optical storage media |
| US20030149989A1 (en) * | 2001-09-14 | 2003-08-07 | Hunter Charles Eric | Broadcast distribution of content for storage on hardware protected optical storage media |
| US20050034173A1 (en) * | 2003-08-08 | 2005-02-10 | Kabushiki Kaisha Toshiba | Digital broadcasting receiver and digital broadcasting receiving method |
| US8904466B2 (en) | 2003-08-11 | 2014-12-02 | Warner Bros. Entertainment, Inc. | Digital media distribution device |
| US8621542B2 (en) * | 2003-08-11 | 2013-12-31 | Warner Bros. Entertainment Inc. | Digital media distribution device |
| US20150089562A1 (en) * | 2003-08-11 | 2015-03-26 | c/o Warner Bros. Entertainment, Inc. | Digital media distribution device |
| US20050163223A1 (en) * | 2003-08-11 | 2005-07-28 | Warner Bros. Entertainment Inc. | Digital media distribution device |
| US9686572B2 (en) * | 2003-08-11 | 2017-06-20 | Warner Bros. Entertainment Inc. | Digital media distribution device |
| US9866876B2 (en) | 2003-08-11 | 2018-01-09 | Warner Bros. Entertainment Inc. | Digital media distribution device |
| US20050223335A1 (en) * | 2004-03-31 | 2005-10-06 | Tetsuya Ichikawa | Button processing method and data processing apparatus |
| US7612792B1 (en) * | 2005-09-07 | 2009-11-03 | Avaya Inc | Method and apparatus for adaptive video encoding based on user perception and use |
Also Published As
| Publication number | Publication date |
|---|---|
| WO2002005214A2 (en) | 2002-01-17 |
| AU2001273326A1 (en) | 2002-01-21 |
| WO2002005121A2 (en) | 2002-01-17 |
| AU2001276876A1 (en) | 2002-01-21 |
| US20020006231A1 (en) | 2002-01-17 |
| WO2002005562A2 (en) | 2002-01-17 |
| WO2002005562A3 (en) | 2003-03-20 |
| AU2001276871A1 (en) | 2002-01-21 |
| WO2002005214A3 (en) | 2003-09-25 |
| WO2002005121A3 (en) | 2003-03-27 |
| US20020021756A1 (en) | 2002-02-21 |
| US7155067B2 (en) | 2006-12-26 |
Similar Documents
| Publication | Publication Date | Title |
|---|---|---|
| US20020028024A1 (en) | System and method for calculating an optimum display size for a visual object | |
| US8948253B2 (en) | Networked image/video processing system | |
| US9781431B2 (en) | Image coding and decoding method and apparatus considering human visual characteristics | |
| US9197904B2 (en) | Networked image/video processing system for enhancing photos and videos | |
| US7620261B2 (en) | Edge adaptive filtering system for reducing artifacts and method | |
| US9137548B2 (en) | Networked image/video processing system and network site therefor | |
| US20170140513A1 (en) | Efficient Image Processing on Content-Adaptive PQ Signal Domain | |
| US20130114687A1 (en) | Fixed intra run-level mode for cavlc in hevc | |
| US20180115774A1 (en) | Real-time content-adaptive perceptual quantizer for high dynamic range images | |
| JP2008507161A (en) | Noise filter for video processing | |
| JP4592562B2 (en) | Image decoding device | |
| KR20060127159A (en) | System and method for global indication of mpeg impairments in compressed digital video | |
| US20030031377A1 (en) | Apparatus and method for removing block artifacts, and displaying device having the same apparatus | |
| KR101703330B1 (en) | Method and apparatus for re-encoding an image | |
| KR20050035040A (en) | Decoding method of digital image data | |
| KR20010111353A (en) | Apparatus and method with lower data-rate and less degradation of image quality | |
| WO2021056575A1 (en) | Low-delay joint source-channel coding method, and related device | |
| JPH0468770A (en) | Picture coding system | |
| EP0674439B1 (en) | Image coding and decoding method having flexible format for low bit-rate transmission systems | |
| JPH06233266A (en) | Video signal encoder and video signal decoder | |
| JP2001204025A (en) | High efficiency coder | |
| US20220295074A1 (en) | System and method to estimate blockiness in transform-based video encoding | |
| KR20110041962A (en) | Method and apparatus for video quality assessment | |
| JPH0795581A (en) | Reception/reproduction device for digital picture signal | |
| JP2005534222A (en) | Method and encoder for encoding a digital video signal |
Legal Events
| Date | Code | Title | Description |
|---|---|---|---|
| AS | Assignment |
Owner name: MEDIAFLOW, LLC, GEORGIA Free format text: ASSIGNMENT OF ASSIGNORS INTEREST;ASSIGNORS:JAYANT, NUGGEHALLY S.;JANG, SEONG H.;YOON, JANGHYUN;REEL/FRAME:011985/0798 Effective date: 20010711 |
|
| AS | Assignment |
Owner name: EG TECHNOLOGY, INC., GEORGIA Free format text: ASSIGNMENT OF ASSIGNORS INTEREST;ASSIGNOR:MEDIAFLOW, LLC;REEL/FRAME:012685/0736 Effective date: 20011207 |
|
| AS | Assignment |
Owner name: SILICON VALLEY BANK DBA SILICON VALLEY EAST, CALIF Free format text: SECURITY INTEREST;ASSIGNOR:EG TECHNOLOGY, INC.;REEL/FRAME:014925/0329 Effective date: 20040610 |
|
| AS | Assignment |
Owner name: SILICON VALLEY BANK,CALIFORNIA Free format text: SECURITY AGREEMENT;ASSIGNOR:EG TECHNOLOGY, INC.;REEL/FRAME:019000/0893 Effective date: 20070226 Owner name: SILICON VALLEY BANK, CALIFORNIA Free format text: SECURITY AGREEMENT;ASSIGNOR:EG TECHNOLOGY, INC.;REEL/FRAME:019000/0893 Effective date: 20070226 |
|
| STCB | Information on status: application discontinuation |
Free format text: ABANDONED -- FAILURE TO RESPOND TO AN OFFICE ACTION |
|
| AS | Assignment |
Owner name: EG TECHNOLOGY, INC.,GEORGIA Free format text: RELEASE;ASSIGNOR:SILICON VALLEY BANK;REEL/FRAME:023973/0512 Effective date: 20100209 Owner name: EG TECHNOLOGY, INC., GEORGIA Free format text: RELEASE;ASSIGNOR:SILICON VALLEY BANK;REEL/FRAME:023973/0512 Effective date: 20100209 |
|
| AS | Assignment |
Owner name: EG TECHNOLOGY, INC.,GEORGIA Free format text: RELEASE;ASSIGNOR:SILICON VALLEY BANK;REEL/FRAME:023998/0768 Effective date: 20100209 Owner name: EG TECHNOLOGY, INC., GEORGIA Free format text: RELEASE;ASSIGNOR:SILICON VALLEY BANK;REEL/FRAME:023998/0768 Effective date: 20100209 |
|
| AS | Assignment |
Owner name: ARRIS GROUP, INC., GEORGIA Free format text: ASSIGNMENT OF ASSIGNORS INTEREST;ASSIGNOR:EG TECHNOLOGY, INC.;REEL/FRAME:024864/0491 Effective date: 20090831 |