EP2543308A1 - Fluorescence observation device - Google Patents
Fluorescence observation device Download PDFInfo
- Publication number
- EP2543308A1 EP2543308A1 EP11750467A EP11750467A EP2543308A1 EP 2543308 A1 EP2543308 A1 EP 2543308A1 EP 11750467 A EP11750467 A EP 11750467A EP 11750467 A EP11750467 A EP 11750467A EP 2543308 A1 EP2543308 A1 EP 2543308A1
- Authority
- EP
- European Patent Office
- Prior art keywords
- image
- fluorescence
- section
- peak
- light
- Prior art date
- Legal status (The legal status is an assumption and is not a legal conclusion. Google has not performed a legal analysis and makes no representation as to the accuracy of the status listed.)
- Granted
Links
Images


Classifications
-
- H—ELECTRICITY
- H02—GENERATION; CONVERSION OR DISTRIBUTION OF ELECTRIC POWER
- H02J—CIRCUIT ARRANGEMENTS OR SYSTEMS FOR SUPPLYING OR DISTRIBUTING ELECTRIC POWER; SYSTEMS FOR STORING ELECTRIC ENERGY
- H02J7/00—Circuit arrangements for charging or depolarising batteries or for supplying loads from batteries
-
- A—HUMAN NECESSITIES
- A61—MEDICAL OR VETERINARY SCIENCE; HYGIENE
- A61B—DIAGNOSIS; SURGERY; IDENTIFICATION
- A61B1/00—Instruments for performing medical examinations of the interior of cavities or tubes of the body by visual or photographical inspection, e.g. endoscopes; Illuminating arrangements therefor
- A61B1/04—Instruments for performing medical examinations of the interior of cavities or tubes of the body by visual or photographical inspection, e.g. endoscopes; Illuminating arrangements therefor combined with photographic or television appliances
- A61B1/043—Instruments for performing medical examinations of the interior of cavities or tubes of the body by visual or photographical inspection, e.g. endoscopes; Illuminating arrangements therefor combined with photographic or television appliances for fluorescence imaging
-
- A—HUMAN NECESSITIES
- A61—MEDICAL OR VETERINARY SCIENCE; HYGIENE
- A61B—DIAGNOSIS; SURGERY; IDENTIFICATION
- A61B1/00—Instruments for performing medical examinations of the interior of cavities or tubes of the body by visual or photographical inspection, e.g. endoscopes; Illuminating arrangements therefor
- A61B1/00163—Optical arrangements
- A61B1/00186—Optical arrangements with imaging filters
-
- A—HUMAN NECESSITIES
- A61—MEDICAL OR VETERINARY SCIENCE; HYGIENE
- A61B—DIAGNOSIS; SURGERY; IDENTIFICATION
- A61B1/00—Instruments for performing medical examinations of the interior of cavities or tubes of the body by visual or photographical inspection, e.g. endoscopes; Illuminating arrangements therefor
- A61B1/06—Instruments for performing medical examinations of the interior of cavities or tubes of the body by visual or photographical inspection, e.g. endoscopes; Illuminating arrangements therefor with illuminating arrangements
- A61B1/0646—Instruments for performing medical examinations of the interior of cavities or tubes of the body by visual or photographical inspection, e.g. endoscopes; Illuminating arrangements therefor with illuminating arrangements with illumination filters
-
- A—HUMAN NECESSITIES
- A61—MEDICAL OR VETERINARY SCIENCE; HYGIENE
- A61B—DIAGNOSIS; SURGERY; IDENTIFICATION
- A61B5/00—Measuring for diagnostic purposes; Identification of persons
- A61B5/0059—Measuring for diagnostic purposes; Identification of persons using light, e.g. diagnosis by transillumination, diascopy, fluorescence
- A61B5/0071—Measuring for diagnostic purposes; Identification of persons using light, e.g. diagnosis by transillumination, diascopy, fluorescence by measuring fluorescence emission
-
- A—HUMAN NECESSITIES
- A61—MEDICAL OR VETERINARY SCIENCE; HYGIENE
- A61B—DIAGNOSIS; SURGERY; IDENTIFICATION
- A61B5/00—Measuring for diagnostic purposes; Identification of persons
- A61B5/0059—Measuring for diagnostic purposes; Identification of persons using light, e.g. diagnosis by transillumination, diascopy, fluorescence
- A61B5/0082—Measuring for diagnostic purposes; Identification of persons using light, e.g. diagnosis by transillumination, diascopy, fluorescence adapted for particular medical purposes
- A61B5/0084—Measuring for diagnostic purposes; Identification of persons using light, e.g. diagnosis by transillumination, diascopy, fluorescence adapted for particular medical purposes for introduction into the body, e.g. by catheters
Definitions
- the present invention relates to fluoroscopy systems.
- the fluoroscopy system disclosed in PTL 1 requires the user to visually inspect the affected area in the fluorescence image, which causes a problem in that he or she often misses the affected area if it is difficult to discriminate the affected area from the surrounding area, particularly due to minor differences in their fluorescence intensity, and also in that it is difficult to determine a position suitable for biopsy.
- the present invention employs a fluoroscopy system including an illumination light source that emits white light and excitation light for irradiation of a subject; a white-light-image generating section that generates a white-light image by capturing the reflected light reflected on the subject irradiated with the white light emitted from the illumination light source; a fluorescence-image generating section that generates a fluorescence image by capturing fluorescence emitted from the subject irradiated with the excitation light emitted from the illumination light source; an intensity-distribution generating section that generates a fluorescence intensity distribution of pixels of the fluorescence image generated by the fluorescence-image generating section; a peak-detecting section that detects a fluorescence-intensity peak in the fluorescence intensity distribution generated by the intensity-distribution generating section; a peak-count calculating section that calculates a count of the peak detected by the peak-detecting section
- the subject is irradiated with the white light and excitation light emitted from the illumination light source
- the white-light-image generating section generates a white-light image from the reflected light of the white light
- the fluorescence-image generating section generates a fluorescence image from the fluorescence emitted from the subject irradiated with the excitation light.
- the intensity-distribution generating section generates a fluorescence intensity distribution of pixels of the fluorescence image
- the peak-detecting section detects a fluorescence-intensity peak in the fluorescence intensity distribution.
- the peak-count calculating section calculates a count of the peak detected by the peak-detecting section.
- the image-combining section generates a combined image by superimposing a display representing a region including a pixel having the fluorescence intensity at the peak on the white-light image or the fluorescence image based on the calculated peak count, and the image-displaying section displays the combined image.
- the fluorescence intensity distribution has only one peak in the lower grayscale range, there is only a normal area. Regions including pixels having the fluorescence intensities at the second and subsequent peaks are likely to be affected areas. Thus, if only one peak appears, it is determined that there is no affected area, and if there are two or more peaks, it is determined that the region having the lowest grayscale level is a normal area, and that the second and subsequent peaks are affected areas. Superimposing a region determined to be an affected area on the white-light image or the fluorescence image allows the operator to easily locate the affected area for proper inspection and treatment of the affected area.
- the fluoroscopy system may further include a position-designating section via which a desired position is designated in the combined image displayed by the image-displaying section, and the image-combining section may generate the combined image by superimposing a display locating the position designated via the position-designating section on the white-light image.
- the desired position in the combined image can be designated via the position-designating section to display its positional information on the white-light image.
- treatment such as biopsy (diagnosis using biological tissue), on the designated position while viewing the white-light image on which the display locating the designated position is superimposed, thereby improving the accuracy of inspection and treatment of the affected area.
- the image-combining section may generate the combined image by superimposing a display locating the pixel having the fluorescence intensity at the peak on the white-light image.
- the positional information for the pixel having the fluorescence intensity at the peak in the fluorescence intensity distribution can be displayed in the white-light image. This allows treatment, such as biopsy, on the region including the pixel having the fluorescence intensity at the peak, namely, an affected area, while viewing the white-light image, thereby improving the accuracy of inspection and treatment of the affected area.
- the image-combining section may generate the combined image by superimposing a display representing the region on the fluorescence image.
- the peak-detecting section detects a plurality of peaks
- a plurality of regions including the pixels having the fluorescence intensities at the peaks in the fluorescence intensity distribution can be displayed in the white-light image. This allows treatment, such as biopsy, on a plurality of affected areas while viewing the white-light image, thereby improving the accuracy of inspection and treatment of the affected areas.
- the image-combining section may generate the combined image representing a plurality of the regions corresponding to a plurality of peaks at different fluorescence intensities in different manners for each region.
- the peak-detecting section detects a plurality of peaks at different fluorescence intensities
- a plurality of regions corresponding to these peaks i.e., a plurality of affected areas
- the image-combining section may represent the plurality of regions corresponding to the plurality of peaks at different fluorescence images in different colors.
- the difference in fluorescence intensity can be represented as a difference in color in the image so that the user can easily recognize the difference in malignancy by color, thereby easily determining where biopsy should be performed.
- the image-combining section may represent the region by using a boundary line surrounding the region.
- regions with different fluorescence intensities can be represented by using boundary lines on the image so that the user can easily recognize the difference in malignancy, thereby easily determining where biopsy should be performed.
- the above invention may further include an area-designating section via which a desired area is designated in the combined image displayed by the image-displaying section, and the image-combining section may generate the combined image by further combining an enlarged image of an area of the white-light image corresponding to the area designated via the area-designating section.
- the present invention provides the advantage of detecting an affected area with improved accuracy and allowing the user to easily determine a position suitable for biopsy.
- the endoscope system 100 includes an endoscope 10 including an elongated insertion part 14.
- the endoscope 10 has a handle 11, and also has an eyepiece 12 at one end thereof.
- the handle 11 also has a light guide cable 13 extending therefrom and connected to a light source device (illumination light source) 17.
- a light source device illumination light source
- the eyepiece 12 has a connection adaptor 15, which is connected to a control unit 20 through an image transmission cable 16 via a connection connector 18.
- image data acquired by the endoscope 10 is transmitted through the image transmission cable 16 to the control unit 20.
- the transmitted image data is subjected to image processing in the control unit 20, is transmitted through a monitor cable 41 to a monitor (image-displaying section) 43, and is displayed on a monitor screen 44.
- the monitor screen 44 is a touch screen functioning as input means for inputting an instruction, such as for selecting a biopsy region, to the control unit 20.
- the user performs input operations on the monitor screen 44 by using a touch pen 45.
- the input information is transmitted through a touch screen cable 42 to the control unit 20, which processes the information.
- the light source device 17 accommodates a xenon lamp (Xe lamp) 21 and a wavelength selection filter 22.
- the Xe lamp 21 emits white light and excitation light.
- the light emitted from the Xe lamp 21 passes through the wavelength selection filter 22, which allows only white light and excitation light in set wavelength ranges to pass therethrough.
- the wavelength selection filter 22 transmits light in the wavelength range of 400 to 750 nm and reflects light in the other wavelength range.
- the endoscope 10 accommodates a light guide cable 13, a white-light color CCD 23, a splitter 24, an illumination optical system 25, an image-acquisition optical system 26, an excitation-light-cut filter 27, and a fluorescence monochrome CCD 28.
- the white light and excitation light emitted from the light source device 17 are guided through the light guide cable 13 in the endoscope 10 to the illumination optical system 25, which is disposed at the distal end of the endoscope 10, thereby irradiating a subject A.
- the white light irradiates the subject A the light reflected from the subject A enters the image-acquisition optical system 26, which is disposed at the distal end of the endoscope 10.
- fluorescence is emitted from the subject A and enters the image-acquisition optical system 26.
- the splitter 24 transmits the light reflected from the subject A and reflects the fluorescence emitted from the subject A. This property allows the splitter 24 to separate the reflected light and the fluorescence entering the image-acquisition optical system 26.
- a splitter that reflects light at wavelengths longer than the wavelength of the excitation light is used because the wavelength of the fluorescence is shifted to wavelengths longer than the wavelength of the excitation light.
- the excitation-light-cut filter 27 is a filter for removing the excitation light (reflected light) from the fluorescence. Specifically, as shown in Fig. 4 , the excitation-light-cut filter 27 transmits light in the wavelength range of 765 to 850 nm.
- the fluorescence passing through the excitation-light-cut filter 27 is completely separated from the excitation light (reflected light), and the separated fluorescence is detected by the fluorescence monochrome CCD 28. Because of the weakness of the separated fluorescence, the fluorescence monochrome CCD 28 used has a higher sensitivity than the white-light color CCD 23.
- the fluorescence image data detected by the fluorescence monochrome CCD 28 is transmitted through the image transmission cable 16 to a fluorescence-image generating section 30 in the control unit 20.
- the light reflected from the subject A and passing through the splitter 24 is detected by the white-light color CCD 23.
- the white-light image data detected by the white-light color CCD 23 is transmitted through the image transmission cable 16 to a white-light-image generating section 29 in the control unit 20.
- the control unit 20 includes the following functions: the white-light-image generating section 29, the fluorescence-image generating section 30, an intensity-distribution generating section 31, a peak-detecting section 32, a peak-count comparing section (peak-count calculating section) 33, a region-extracting section 34, an image-combining section 35, a button-generating section 36, a mode-switching section 37, a selected-biopsy-position memory 38, and a pointer-generating section 39. Additionally, the control unit 20 is connected to the monitor 43 and to an input section (position-designating section) 46 that transmits an input signal to the control unit 20 when the monitor 43 is operated. As shown in Fig. 1 , the input section 46 is the monitor screen 44 (touch screen).
- the white-light-image generating section 29 generates a white-light image from the white-light image data detected by the white-light color CCD 23.
- the fluorescence-image generating section 30 generates a fluorescence image from the fluorescence image data detected by the fluorescence monochrome CCD 28.
- the fluorescence image generated by the fluorescence-image generating section 30 is transmitted to the image-combining section 35, the region-extracting section 34, and the intensity-distribution generating section 31.
- the white-light image generated by the white-light-image generating section 29 is transmitted to the image-combining section 35.
- the intensity-distribution generating section 31 generates a fluorescence intensity distribution of the pixels of the fluorescence image generated by the fluorescence-image generating section 30. Specifically, the intensity-distribution generating section 31 generates a histogram based on the received fluorescence image. This histogram, as shown in Figs. 5B and 6B , shows the distribution of the grayscale levels of the pixels and the numbers of pixels at the respective grayscale levels.
- the histogram thus generated is transmitted to the peak-detecting section 32.
- the peak-detecting section 32 detects fluorescence-intensity peaks in the fluorescence intensity distribution generated by the intensity-distribution generating section 31. Specifically, the peak-detecting section 32 executes peak detection on the histogram to detect the peak count and the grayscale levels at the peaks. The grayscale levels thus detected are transmitted to the region-extracting section 34, whereas the peak count is transmitted to the peak-count comparing section 33.
- the peak-count comparing section 33 determines whether the peak count received from the peak-detecting section 32 is 1, or 2 or more. If the subject A under examination is normal, a single large peak appears in the lower grayscale range, as shown in Fig. 5B . Otherwise, if there is an affected area in the examination field of view, a region of high fluorescence intensity is present in the fluorescence image, and a new peak appears in the higher grayscale range in addition to the peak in the lower grayscale range, as shown in Fig. 6B .
- the peak-count comparing section 33 determines that there is no affected area in the field of view and displays the white-light image on the monitor 43, as shown in Fig. 5A . Otherwise, if the peak count is 2 or more, the peak-count comparing section 33 determines that it has detected a signal indicating the presence of an affected area and transmits to the button-generating section 36 an instruction for generating a button for prompting the user to switch to the fluorescence image on the monitor 43. The button generated by the button-generating section 36 is transmitted to the image-combining section 35, which combines the button with the white-light image on the monitor 43, as shown in Fig. 6A .
- the mode-switching section 37 transmits an instruction for switching between the two modes, namely, the white-light image and the fluorescence image, to the image-combining section 35, which switches from the white-light image to the fluorescence image on the monitor 43.
- the region-extracting section 34 receives the grayscale levels at the peaks detected in the histogram, as shown in Fig. 7B , by the peak-detecting section 32. For the peaks detected, the region-extracting section 34 superimposes a display representing a region B including pixels having the fluorescence intensity at the second peak from the lower grayscale side by, for example, superimposition processing, as shown in Fig. 7A .
- the image-combining section 35 combines the image superimposed by the region-extracting section 34, the white-light image generated by the white-light-image generating section 29 or the fluorescence image generated by the fluorescence-image generating section 30, a pointer, described later, generated by the pointer-generating section 39, and the button generated by the button-generating section 36.
- the monitor 43 displays the combined image generated by the image-combining section 35.
- the monitor 43 may also display a message prompting the user to select a biopsy position, as shown in Fig. 7A .
- the input section 46 transmits selected-region-position information through the touch screen cable 42 to the control unit 20, which stores the information in the selected-biopsy-position memory 38.
- the selected-region-position information is transmitted to the pointer-generating section 39, which generates a pointer indicating a recommended optimum biopsy position.
- the information for the pointer is transmitted to the image-combining section 35, which, as shown in Fig. 9 , superimposes a pointer 51 indicating the optimum biopsy position on the white-light image displayed on the monitor 43.
- a white-light image is acquired from light reflected from the subject A (step S1), and a fluorescence image is acquired from fluorescence emitted from the subject A (step S2).
- the white-light image is displayed on the monitor 43, as shown in Fig. 5A , and the user examines the white-light image (step S3).
- the fluorescence image that has been acquired is not displayed on the monitor 43, although the grayscale levels and the numbers of pixels are counted, and the peak count is always detected (step S4).
- step S5 A determination is made as to whether the peak count thus detected is 1, or 2 or more (step S5), and if the peak count is 2 or more, as shown in Fig. 6B , it is determined that there is a possible affected area in the field of view under examination (step S6).
- peaks in the histogram are counted to detect an affected area, and if the peak count is 2 or more, as shown in Fig. 6A , a button for prompting the user to switch to the fluorescence image is displayed on the monitor 43 in addition to the white-light image being displayed (step S7).
- step S8 If this button (display-mode changeover switch) is not touched, control returns to the start of the flowchart, and it is determined again whether there is an affected area in the examination field of view (step S8). Otherwise, if the changeover switch is touched, the display is switched from the white-light image to the fluorescence image, and a superimposed display screen in which the high-fluorescence-intensity region B of the fluorescence image is superimposed on the fluorescence image is displayed on the monitor 43, as shown in Fig. 7A (step S9).
- the high-fluorescence-intensity region B as shown in Fig. 7B , means a region including pixels near the grayscale level at the peak in the histogram.
- the width of grayscale levels near the peak is set in advance, and pixels having grayscale levels within that width are superimposed.
- step S10 If the user determines that biopsy is needed from the superimposed fluorescence image, he or she selects the region where biopsy is to be performed from the superimposed portion on the monitor 43 (touch screen) using the touch pen 45 (step S10).
- a timer monitors whether the region where biopsy is to be performed has been selected within a predetermined period of time, and if the region is not selected within, for example, 15 seconds, it is determined that the user has determined that biopsy is not needed, and control returns to the start.
- the preset time of the timer is variable. Instead of using a timer, it is possible to enable the display to be switched from the superimposed image back to the white-light image by keeping the display-switching button on the monitor 43.
- the display on the monitor 43 is switched from the fluorescence image to the white-light image (step S11).
- the white-light image displayed is a white-light image having the pointer 51, which indicates a point best suited for biopsy in the possible affected area.
- this pointer 51 is always displayed in the foreground so that it is not hidden during the biopsy by, for example, forceps 52 occupying most of the image field of view.
- the user performs the biopsy by referring to the pointer 51 as the target position.
- a biopsy complete button shown in Figs. 9 and 10 is touched to return the flow to the start of the flowchart (step S12). Otherwise, if the biopsy complete button is not touched, the white-light image having the pointer 51 indicating the biopsy point is always displayed.
- the intensity-distribution generating section 31 generates a fluorescence intensity distribution of the pixels of the fluorescence image
- the peak-detecting section 32 detects fluorescence-intensity peaks in the fluorescence intensity distribution. If the peak count is 1, the peak-count detecting section 32 determines that the entire area on the screen is normal, and if the peak count is 2 or more, the peak-count detecting section 32 determines that there is an affected area on the screen and transmits an instruction to the button-generating section 36 to display a button, so that the screen display can be switched from the white-light image to the fluorescence image.
- the image-combining section 35 generates a combined image by superimposing, on the fluorescence image, a display representing the region B including the pixels having the fluorescence intensity at the peak, and the combined image is displayed on the monitor 43.
- the region B including the pixels having the fluorescence intensity at the peak is likely to be an affected area. Displaying the region B on the fluorescence image by superimposition allows the user to easily locate the affected area for proper inspection and treatment of the affected area.
- the position where biopsy is to be performed in the combined image can be designated on the monitor 43 (touch screen) to display its positional information in the form of the pointer 51 on the white-light image.
- This allows treatment, such as biopsy, at the designated position while viewing the white-light image on which the display (pointer 51) identifying the designated position is superimposed, thereby improving the accuracy of inspection and treatment of the affected area.
- this embodiment always displays the white-light image and switches to the fluorescence image in response to an instruction when necessary
- touching the display-mode changeover switch causes the region noted as requiring biopsy to be displayed on the fluorescence image without changing the white-light image.
- the position where biopsy is to be performed is selected on the fluorescence image, the position is indicated by the pointer 51 on the white-light image.
- FIG. 11 is a functional block diagram of the fluoroscopy system 2 according to the second embodiment, which is similar to the fluoroscopy system 1 according to the first embodiment except for the processing performed on the fluorescence image in the control unit 20.
- the second embodiment is identical to the first embodiment in the process up to the generation of the white-light image and the fluorescence image, but is different from the first embodiment in the processing for displaying the high-fluorescence-intensity region and also in the display for selecting the biopsy region on the monitor 43.
- the fluorescence image generated by the fluorescence-image generating section 30 is transmitted to the image-combining section 35, a coloring section 61, and the intensity-distribution generating section 31.
- the white-light image generated by the white-light-image generating section 29 is transmitted to the image-combining section 35.
- the intensity-distribution generating section 31 generates a histogram based on the received fluorescence image.
- This histogram shows the grayscale levels of the pixels and the numbers of pixels at the respective grayscale levels.
- the histogram thus generated is transmitted to the peak-detecting section 32 and a color-setting section 62.
- the peak-detecting section 32 executes peak detection on the histogram to obtain the peak count and the grayscale levels at the peaks.
- the grayscale levels at the peaks thus obtained are transmitted to the color-setting section 62, whereas the peak count is transmitted to the peak-count comparing section 33.
- the color-setting section 62 stores colors assigned to grayscale levels in advance. The number of classes of grayscale levels for assignment and the colors thereof are variable. As shown in Fig. 11 , the color-setting section 62 receives the histogram generated from the fluorescence image from the intensity-distribution generating section 31 and the grayscale levels at the peaks from the peak-detecting section 32.
- the color-setting section 62 determines to what colors the grayscale levels at the peaks detected this time belong, from among the colors assigned to grayscale levels in advance, and sets the colors. That is, different colors are set to different grayscale levels at the peaks so that possible affected areas can be displayed in different colors on the monitor 43. Because the difference in color results from the difference in grayscale level, i.e., from the difference in fluorescence intensity, the affected areas can be displayed so that the difference in malignancy can be easily visualized using color.
- the pixels near the grayscale levels at the peaks are also selected from the histogram.
- the grayscale levels at the histogram peaks, the colors set for the peaks, and the information about the pixels near the peaks are transmitted to the coloring section 61.
- the coloring section 61 Based on the fluorescence image received from the fluorescence-image generating section 30, the coloring section 61 generates a display representing the pixels at and near the grayscale levels at the peaks in the image, using the colors set by the color-setting section 62. The display is transmitted to the image-combining section 35.
- the peak-count comparing section 33 determines whether the received peak count is 1, or 2 or more. If the peak count is 1 or less, it determines that there is no affected area in the field of view and displays the white-light image on the monitor 43. Otherwise, if the peak count is 2 or more, the peak-count comparing section 33 determines that it has detected a signal indicating an affected area and transmits to the button-generating section 36 an instruction for generating a button for prompting the user to switch to the fluorescence image on the monitor 43.
- the button generated by the button-generating section 36 is transmitted to the image-combining section 35, which combines the button with the white-light image on the monitor 43. Touching the button on the monitor 43 causes the input section 46 to transmit an input signal through the touch screen cable 42 to the mode-switching section 37 in the control unit 20.
- the mode-switching section 37 transmits an instruction for switching between the two modes, namely, the white-light image and the fluorescence image, to the image-combining section 35, which switches from the white-light image to the fluorescence image on the monitor 43.
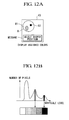
- the monitor 43 may also display a message prompting the user to select a biopsy position, as shown in Fig. 12A .
- the fluorescence image thus displayed is an image combined with the display, generated by the coloring section 61, that represents the regions near the grayscale peaks in different colors depending on the grayscale levels of the fluorescence image.
- the input section 46 transmits selected-region-position information through the touch screen cable 42 to the control unit 20, which stores the information in the selected-biopsy-position memory 38.
- the selected-region-position information is transmitted to the pointer-generating section 39, which generates a pointer indicating a recommended optimum biopsy point.
- the information for the pointer is transmitted to the image-combining section 35, which, as shown in Fig. 9 , superimposes a pointer 51 indicating the optimum biopsy position on the white-light image on the monitor 43.
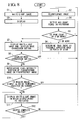
- the fluoroscopy system 2 executes similar processing to the fluoroscopy system 1 of the first embodiment until the display-mode changeover switch is turned on. That is, while the white-light image is displayed and examined, the fluorescence image is not displayed on the monitor 43, although the grayscale levels and the numbers of pixels are counted, and the peak count is always detected (steps S1 to S7).
- step S8 If the button (display-mode changeover switch) is not touched, control returns to the start of the flowchart, and it is determined again whether there is an affected area in the examination field of view (step S8). Otherwise, if the changeover switch is touched, the display is switched from the white-light image to the fluorescence image, and an image combined with the display representing the high-fluorescence-intensity regions B1 and B2 in different colors depending on malignancy (the grayscale levels at the peaks) is displayed, as shown in Fig. 12A (step S21).
- the high-fluorescence-intensity regions mean regions including pixels near the grayscale levels at the peaks in the histogram.
- step S10 If it is determined that biopsy is needed from the fluorescence image represented in different colors, the region where biopsy is to be performed on the monitor 43 is selected from the portions represented in different colors using the touch pen 45 (step S10).
- the subsequent process up to completion of biopsy (steps S11 and S12) is similar to the process in the first embodiment and is therefore not described herein.
- the fluoroscopy system 2 of this embodiment detect a peak level from the histogram of the fluorescence image to detect an affected area with high fluorescence intensity and to display its position on the white-light image, as does the fluoroscopy system 2 of the first embodiment, but it also assigns a color depending on the difference in peak level.
- the fluorescence intensity becomes higher as the malignancy of an affected area becomes higher
- the representation of the difference in peak level by color allows the difference in malignancy to be represented by color.
- the user can easily recognize the difference in malignancy between a plurality of possible affected areas on the examination screen by color, thereby easily determining where biopsy should be performed.
- FIG. 14 is a functional block diagram of the fluoroscopy system 3 according to this embodiment, which is similar to the first embodiment described above except for the processing performed on the fluorescence image in the control unit 20.
- This embodiment generates a white-light image and a fluorescence image, as in the above embodiments, but differs therefrom in the processing performed after generating the fluorescence image.
- the fluorescence image generated by the fluorescence-image generating section 30 is transmitted to the image-combining section 35, a contour-displaying section 71, and the intensity-distribution generating section 31.
- the white-light image generated by the white-light-image generating section 29 is transmitted to the image-combining section 35.
- the intensity-distribution generating section 31 generates a histogram based on the received fluorescence image.
- This histogram shows the grayscale levels of the pixels and the numbers of pixels at the respective grayscale levels.
- the histogram thus generated is transmitted to the peak-detecting section 32 and a range-setting section 72.
- the peak-detecting section 32 executes peak detection on the histogram to obtain the peak count and the grayscale levels at the peaks.
- the peak count thus obtained is transmitted to the peak-count comparing section 33.
- the range-setting section 72 stores ranges, such as a range B0, a range B1, a range B2, etc., assigned to grayscale levels in advance.
- the number of ranges of grayscale levels for assignment is variable.
- the range B0 which is a region having the lowest fluorescence intensity, is assumed to be a normal area, where the fluorescence image is not superimposed on the white-light image.
- the range-setting section 72 receives the histogram generated from the fluorescence image from the intensity-distribution generating section 31. As shown in Fig. 15B , the range-setting section 72 determines to what ranges the individual grayscale levels belong, from among the grayscale ranges set in advance, and transmits the information about the ranges to which the individual grayscale levels are set to the contour-displaying section 71.
- the contour-displaying section 71 determines what pixels in the image are located at the limits of the grayscale ranges set as above and generates a contour display for the portion corresponding to those pixels.
- the contour display thus generated is displayed on the white-light image, as shown in Fig. 15A .
- This processing provides a contour display of fluorescence intensity, which allows the viewer to easily learn how the fluorescence intensity is distributed and where the fluorescence intensity is high in the fluoroscopy image so that he or she can easily determine the region where biopsy is to be performed.
- the regions separated by the contours can be represented in different colors depending on the grayscale levels.
- the peak-count comparing section 33 determines whether the received peak count is 1, or 2 or more. If the peak count is 1 or less, it determines that there is no affected area in the field of view and displays the white-light image on the monitor 43. Otherwise, if the peak count is 2 or more, the peak-count comparing section 33 determines that it has detected a signal indicating an affected area and transmits to the button-generating section 36 an instruction for generating a button for prompting the user to switch to the fluorescence image on the monitor 43.
- the button generated by the button-generating section 36 is transmitted to the image-combining section 35, which combines the button with the white-light image on the monitor 43. Touching the button on the monitor 43 causes the input section 46 to transmit an input signal through the touch screen cable 42 to the mode-switching section 37 in the control unit 20.
- the mode-switching section 37 transmits an instruction for switching between the two modes, namely, the white-light image and the fluorescence image, to the image-combining section 35, which switches from the white-light image to the fluorescence image on the monitor 43.
- the monitor 43 may also display a message prompting the user to select a biopsy position, as shown in Fig. 15A .
- the fluorescence image thus displayed is an image combined with a contour display of the fluorescence intensity distribution.
- the input section 46 transmits selected-region-position information through the touch screen cable 42 to the control unit 20, which stores the information in the selected-biopsy-position memory 38.
- the selected-region-position information is transmitted to the pointer-generating section 39, which generates a pointer indicating the position where biopsy is to be performed, which is transmitted to the image-combining section 35.
- a white-light image on which the pointer 51 indicating the position where biopsy is to be performed is superimposed is displayed on the monitor 43.
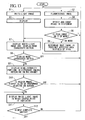
- the fluoroscopy system 3 executes similar processing to the fluoroscopy systems of the above embodiments until the display-mode changeover switch is turned on. That is, while the white-light image is displayed and examined, the fluorescence image is not displayed on the monitor 43, although the grayscale levels and the numbers of pixels are counted, and the peak count is always detected (steps S1 to S7).
- step S8 If the button (display-mode changeover switch) is not touched, control returns to the start, and it is determined again whether there is an affected area in the examination field of view (step S8). Otherwise, if the changeover switch is touched, the display is switched from the white-light image to the fluorescence image, and an image combined with a contour display of the fluorescence intensity distribution is displayed, as shown in Fig. 15A (step S31).
- step S10 If it is determined that biopsy is needed from the fluorescence image combined with the contour display of the fluorescence intensity distribution, the portion where biopsy is to be performed is selected on the monitor 43 using the touch pen 45 (step S10).
- the subsequent process up to completion of biopsy (steps S11 and S12) is similar to the process in the above embodiments and is therefore not described herein.
- the fluoroscopy system 3 of this embodiment detect a peak level from the histogram of the fluorescence image to display its position and to add color for ease of recognition of malignancy, as do the fluoroscopy systems of the above embodiments, but it also provides a straightforward contour display of the fluorescence intensity distribution for a high-intensity region.
- the portion having the highest fluorescence intensity in the high-fluorescence-intensity region is a position best suited for biopsy.
- a straightforward contour display of the fluorescence intensity distribution for the high-intensity region allows the user to easily determine where the fluorescence intensity is highest in the high-fluorescence-intensity region displayed on the examination screen and where is best suited for biopsy.
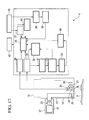
- FIG. 17 is a functional block diagram of the fluoroscopy system 4 of this embodiment, which is similar to the fluoroscopy system 1 according to the first embodiment except for the processing performed on the fluorescence image in the control unit 20.
- This embodiment involves examination of an affected area, as in the above embodiments, but differs therefrom in that the image-combining section 35 has an image-enlarging function.
- the fluorescence image generated by the fluorescence-image generating section 30 is transmitted to the image-combining section 35, the region-extracting section 34, and the intensity-distribution generating section 31.
- the white-light image generated by the white-light-image generating section 29 is transmitted to the image-combining section 35.
- the fluorescence image transmitted to the region-extracting section 34 and the intensity-distribution generating section 31 is processed as in the first embodiment, and the region-extracting section 34 transmits information about a high-fluorescence-intensity region and superimposition information for representing that region to the image-combining section 35.
- the button-generating section 36 transmits information for an image-switching button and an enlarge button to the image-combining section 35.
- the image-combining section 35 Based on the information for the image-switching button received from the button-generating section 36, the image-combining section 35 combines the image-switching button with the white-light image on the monitor 43. Touching the image-switching button on the monitor 43 causes the input section 46 to transmit an input signal through the touch screen cable 42 to the mode-switching section 37 in the control unit 20.
- the mode-switching section 37 transmits an instruction for switching between the two modes, namely, the white-light image and the fluorescence image, to the image-combining section 35, which switches from the white-light image to the fluorescence image on the monitor 43.
- the screen thus displayed is a screen showing a superimposed fluorescence image, as in the first embodiment, with which the enlarge button generated by the button-generating section 36 is combined.
- Touching the enlarge button on the monitor 43 causes the input section 46 to transmit an input signal through the touch screen cable 42 to an enlarged-region memory 81 in the control unit 20.
- an instruction for displaying a high-fluorescence-intensity region (superimposed region) B as a white-light image is transmitted to the image-combining section 35.
- the input section 46 functions as an area-setting section for designating the area to be enlarged by operating the monitor 43.
- the image-combining section 35 obtains a white-light-image region including pixels corresponding to the region B by trimming.
- the white-light image obtained by trimming is subjected to digital zoom processing, which assigns pixel data to a plurality of pixels on the monitor 43.
- the digitally zoomed image is combined and displayed beside the fluorescence image, as shown in Fig. 18 .
- the magnification of the digital zoom processing is variable, and a magnification suitable for examination of an affected area can be selected by touching an enlarge/reduce command button (magnification command button) displayed beside the enlarged image.
- the monitor 43 may also display a message prompting the user to select a biopsy position, as shown in Fig. 18 .
- Selecting the region where biopsy is to be performed on the monitor 43 via the touch screen causes the input section 46 to transmit selected-region-position information through the touch screen cable 42 to the control unit 20, which stores the information in the selected-biopsy-position memory 38.
- the selected-region-position information is transmitted to the pointer-generating section 39, which generates a pointer indicating the position where biopsy is to be performed, which is transmitted to the image-combining section 35.
- a white-light image in which the position where biopsy is to be performed is indicated is displayed on the monitor 43.
- the region where biopsy is to be performed can be set on the touch screen either by selecting the enlarged high-fluorescence-intensity portion or by selecting the region from the entire image before enlargement.
- the fluoroscopy system 3 of this embodiment executes similar processing to the fluoroscopy system 1 of the first embodiment until the display-mode changeover switch is turned on. That is, while the white-light image is displayed and examined, the fluorescence image is not displayed on the monitor 43, although the grayscale levels and the numbers of pixels are counted, and the peak count is always detected (steps S1 to S7).
- step S8 If the button (display-mode changeover switch) is not touched, control returns to the start, and it is determined again whether there is an affected area in the examination field of view (step S8). Otherwise, if the changeover switch is touched, the display is switched from the white-light image to the fluorescence image, and a fluorescence image on which the high-fluorescence-intensity region is superimposed and with which the enlarge button is combined is displayed, as shown in Fig. 18 (step S9).
- Touching the enlarge button causes an enlarged white-light image including the high-fluorescence-intensity region (superimposed region) to be displayed beside the fluorescence image (steps S41 and S42). If the enlarge button is not touched, the region where biopsy is to be performed is selected on the screen, or if the biopsy region is not selected, control returns to the start, as in the first embodiment (step S10).
- the user determines whether biopsy should be performed (step S42).
- the enlarged image provides information about the color, condition, and profile of the subject, thus providing more information for determining whether biopsy should be performed.
- step S10 the region where biopsy is to be performed is selected on the monitor 43 (touch screen) using the touch pen 45 (step S10).
- step S11 and S12 The subsequent process up to completion of biopsy (steps S11 and S12) is similar to the process in the first embodiment and is therefore not described herein.
- the fluoroscopy system 4 of this embodiment help to determine the biopsy position from the fluorescence image information, as do the fluoroscopy systems of the above embodiments, but it also helps to determine whether biopsy should be performed by providing an enlarged white-light image of a high-fluorescence-intensity region. Because a higher fluorescence intensity indicates an affected area with a higher malignancy, it could have a different color and profile from the surrounding environment in the white-light image.
- the white-light examination of the high-fluorescence-intensity region provides the user with more information for determining whether biopsy should be performed.
- the enlarged white-light image of the high-fluorescence-intensity region provides the user with information about the profile and color of the affected area and the surrounding area, which allows him or her to easily determine where biopsy should be performed.
- the specific configuration thereof is not limited to those embodiments, but encompasses, for example, design changes within the spirit of the present invention.
- the fluoroscopy system according to the present invention is applied to an endoscope system in the embodiments described above, it may also be applied to, for example, microscope systems.
- a high-fluorescence-intensity region is superimposed on a fluorescence image by, for example, superimposition processing in the embodiments described above, it may also be superimposed on a white-light image.
Abstract
Description
- The present invention relates to fluoroscopy systems.
- There are known fluoroscopy systems in the related art that locate an affected area by means of fluoroscopy, that allow the user to mark a point that needs biopsy (diagnosis using biological tissue), and that display the position corresponding to the marked point in a white-light image (see, for example, PTL 1)
-
- {PTL 1}
Publication of Japanese Patent No.3771985 - The fluoroscopy system disclosed in
PTL 1, however, requires the user to visually inspect the affected area in the fluorescence image, which causes a problem in that he or she often misses the affected area if it is difficult to discriminate the affected area from the surrounding area, particularly due to minor differences in their fluorescence intensity, and also in that it is difficult to determine a position suitable for biopsy. - In view of the foregoing, it is an object of the present invention to provide a fluoroscopy system that can detect an affected area with improved accuracy and that allows the user to easily determine a position suitable for biopsy.
- To achieve the above object, the present invention employs the following solutions.
The present invention employs a fluoroscopy system including an illumination light source that emits white light and excitation light for irradiation of a subject; a white-light-image generating section that generates a white-light image by capturing the reflected light reflected on the subject irradiated with the white light emitted from the illumination light source; a fluorescence-image generating section that generates a fluorescence image by capturing fluorescence emitted from the subject irradiated with the excitation light emitted from the illumination light source; an intensity-distribution generating section that generates a fluorescence intensity distribution of pixels of the fluorescence image generated by the fluorescence-image generating section; a peak-detecting section that detects a fluorescence-intensity peak in the fluorescence intensity distribution generated by the intensity-distribution generating section; a peak-count calculating section that calculates a count of the peak detected by the peak-detecting section; an image-combining section that generates a combined image by superimposing a display representing a region including a pixel having the fluorescence intensity at the peak detected by the peak-detecting section on the white-light image or the fluorescence image based on the peak count calculated by the peak-count calculating section; and an image-displaying section that displays the combined image generated by the image-combining section. - According to the present invention, the subject is irradiated with the white light and excitation light emitted from the illumination light source, the white-light-image generating section generates a white-light image from the reflected light of the white light, and the fluorescence-image generating section generates a fluorescence image from the fluorescence emitted from the subject irradiated with the excitation light. The intensity-distribution generating section generates a fluorescence intensity distribution of pixels of the fluorescence image, and the peak-detecting section detects a fluorescence-intensity peak in the fluorescence intensity distribution. The peak-count calculating section calculates a count of the peak detected by the peak-detecting section. The image-combining section generates a combined image by superimposing a display representing a region including a pixel having the fluorescence intensity at the peak on the white-light image or the fluorescence image based on the calculated peak count, and the image-displaying section displays the combined image.
- If the fluorescence intensity distribution has only one peak in the lower grayscale range, there is only a normal area. Regions including pixels having the fluorescence intensities at the second and subsequent peaks are likely to be affected areas. Thus, if only one peak appears, it is determined that there is no affected area, and if there are two or more peaks, it is determined that the region having the lowest grayscale level is a normal area, and that the second and subsequent peaks are affected areas. Superimposing a region determined to be an affected area on the white-light image or the fluorescence image allows the operator to easily locate the affected area for proper inspection and treatment of the affected area.
- The fluoroscopy system according to the above invention may further include a position-designating section via which a desired position is designated in the combined image displayed by the image-displaying section, and the image-combining section may generate the combined image by superimposing a display locating the position designated via the position-designating section on the white-light image.
In this manner, the desired position in the combined image can be designated via the position-designating section to display its positional information on the white-light image. This allows treatment, such as biopsy (diagnosis using biological tissue), on the designated position while viewing the white-light image on which the display locating the designated position is superimposed, thereby improving the accuracy of inspection and treatment of the affected area. - In the fluoroscopy system according to the above invention, the image-combining section may generate the combined image by superimposing a display locating the pixel having the fluorescence intensity at the peak on the white-light image.
In this manner, the positional information for the pixel having the fluorescence intensity at the peak in the fluorescence intensity distribution can be displayed in the white-light image. This allows treatment, such as biopsy, on the region including the pixel having the fluorescence intensity at the peak, namely, an affected area, while viewing the white-light image, thereby improving the accuracy of inspection and treatment of the affected area. - In the fluoroscopy system according to the above invention, if the peak-detecting section detects a plurality of peaks, the image-combining section may generate the combined image by superimposing a display representing the region on the fluorescence image.
In this manner, if the peak-detecting section detects a plurality of peaks, a plurality of regions including the pixels having the fluorescence intensities at the peaks in the fluorescence intensity distribution can be displayed in the white-light image. This allows treatment, such as biopsy, on a plurality of affected areas while viewing the white-light image, thereby improving the accuracy of inspection and treatment of the affected areas. - In the fluoroscopy system according to the above invention, the image-combining section may generate the combined image representing a plurality of the regions corresponding to a plurality of peaks at different fluorescence intensities in different manners for each region.
In this manner, if the peak-detecting section detects a plurality of peaks at different fluorescence intensities, a plurality of regions corresponding to these peaks, i.e., a plurality of affected areas, can be displayed in different manners depending on their fluorescence intensities. This allows the malignancy of the plurality of affected areas to be represented in the image so that the user can easily recognize the difference in malignancy between the plurality of affected areas. - In the fluoroscopy system according to the above invention, the image-combining section may represent the plurality of regions corresponding to the plurality of peaks at different fluorescence images in different colors.
In this manner, the difference in fluorescence intensity can be represented as a difference in color in the image so that the user can easily recognize the difference in malignancy by color, thereby easily determining where biopsy should be performed. - In the above invention, the image-combining section may represent the region by using a boundary line surrounding the region.
In this manner, regions with different fluorescence intensities can be represented by using boundary lines on the image so that the user can easily recognize the difference in malignancy, thereby easily determining where biopsy should be performed. - The above invention may further include an area-designating section via which a desired area is designated in the combined image displayed by the image-displaying section, and the image-combining section may generate the combined image by further combining an enlarged image of an area of the white-light image corresponding to the area designated via the area-designating section.
By designating an affected area as the desired area via the area-designating section and further combining an enlarged image of an area of the white-light image corresponding to the affected area, information about the profile and color of the affected area and the surrounding environment can be provided, thereby improving the accuracy of inspection and treatment of the affected area. - The present invention provides the advantage of detecting an affected area with improved accuracy and allowing the user to easily determine a position suitable for biopsy.
-
- {
Fig. 1 }
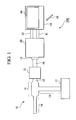
Fig. 1 is an overall schematic diagram of an endoscope system according to an embodiment of the present invention. - {
Fig. 2 }
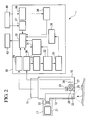
Fig. 2 is a functional block diagram of a fluoroscopy system according to a first embodiment of the present invention. - {
Fig. 3 }
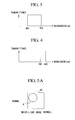
Fig. 3 shows a graph illustrating the transmittance of an excitation-light-pass filter inFig. 2 . - {
Fig. 4 }
Fig. 4 shows a graph illustrating the transmittance of an excitation-light-cut filter inFig. 2 . - {
Fig. 5A }
Fig. 5A is a diagram illustrating an image examined under a fluorescence endoscope inFig. 2 in a normal condition, showing an example of a screen display. - {
Fig. 5B }
Fig. 5B shows a graph illustrating the image examined under the fluorescence endoscope inFig. 2 in a normal condition, showing a histogram. - {
Fig. 6A }
Fig. 6A is a diagram illustrating an image examined under the fluorescence endoscope inFig. 2 upon detection of an abnormality, showing an example of a screen display. - {
Fig. 6B }
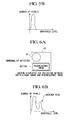
Fig. 6B shows a graph illustrating the image examined under the fluorescence endoscope inFig. 2 upon detection of an abnormality, showing a histogram. - {
Fig. 7A }
Fig. 7A is a diagram illustrating an image on which a superimposition image is superimposed with the fluorescence endoscope inFig. 2 , showing an example of a screen display. - {
Fig. 7B }
Fig. 7B shows a graph illustrating the image on which the superimposition image is superimposed with the fluorescence endoscope inFig. 2 , showing a histogram. - {
Fig. 8 }
Fig. 8 is a flowchart showing a process executed by the fluorescence endoscope inFig. 2 . - {
Fig. 9 }
Fig. 9 is an example of a screen display on which a pointer is superimposed with the fluorescence endoscope inFig. 2 . - {
Fig. 10 }
Fig. 10 is an example of a screen display on which a pointer is superimposed with the fluorescence endoscope inFig. 2 . - {
Fig. 11 }
Fig. 11 is a functional block diagram of a fluoroscopy system according to a second embodiment of the present invention. - {
Fig. 12A }
Fig. 12A is a diagram illustrating an image on which colored regions are superimposed with a fluorescence endoscope inFig. 11 , showing an example of a screen display. - {
Fig. 12B }
Fig. 12B shows a graph illustrating the image on which the colored regions are superimposed with the fluorescence endoscope inFig. 11 , showing a histogram. - {
Fig. 13 }
Fig. 13 is a flowchart showing a process executed by the fluorescence endoscope inFig. 11 . - {
Fig. 14 }
Fig. 14 is a functional block diagram of a fluoroscopy system according to a third embodiment of the present invention. - {
Fig. 15A }
Fig. 15A is a diagram illustrating an image on which contours are superimposed with a fluorescence endoscope inFig. 14 , showing an example of a screen display. - {
Fig. 15B }
Fig. 15B shows a graph illustrating the image on which the contours are superimposed with the fluorescence endoscope inFig. 14 , showing a histogram. - {
Fig. 16 }
Fig. 16 is a flowchart showing a process executed by the fluorescence endoscope inFig. 14 . - {
Fig. 17 }
Fig. 17 is a functional block diagram of a fluoroscopy system according to a fourth embodiment of the present invention. - {
Fig. 18 }
Fig. 18 is an example of a screen display on which an enlarged image is superimposed with a fluorescence endoscope inFig. 17 . - {
Fig. 19 }
Fig. 19 is a flowchart showing a process executed by the fluorescence endoscope inFig. 17 . - A
fluoroscopy system 1 according to a first embodiment of the present invention will hereinafter be described with reference to the drawings. An application of thefluoroscopy system 1 according to this embodiment to anendoscope system 100 is described herein.
As shown inFig. 1 , theendoscope system 100 includes anendoscope 10 including an elongatedinsertion part 14. Theendoscope 10 has ahandle 11, and also has aneyepiece 12 at one end thereof. Thehandle 11 also has alight guide cable 13 extending therefrom and connected to a light source device (illumination light source) 17. Thus, light emitted from thelight source device 17 is guided to the distal end of theinsertion part 14 of theendoscope 10, thereby irradiating a subject. - The
eyepiece 12 has aconnection adaptor 15, which is connected to acontrol unit 20 through animage transmission cable 16 via aconnection connector 18. Thus, image data acquired by theendoscope 10 is transmitted through theimage transmission cable 16 to thecontrol unit 20. The transmitted image data is subjected to image processing in thecontrol unit 20, is transmitted through amonitor cable 41 to a monitor (image-displaying section) 43, and is displayed on amonitor screen 44. - The
monitor screen 44 is a touch screen functioning as input means for inputting an instruction, such as for selecting a biopsy region, to thecontrol unit 20. The user performs input operations on themonitor screen 44 by using atouch pen 45. The input information is transmitted through atouch screen cable 42 to thecontrol unit 20, which processes the information. - Next, the detailed configuration of the
fluoroscopy system 1 of this embodiment and the display on the monitor screen will be described usingFigs. 2 to 10 .
As shown inFig. 2 , thelight source device 17 accommodates a xenon lamp (Xe lamp) 21 and awavelength selection filter 22. TheXe lamp 21 emits white light and excitation light. The light emitted from theXe lamp 21 passes through thewavelength selection filter 22, which allows only white light and excitation light in set wavelength ranges to pass therethrough. Specifically, as shown inFig. 3 , thewavelength selection filter 22 transmits light in the wavelength range of 400 to 750 nm and reflects light in the other wavelength range. - As shown in
Fig. 2 , theendoscope 10 accommodates alight guide cable 13, a white-light color CCD 23, asplitter 24, an illuminationoptical system 25, an image-acquisitionoptical system 26, an excitation-light-cut filter 27, and afluorescence monochrome CCD 28. - The white light and excitation light emitted from the
light source device 17 are guided through thelight guide cable 13 in theendoscope 10 to the illuminationoptical system 25, which is disposed at the distal end of theendoscope 10, thereby irradiating a subject A. As the white light irradiates the subject A, the light reflected from the subject A enters the image-acquisitionoptical system 26, which is disposed at the distal end of theendoscope 10. As the excitation light irradiates the subject A, fluorescence is emitted from the subject A and enters the image-acquisitionoptical system 26. - The
splitter 24 transmits the light reflected from the subject A and reflects the fluorescence emitted from the subject A. This property allows thesplitter 24 to separate the reflected light and the fluorescence entering the image-acquisitionoptical system 26. A splitter that reflects light at wavelengths longer than the wavelength of the excitation light is used because the wavelength of the fluorescence is shifted to wavelengths longer than the wavelength of the excitation light. - The excitation-light-
cut filter 27 is a filter for removing the excitation light (reflected light) from the fluorescence. Specifically, as shown inFig. 4 , the excitation-light-cut filter 27 transmits light in the wavelength range of 765 to 850 nm. - The fluorescence passing through the excitation-light-
cut filter 27 is completely separated from the excitation light (reflected light), and the separated fluorescence is detected by thefluorescence monochrome CCD 28. Because of the weakness of the separated fluorescence, thefluorescence monochrome CCD 28 used has a higher sensitivity than the white-light color CCD 23. The fluorescence image data detected by thefluorescence monochrome CCD 28 is transmitted through theimage transmission cable 16 to a fluorescence-image generating section 30 in thecontrol unit 20. - On the other hand, the light reflected from the subject A and passing through the
splitter 24 is detected by the white-light color CCD 23. The white-light image data detected by the white-light color CCD 23 is transmitted through theimage transmission cable 16 to a white-light-image generating section 29 in thecontrol unit 20. - As shown in
Fig. 2 , thecontrol unit 20 includes the following functions: the white-light-image generating section 29, the fluorescence-image generating section 30, an intensity-distribution generating section 31, a peak-detectingsection 32, a peak-count comparing section (peak-count calculating section) 33, a region-extractingsection 34, an image-combiningsection 35, a button-generatingsection 36, a mode-switchingsection 37, a selected-biopsy-position memory 38, and a pointer-generatingsection 39. Additionally, thecontrol unit 20 is connected to themonitor 43 and to an input section (position-designating section) 46 that transmits an input signal to thecontrol unit 20 when themonitor 43 is operated. As shown inFig. 1 , theinput section 46 is the monitor screen 44 (touch screen). - The white-light-
image generating section 29 generates a white-light image from the white-light image data detected by the white-light color CCD 23.
The fluorescence-image generating section 30 generates a fluorescence image from the fluorescence image data detected by thefluorescence monochrome CCD 28. - The fluorescence image generated by the fluorescence-
image generating section 30 is transmitted to the image-combiningsection 35, the region-extractingsection 34, and the intensity-distribution generating section 31. On the other hand, the white-light image generated by the white-light-image generating section 29 is transmitted to the image-combiningsection 35. - The intensity-
distribution generating section 31 generates a fluorescence intensity distribution of the pixels of the fluorescence image generated by the fluorescence-image generating section 30. Specifically, the intensity-distribution generating section 31 generates a histogram based on the received fluorescence image. This histogram, as shown inFigs. 5B and 6B , shows the distribution of the grayscale levels of the pixels and the numbers of pixels at the respective grayscale levels. - The histogram thus generated is transmitted to the peak-detecting
section 32.
The peak-detectingsection 32 detects fluorescence-intensity peaks in the fluorescence intensity distribution generated by the intensity-distribution generating section 31. Specifically, the peak-detectingsection 32 executes peak detection on the histogram to detect the peak count and the grayscale levels at the peaks. The grayscale levels thus detected are transmitted to the region-extractingsection 34, whereas the peak count is transmitted to the peak-count comparing section 33. - The peak-
count comparing section 33 determines whether the peak count received from the peak-detectingsection 32 is 1, or 2 or more. If the subject A under examination is normal, a single large peak appears in the lower grayscale range, as shown inFig. 5B . Otherwise, if there is an affected area in the examination field of view, a region of high fluorescence intensity is present in the fluorescence image, and a new peak appears in the higher grayscale range in addition to the peak in the lower grayscale range, as shown inFig. 6B . - If the peak count is 1 or less, the peak-
count comparing section 33 determines that there is no affected area in the field of view and displays the white-light image on themonitor 43, as shown inFig. 5A . Otherwise, if the peak count is 2 or more, the peak-count comparing section 33 determines that it has detected a signal indicating the presence of an affected area and transmits to the button-generatingsection 36 an instruction for generating a button for prompting the user to switch to the fluorescence image on themonitor 43. The button generated by the button-generatingsection 36 is transmitted to the image-combiningsection 35, which combines the button with the white-light image on themonitor 43, as shown inFig. 6A . - Touching the button on the
monitor 43 causes theinput section 46 to transmit an input signal through thetouch screen cable 42 to the mode-switchingsection 37 in thecontrol unit 20. The mode-switchingsection 37 transmits an instruction for switching between the two modes, namely, the white-light image and the fluorescence image, to the image-combiningsection 35, which switches from the white-light image to the fluorescence image on themonitor 43. - The region-extracting
section 34 receives the grayscale levels at the peaks detected in the histogram, as shown inFig. 7B , by the peak-detectingsection 32. For the peaks detected, the region-extractingsection 34 superimposes a display representing a region B including pixels having the fluorescence intensity at the second peak from the lower grayscale side by, for example, superimposition processing, as shown inFig. 7A . - The image-combining
section 35 combines the image superimposed by the region-extractingsection 34, the white-light image generated by the white-light-image generating section 29 or the fluorescence image generated by the fluorescence-image generating section 30, a pointer, described later, generated by the pointer-generatingsection 39, and the button generated by the button-generatingsection 36.
Themonitor 43 displays the combined image generated by the image-combiningsection 35. Themonitor 43 may also display a message prompting the user to select a biopsy position, as shown inFig. 7A . - As shown in
Fig. 7A , when the user checks the image displayed on themonitor 43 and selects the region where biopsy is to be performed from the superimposed region B on the touch screen, theinput section 46 transmits selected-region-position information through thetouch screen cable 42 to thecontrol unit 20, which stores the information in the selected-biopsy-position memory 38. The selected-region-position information is transmitted to the pointer-generatingsection 39, which generates a pointer indicating a recommended optimum biopsy position. The information for the pointer is transmitted to the image-combiningsection 35, which, as shown inFig. 9 , superimposes apointer 51 indicating the optimum biopsy position on the white-light image displayed on themonitor 43. - The operation of the fluoroscopy system thus configured will now be described with reference to the flowchart shown in
Fig. 8 .
Upon starting examination of an affected area using thefluoroscopy system 1 of this embodiment, a white-light image is acquired from light reflected from the subject A (step S1), and a fluorescence image is acquired from fluorescence emitted from the subject A (step S2). - The white-light image is displayed on the
monitor 43, as shown inFig. 5A , and the user examines the white-light image (step S3). The fluorescence image that has been acquired is not displayed on themonitor 43, although the grayscale levels and the numbers of pixels are counted, and the peak count is always detected (step S4). - A determination is made as to whether the peak count thus detected is 1, or 2 or more (step S5), and if the peak count is 2 or more, as shown in
Fig. 6B , it is determined that there is a possible affected area in the field of view under examination (step S6). - In this manner, the peaks in the histogram are counted to detect an affected area, and if the peak count is 2 or more, as shown in
Fig. 6A , a button for prompting the user to switch to the fluorescence image is displayed on themonitor 43 in addition to the white-light image being displayed (step S7). - If this button (display-mode changeover switch) is not touched, control returns to the start of the flowchart, and it is determined again whether there is an affected area in the examination field of view (step S8). Otherwise, if the changeover switch is touched, the display is switched from the white-light image to the fluorescence image, and a superimposed display screen in which the high-fluorescence-intensity region B of the fluorescence image is superimposed on the fluorescence image is displayed on the
monitor 43, as shown inFig. 7A (step S9). - The high-fluorescence-intensity region B, as shown in
Fig. 7B , means a region including pixels near the grayscale level at the peak in the histogram. In this embodiment, the width of grayscale levels near the peak is set in advance, and pixels having grayscale levels within that width are superimposed. - If the user determines that biopsy is needed from the superimposed fluorescence image, he or she selects the region where biopsy is to be performed from the superimposed portion on the monitor 43 (touch screen) using the touch pen 45 (step S10).
- A timer monitors whether the region where biopsy is to be performed has been selected within a predetermined period of time, and if the region is not selected within, for example, 15 seconds, it is determined that the user has determined that biopsy is not needed, and control returns to the start. The preset time of the timer is variable. Instead of using a timer, it is possible to enable the display to be switched from the superimposed image back to the white-light image by keeping the display-switching button on the
monitor 43. - If the region where biopsy is to be performed is selected, the display on the
monitor 43 is switched from the fluorescence image to the white-light image (step S11). As shown inFig. 9 , the white-light image displayed is a white-light image having thepointer 51, which indicates a point best suited for biopsy in the possible affected area. - As shown in
Fig. 10 , thispointer 51 is always displayed in the foreground so that it is not hidden during the biopsy by, for example,forceps 52 occupying most of the image field of view. The user performs the biopsy by referring to thepointer 51 as the target position. - When the biopsy is complete, a biopsy complete button shown in
Figs. 9 and 10 is touched to return the flow to the start of the flowchart (step S12). Otherwise, if the biopsy complete button is not touched, the white-light image having thepointer 51 indicating the biopsy point is always displayed. - In the
fluoroscopy system 1 according to this embodiment, as discussed above, the intensity-distribution generating section 31 generates a fluorescence intensity distribution of the pixels of the fluorescence image, and the peak-detectingsection 32 detects fluorescence-intensity peaks in the fluorescence intensity distribution. If the peak count is 1, the peak-count detecting section 32 determines that the entire area on the screen is normal, and if the peak count is 2 or more, the peak-count detecting section 32 determines that there is an affected area on the screen and transmits an instruction to the button-generatingsection 36 to display a button, so that the screen display can be switched from the white-light image to the fluorescence image. The image-combiningsection 35 generates a combined image by superimposing, on the fluorescence image, a display representing the region B including the pixels having the fluorescence intensity at the peak, and the combined image is displayed on themonitor 43. - The region B including the pixels having the fluorescence intensity at the peak is likely to be an affected area. Displaying the region B on the fluorescence image by superimposition allows the user to easily locate the affected area for proper inspection and treatment of the affected area.
- Further, the position where biopsy is to be performed in the combined image can be designated on the monitor 43 (touch screen) to display its positional information in the form of the
pointer 51 on the white-light image. This allows treatment, such as biopsy, at the designated position while viewing the white-light image on which the display (pointer 51) identifying the designated position is superimposed, thereby improving the accuracy of inspection and treatment of the affected area. - Whereas this embodiment always displays the white-light image and switches to the fluorescence image in response to an instruction when necessary, it is also possible to always display the white-light image and the fluorescence image side-by-side on the display screen. In this case, touching the display-mode changeover switch causes the region noted as requiring biopsy to be displayed on the fluorescence image without changing the white-light image. When the position where biopsy is to be performed is selected on the fluorescence image, the position is indicated by the
pointer 51 on the white-light image. - A
fluoroscopy system 2 according to a second embodiment of the present invention will now be described usingFigs. 11 to 13 .Fig. 11 is a functional block diagram of thefluoroscopy system 2 according to the second embodiment, which is similar to thefluoroscopy system 1 according to the first embodiment except for the processing performed on the fluorescence image in thecontrol unit 20. The second embodiment is identical to the first embodiment in the process up to the generation of the white-light image and the fluorescence image, but is different from the first embodiment in the processing for displaying the high-fluorescence-intensity region and also in the display for selecting the biopsy region on themonitor 43. - The fluorescence image generated by the fluorescence-
image generating section 30 is transmitted to the image-combiningsection 35, acoloring section 61, and the intensity-distribution generating section 31. On the other hand, the white-light image generated by the white-light-image generating section 29 is transmitted to the image-combiningsection 35. - The intensity-
distribution generating section 31 generates a histogram based on the received fluorescence image. This histogram, as shown inFig. 12B , shows the grayscale levels of the pixels and the numbers of pixels at the respective grayscale levels. - The histogram thus generated is transmitted to the peak-detecting
section 32 and a color-settingsection 62. The peak-detectingsection 32 executes peak detection on the histogram to obtain the peak count and the grayscale levels at the peaks. The grayscale levels at the peaks thus obtained are transmitted to the color-settingsection 62, whereas the peak count is transmitted to the peak-count comparing section 33. - As shown in
Fig. 12B , the color-settingsection 62 stores colors assigned to grayscale levels in advance. The number of classes of grayscale levels for assignment and the colors thereof are variable. As shown inFig. 11 , the color-settingsection 62 receives the histogram generated from the fluorescence image from the intensity-distribution generating section 31 and the grayscale levels at the peaks from the peak-detectingsection 32. - As shown in
Fig. 12B , the color-settingsection 62 determines to what colors the grayscale levels at the peaks detected this time belong, from among the colors assigned to grayscale levels in advance, and sets the colors. That is, different colors are set to different grayscale levels at the peaks so that possible affected areas can be displayed in different colors on themonitor 43. Because the difference in color results from the difference in grayscale level, i.e., from the difference in fluorescence intensity, the affected areas can be displayed so that the difference in malignancy can be easily visualized using color. - The pixels near the grayscale levels at the peaks are also selected from the histogram. The grayscale levels at the histogram peaks, the colors set for the peaks, and the information about the pixels near the peaks are transmitted to the
coloring section 61. - Based on the fluorescence image received from the fluorescence-
image generating section 30, thecoloring section 61 generates a display representing the pixels at and near the grayscale levels at the peaks in the image, using the colors set by the color-settingsection 62. The display is transmitted to the image-combiningsection 35. - As in the first embodiment, the peak-
count comparing section 33 determines whether the received peak count is 1, or 2 or more. If the peak count is 1 or less, it determines that there is no affected area in the field of view and displays the white-light image on themonitor 43. Otherwise, if the peak count is 2 or more, the peak-count comparing section 33 determines that it has detected a signal indicating an affected area and transmits to the button-generatingsection 36 an instruction for generating a button for prompting the user to switch to the fluorescence image on themonitor 43. - The button generated by the button-generating
section 36 is transmitted to the image-combiningsection 35, which combines the button with the white-light image on themonitor 43. Touching the button on themonitor 43 causes theinput section 46 to transmit an input signal through thetouch screen cable 42 to the mode-switchingsection 37 in thecontrol unit 20. The mode-switchingsection 37 transmits an instruction for switching between the two modes, namely, the white-light image and the fluorescence image, to the image-combiningsection 35, which switches from the white-light image to the fluorescence image on themonitor 43. Themonitor 43 may also display a message prompting the user to select a biopsy position, as shown inFig. 12A . - As shown in
Fig. 12A , the fluorescence image thus displayed is an image combined with the display, generated by thecoloring section 61, that represents the regions near the grayscale peaks in different colors depending on the grayscale levels of the fluorescence image. When the user checks this display, which visualizes the difference in malignancy using color, on themonitor 43 and selects the region where biopsy is to be performed from regions B1 and B2 represented in different colors on the touch screen, theinput section 46 transmits selected-region-position information through thetouch screen cable 42 to thecontrol unit 20, which stores the information in the selected-biopsy-position memory 38. - The selected-region-position information is transmitted to the pointer-generating
section 39, which generates a pointer indicating a recommended optimum biopsy point. The information for the pointer is transmitted to the image-combiningsection 35, which, as shown inFig. 9 , superimposes apointer 51 indicating the optimum biopsy position on the white-light image on themonitor 43. - The operation of the
fluoroscopy system 2 thus configured will now be described with reference to the flowchart shown inFig. 13 .
Thefluoroscopy system 2 of this embodiment executes similar processing to thefluoroscopy system 1 of the first embodiment until the display-mode changeover switch is turned on. That is, while the white-light image is displayed and examined, the fluorescence image is not displayed on themonitor 43, although the grayscale levels and the numbers of pixels are counted, and the peak count is always detected (steps S1 to S7). - If the button (display-mode changeover switch) is not touched, control returns to the start of the flowchart, and it is determined again whether there is an affected area in the examination field of view (step S8). Otherwise, if the changeover switch is touched, the display is switched from the white-light image to the fluorescence image, and an image combined with the display representing the high-fluorescence-intensity regions B1 and B2 in different colors depending on malignancy (the grayscale levels at the peaks) is displayed, as shown in
Fig. 12A (step S21). The high-fluorescence-intensity regions mean regions including pixels near the grayscale levels at the peaks in the histogram. - If it is determined that biopsy is needed from the fluorescence image represented in different colors, the region where biopsy is to be performed on the
monitor 43 is selected from the portions represented in different colors using the touch pen 45 (step S10). The subsequent process up to completion of biopsy (steps S11 and S12) is similar to the process in the first embodiment and is therefore not described herein. - As above, not only does the
fluoroscopy system 2 of this embodiment detect a peak level from the histogram of the fluorescence image to detect an affected area with high fluorescence intensity and to display its position on the white-light image, as does thefluoroscopy system 2 of the first embodiment, but it also assigns a color depending on the difference in peak level. In this case, because the fluorescence intensity becomes higher as the malignancy of an affected area becomes higher, the representation of the difference in peak level by color allows the difference in malignancy to be represented by color. Thus, the user can easily recognize the difference in malignancy between a plurality of possible affected areas on the examination screen by color, thereby easily determining where biopsy should be performed. - A
fluoroscopy system 3 according to a third embodiment of the present invention will now be described usingFigs. 14 to 16 .Fig. 14 is a functional block diagram of thefluoroscopy system 3 according to this embodiment, which is similar to the first embodiment described above except for the processing performed on the fluorescence image in thecontrol unit 20. This embodiment generates a white-light image and a fluorescence image, as in the above embodiments, but differs therefrom in the processing performed after generating the fluorescence image. - The fluorescence image generated by the fluorescence-
image generating section 30 is transmitted to the image-combiningsection 35, a contour-displayingsection 71, and the intensity-distribution generating section 31. On the other hand, the white-light image generated by the white-light-image generating section 29 is transmitted to the image-combiningsection 35. - The intensity-
distribution generating section 31 generates a histogram based on the received fluorescence image. This histogram, as shown inFig. 15B , shows the grayscale levels of the pixels and the numbers of pixels at the respective grayscale levels. - The histogram thus generated is transmitted to the peak-detecting
section 32 and a range-settingsection 72. The peak-detectingsection 32 executes peak detection on the histogram to obtain the peak count and the grayscale levels at the peaks. The peak count thus obtained is transmitted to the peak-count comparing section 33. - As shown in
Fig. 15B , the range-settingsection 72 stores ranges, such as a range B0, a range B1, a range B2, etc., assigned to grayscale levels in advance. The number of ranges of grayscale levels for assignment is variable. An example where the grayscale levels are divided into four ranges, namely, B0 to B3, is described herein. The range B0, which is a region having the lowest fluorescence intensity, is assumed to be a normal area, where the fluorescence image is not superimposed on the white-light image. - As shown in
Fig. 14 , the range-settingsection 72 receives the histogram generated from the fluorescence image from the intensity-distribution generating section 31. As shown inFig. 15B , the range-settingsection 72 determines to what ranges the individual grayscale levels belong, from among the grayscale ranges set in advance, and transmits the information about the ranges to which the individual grayscale levels are set to the contour-displayingsection 71. - Based on the fluorescence image received from the fluorescence-
image generating section 30, the contour-displayingsection 71 determines what pixels in the image are located at the limits of the grayscale ranges set as above and generates a contour display for the portion corresponding to those pixels. The contour display thus generated is displayed on the white-light image, as shown inFig. 15A . - This processing provides a contour display of fluorescence intensity, which allows the viewer to easily learn how the fluorescence intensity is distributed and where the fluorescence intensity is high in the fluoroscopy image so that he or she can easily determine the region where biopsy is to be performed.
As in the second embodiment, the regions separated by the contours can be represented in different colors depending on the grayscale levels. - As in the first embodiment, the peak-
count comparing section 33 determines whether the received peak count is 1, or 2 or more. If the peak count is 1 or less, it determines that there is no affected area in the field of view and displays the white-light image on themonitor 43. Otherwise, if the peak count is 2 or more, the peak-count comparing section 33 determines that it has detected a signal indicating an affected area and transmits to the button-generatingsection 36 an instruction for generating a button for prompting the user to switch to the fluorescence image on themonitor 43. - The button generated by the button-generating
section 36 is transmitted to the image-combiningsection 35, which combines the button with the white-light image on themonitor 43. Touching the button on themonitor 43 causes theinput section 46 to transmit an input signal through thetouch screen cable 42 to the mode-switchingsection 37 in thecontrol unit 20. The mode-switchingsection 37 transmits an instruction for switching between the two modes, namely, the white-light image and the fluorescence image, to the image-combiningsection 35, which switches from the white-light image to the fluorescence image on themonitor 43. Themonitor 43 may also display a message prompting the user to select a biopsy position, as shown inFig. 15A . - The fluorescence image thus displayed is an image combined with a contour display of the fluorescence intensity distribution. When the user checks the fluorescence image combined with the contour display on the
monitor 43 and selects the region where biopsy is to be performed on themonitor 43, theinput section 46 transmits selected-region-position information through thetouch screen cable 42 to thecontrol unit 20, which stores the information in the selected-biopsy-position memory 38. The selected-region-position information is transmitted to the pointer-generatingsection 39, which generates a pointer indicating the position where biopsy is to be performed, which is transmitted to the image-combiningsection 35. Thus, a white-light image on which thepointer 51 indicating the position where biopsy is to be performed is superimposed is displayed on themonitor 43. - The operation of the
fluoroscopy system 3 thus configured will now be described with reference to the flowchart shown inFig. 16 .
Thefluoroscopy system 3 of this embodiment executes similar processing to the fluoroscopy systems of the above embodiments until the display-mode changeover switch is turned on. That is, while the white-light image is displayed and examined, the fluorescence image is not displayed on themonitor 43, although the grayscale levels and the numbers of pixels are counted, and the peak count is always detected (steps S1 to S7). - If the button (display-mode changeover switch) is not touched, control returns to the start, and it is determined again whether there is an affected area in the examination field of view (step S8). Otherwise, if the changeover switch is touched, the display is switched from the white-light image to the fluorescence image, and an image combined with a contour display of the fluorescence intensity distribution is displayed, as shown in
Fig. 15A (step S31). - If it is determined that biopsy is needed from the fluorescence image combined with the contour display of the fluorescence intensity distribution, the portion where biopsy is to be performed is selected on the
monitor 43 using the touch pen 45 (step S10). The subsequent process up to completion of biopsy (steps S11 and S12) is similar to the process in the above embodiments and is therefore not described herein. - As above, not only does the
fluoroscopy system 3 of this embodiment detect a peak level from the histogram of the fluorescence image to display its position and to add color for ease of recognition of malignancy, as do the fluoroscopy systems of the above embodiments, but it also provides a straightforward contour display of the fluorescence intensity distribution for a high-intensity region. - Because the fluorescence intensity becomes higher as the malignancy of an affected area becomes higher, the portion having the highest fluorescence intensity in the high-fluorescence-intensity region is a position best suited for biopsy. A straightforward contour display of the fluorescence intensity distribution for the high-intensity region allows the user to easily determine where the fluorescence intensity is highest in the high-fluorescence-intensity region displayed on the examination screen and where is best suited for biopsy.
- A
fluoroscopy system 4 according to a fourth embodiment of the present invention will now be described usingFigs. 17 to 19 .Fig. 17 is a functional block diagram of thefluoroscopy system 4 of this embodiment, which is similar to thefluoroscopy system 1 according to the first embodiment except for the processing performed on the fluorescence image in thecontrol unit 20. This embodiment involves examination of an affected area, as in the above embodiments, but differs therefrom in that the image-combiningsection 35 has an image-enlarging function. - The fluorescence image generated by the fluorescence-
image generating section 30 is transmitted to the image-combiningsection 35, the region-extractingsection 34, and the intensity-distribution generating section 31. On the other hand, the white-light image generated by the white-light-image generating section 29 is transmitted to the image-combiningsection 35. - The fluorescence image transmitted to the region-extracting
section 34 and the intensity-distribution generating section 31 is processed as in the first embodiment, and the region-extractingsection 34 transmits information about a high-fluorescence-intensity region and superimposition information for representing that region to the image-combiningsection 35. The button-generatingsection 36 transmits information for an image-switching button and an enlarge button to the image-combiningsection 35. - Based on the information for the image-switching button received from the button-generating
section 36, the image-combiningsection 35 combines the image-switching button with the white-light image on themonitor 43. Touching the image-switching button on themonitor 43 causes theinput section 46 to transmit an input signal through thetouch screen cable 42 to the mode-switchingsection 37 in thecontrol unit 20. The mode-switchingsection 37 transmits an instruction for switching between the two modes, namely, the white-light image and the fluorescence image, to the image-combiningsection 35, which switches from the white-light image to the fluorescence image on themonitor 43. - As shown in
Fig. 18 , the screen thus displayed is a screen showing a superimposed fluorescence image, as in the first embodiment, with which the enlarge button generated by the button-generatingsection 36 is combined. Touching the enlarge button on themonitor 43 causes theinput section 46 to transmit an input signal through thetouch screen cable 42 to an enlarged-region memory 81 in thecontrol unit 20. At the same time, an instruction for displaying a high-fluorescence-intensity region (superimposed region) B as a white-light image is transmitted to the image-combiningsection 35. Theinput section 46 functions as an area-setting section for designating the area to be enlarged by operating themonitor 43. - Based on the information about the high-fluorescence-intensity region B, the image-combining
section 35 obtains a white-light-image region including pixels corresponding to the region B by trimming. The white-light image obtained by trimming is subjected to digital zoom processing, which assigns pixel data to a plurality of pixels on themonitor 43. The digitally zoomed image is combined and displayed beside the fluorescence image, as shown inFig. 18 . The magnification of the digital zoom processing is variable, and a magnification suitable for examination of an affected area can be selected by touching an enlarge/reduce command button (magnification command button) displayed beside the enlarged image. Themonitor 43 may also display a message prompting the user to select a biopsy position, as shown inFig. 18 . - Selecting the region where biopsy is to be performed on the
monitor 43 via the touch screen causes theinput section 46 to transmit selected-region-position information through thetouch screen cable 42 to thecontrol unit 20, which stores the information in the selected-biopsy-position memory 38. The selected-region-position information is transmitted to the pointer-generatingsection 39, which generates a pointer indicating the position where biopsy is to be performed, which is transmitted to the image-combiningsection 35. Thus, a white-light image in which the position where biopsy is to be performed is indicated is displayed on themonitor 43. - The region where biopsy is to be performed can be set on the touch screen either by selecting the enlarged high-fluorescence-intensity portion or by selecting the region from the entire image before enlargement.
- The operation of the
fluoroscopy system 4 thus configured will now be described with reference to the flowchart shown inFig. 19 .
Thefluoroscopy system 3 of this embodiment executes similar processing to thefluoroscopy system 1 of the first embodiment until the display-mode changeover switch is turned on. That is, while the white-light image is displayed and examined, the fluorescence image is not displayed on themonitor 43, although the grayscale levels and the numbers of pixels are counted, and the peak count is always detected (steps S1 to S7). - If the button (display-mode changeover switch) is not touched, control returns to the start, and it is determined again whether there is an affected area in the examination field of view (step S8). Otherwise, if the changeover switch is touched, the display is switched from the white-light image to the fluorescence image, and a fluorescence image on which the high-fluorescence-intensity region is superimposed and with which the enlarge button is combined is displayed, as shown in
Fig. 18 (step S9). - Touching the enlarge button causes an enlarged white-light image including the high-fluorescence-intensity region (superimposed region) to be displayed beside the fluorescence image (steps S41 and S42). If the enlarge button is not touched, the region where biopsy is to be performed is selected on the screen, or if the biopsy region is not selected, control returns to the start, as in the first embodiment (step S10).
- While examining the enlarged white-light image of the high-fluorescence-intensity region displayed by touching the enlarge button, the user determines whether biopsy should be performed (step S42). The enlarged image provides information about the color, condition, and profile of the subject, thus providing more information for determining whether biopsy should be performed.
- If it is determined that biopsy is needed, the region where biopsy is to be performed is selected on the monitor 43 (touch screen) using the touch pen 45 (step S10). The subsequent process up to completion of biopsy (steps S11 and S12) is similar to the process in the first embodiment and is therefore not described herein.
- As above, not only does the
fluoroscopy system 4 of this embodiment help to determine the biopsy position from the fluorescence image information, as do the fluoroscopy systems of the above embodiments, but it also helps to determine whether biopsy should be performed by providing an enlarged white-light image of a high-fluorescence-intensity region. Because a higher fluorescence intensity indicates an affected area with a higher malignancy, it could have a different color and profile from the surrounding environment in the white-light image. The white-light examination of the high-fluorescence-intensity region provides the user with more information for determining whether biopsy should be performed.
The enlarged white-light image of the high-fluorescence-intensity region provides the user with information about the profile and color of the affected area and the surrounding area, which allows him or her to easily determine where biopsy should be performed. - Whereas embodiments of the present invention have been described in detail above with reference to the drawings, the specific configuration thereof is not limited to those embodiments, but encompasses, for example, design changes within the spirit of the present invention.
For example, although the fluoroscopy system according to the present invention is applied to an endoscope system in the embodiments described above, it may also be applied to, for example, microscope systems.
In addition, although a high-fluorescence-intensity region is superimposed on a fluorescence image by, for example, superimposition processing in the embodiments described above, it may also be superimposed on a white-light image. -
- 1, 2, 3, 4 fluoroscopy system
- 10 endoscope
- 17 light source device (illumination light source)
- 20 control unit
- 29 white-light-image generating section
- 30 fluorescence-image generating section
- 31 intensity-distribution generating section
- 32 peak-detecting section
- 33 peak-count comparing section (peak-count calculating section)
- 34 region-extracting section
- 35 image-combining section
- 36 button-generating section
- 37 mode-switching section
- 38 selected-biopsy-position memory
- 39 pointer-generating section
- 43 monitor (image-displaying section)
- 46 input section (position-designating section, area-designating section)
- 100 endoscope system
- A subject
- B, B1, B2 region
Claims (8)
- A fluoroscopy system comprising:an illumination light source that emits white light and excitation light for irradiation of a subject;a white-light-image generating section that generates a white-light image by capturing the reflected light reflected on the subject irradiated with the white light emitted from the illumination light source;a fluorescence-image generating section that generates a fluorescence image by capturing fluorescence emitted from the subject irradiated with the excitation light emitted from the illumination light source;an intensity-distribution generating section that generates a fluorescence intensity distribution of pixels of the fluorescence image generated by the fluorescence-image generating section;a peak-detecting section that detects a fluorescence-intensity peak in the fluorescence intensity distribution generated by the intensity-distribution generating section;a peak-count calculating section that calculates a count of the peak detected by the peak-detecting section;an image-combining section that generates a combined image by superimposing a display representing a region including a pixel having the fluorescence intensity at the peak detected by the peak-detecting section on the white-light image or the fluorescence image based on the peak count calculated by the peak-count calculating section; andan image-displaying section that displays the combined image generated by the image-combining section.
- The fluoroscopy system according to Claim 1, further comprising a position-designating section via which a desired position is designated in the combined image displayed by the image-displaying section,
wherein the image-combining section generates a combined image by superimposing a display identifying the position designated by the position-designating section on the white-light image. - The fluoroscopy system according to Claim 1, wherein the image-combining section generates a combined image by superimposing a display locating the pixel having the fluorescence intensity at the peak on the white-light image.
- The fluoroscopy system according to Claim 1, wherein if the peak-detecting section detects a plurality of peaks, the image-combining section generates a combined image by superimposing a display representing the region on the fluorescence image.
- The fluoroscopy system according to Claim 1, wherein the image-combining section generates a combined image representing a plurality of the regions corresponding to a plurality of peaks at different fluorescence intensities in different manners for each region.
- The fluoroscopy system according to Claim 5, wherein the image-combining section represents the plurality of regions corresponding to the plurality of peaks at different fluorescence images in different colors.
- The fluoroscopy system according to one of Claims 1 to 6, wherein the image-combining section represents the region by using a boundary line surrounding the region.
- The fluoroscopy system according to Claim 1, further comprising an area-designating section via which a desired area is designated in the combined image displayed by the image-displaying section,
wherein the image-combining section generates a combined image by further combining an enlarged image of an area of the white-light image corresponding to the area designated by the area-designating section.
Applications Claiming Priority (2)
| Application Number | Priority Date | Filing Date | Title |
|---|---|---|---|
| JP2010046568A JP5562683B2 (en) | 2010-03-03 | 2010-03-03 | Fluorescence observation equipment |
| PCT/JP2011/053208 WO2011108354A1 (en) | 2010-03-03 | 2011-02-16 | Fluorescence observation device |
Publications (3)
| Publication Number | Publication Date |
|---|---|
| EP2543308A1 true EP2543308A1 (en) | 2013-01-09 |
| EP2543308A4 EP2543308A4 (en) | 2014-09-03 |
| EP2543308B1 EP2543308B1 (en) | 2015-07-29 |
Family
ID=44542017
Family Applications (1)
| Application Number | Title | Priority Date | Filing Date |
|---|---|---|---|
| EP11750467.0A Not-in-force EP2543308B1 (en) | 2010-03-03 | 2011-02-16 | Fluoroscopy system |
Country Status (5)
| Country | Link |
|---|---|
| US (1) | US8440984B2 (en) |
| EP (1) | EP2543308B1 (en) |
| JP (1) | JP5562683B2 (en) |
| CN (1) | CN102770062B (en) |
| WO (1) | WO2011108354A1 (en) |
Cited By (1)
| Publication number | Priority date | Publication date | Assignee | Title |
|---|---|---|---|---|
| US9538907B2 (en) | 2013-04-12 | 2017-01-10 | Olympus Corporation | Endoscope system and actuation method for displaying an organ model image pasted with an endoscopic image |
Families Citing this family (16)
| Publication number | Priority date | Publication date | Assignee | Title |
|---|---|---|---|---|
| FR2988808B1 (en) * | 2012-03-27 | 2014-03-21 | Maquet Sas | WHITE LED LIGHTING DEVICE, LIGHTING APPARATUS |
| JP6017219B2 (en) * | 2012-08-01 | 2016-10-26 | オリンパス株式会社 | Fluorescence observation apparatus and fluorescence observation system |
| CN104582559B (en) * | 2013-03-06 | 2016-10-12 | 奥林巴斯株式会社 | Endoscopic system and the method for work of endoscopic system |
| US10813554B2 (en) | 2013-03-14 | 2020-10-27 | Lumicell, Inc. | Medical imaging device and methods of use |
| WO2015002311A1 (en) * | 2013-07-05 | 2015-01-08 | オリンパスメディカルシステムズ株式会社 | Medical display device and endoscopic surgery system |
| JP6498126B2 (en) * | 2013-11-28 | 2019-04-10 | オリンパス株式会社 | Fluorescence observation equipment |
| CN106572792B (en) * | 2014-06-05 | 2020-03-06 | 海德堡大学 | Method and component for multispectral imaging |
| JP6584090B2 (en) * | 2015-02-23 | 2019-10-02 | Hoya株式会社 | Image processing device |
| WO2017073338A1 (en) * | 2015-10-26 | 2017-05-04 | オリンパス株式会社 | Endoscope image processing device |
| JPWO2017073337A1 (en) * | 2015-10-27 | 2017-11-09 | オリンパス株式会社 | Endoscope apparatus and video processor |
| JP6834184B2 (en) * | 2016-06-16 | 2021-02-24 | ソニー株式会社 | Information processing device, operation method of information processing device, program and medical observation system |
| CN108195802B (en) * | 2017-11-21 | 2020-09-15 | 广州标旗电子科技有限公司 | Diamond luminescence imaging detection method |
| KR102303701B1 (en) * | 2019-10-04 | 2021-09-17 | 동국대학교 산학협력단 | Real-Time Biopsy Analysis System and Method Thereof |
| JPWO2022044371A1 (en) * | 2020-08-26 | 2022-03-03 | ||
| WO2022054400A1 (en) * | 2020-09-11 | 2022-03-17 | 富士フイルム株式会社 | Image processing system, processor device, endoscope system, image processing method, and program |
| JP7147890B2 (en) * | 2021-02-04 | 2022-10-05 | ソニーグループ株式会社 | Information processing system, information processing method and program |
Citations (2)
| Publication number | Priority date | Publication date | Assignee | Title |
|---|---|---|---|---|
| US6364829B1 (en) * | 1999-01-26 | 2002-04-02 | Newton Laboratories, Inc. | Autofluorescence imaging system for endoscopy |
| EP2081016A2 (en) * | 2008-01-16 | 2009-07-22 | Konica Minolta Sensing, Inc. | Fluorescence detecting apparatus, and fluorescence detecting method |
Family Cites Families (11)
| Publication number | Priority date | Publication date | Assignee | Title |
|---|---|---|---|---|
| JP3771985B2 (en) | 1997-01-20 | 2006-05-10 | オリンパス株式会社 | Fluorescence observation endoscope device |
| US6422994B1 (en) * | 1997-09-24 | 2002-07-23 | Olympus Optical Co., Ltd. | Fluorescent diagnostic system and method providing color discrimination enhancement |
| EP1148810B1 (en) * | 1999-01-26 | 2005-11-16 | Newton Laboratories, Inc. | Autofluorescence imaging system for endoscopy |
| US6826424B1 (en) * | 2000-12-19 | 2004-11-30 | Haishan Zeng | Methods and apparatus for fluorescence and reflectance imaging and spectroscopy and for contemporaneous measurements of electromagnetic radiation with multiple measuring devices |
| CN1493250A (en) * | 2002-10-31 | 2004-05-05 | ƽ | Device using endoscope to diagnose precancer affection |
| JP4394402B2 (en) * | 2003-09-11 | 2010-01-06 | Hoya株式会社 | Endoscope system |
| JP2005204958A (en) * | 2004-01-23 | 2005-08-04 | Pentax Corp | Autofluorescently observable electronic endoscope apparatus and system |
| JP2005319116A (en) * | 2004-05-10 | 2005-11-17 | Pentax Corp | Fluorescent observation endoscope apparatus |
| JP4418362B2 (en) * | 2004-12-28 | 2010-02-17 | オリンパス株式会社 | Image processing device |
| JP5074044B2 (en) * | 2007-01-18 | 2012-11-14 | オリンパス株式会社 | Fluorescence observation apparatus and method of operating fluorescence observation apparatus |
| EP2074933B1 (en) * | 2007-12-19 | 2012-05-02 | Kantonsspital Aarau AG | Method of analysing and processing fluorescent images |
-
2010
- 2010-03-03 JP JP2010046568A patent/JP5562683B2/en active Active
-
2011
- 2011-02-16 WO PCT/JP2011/053208 patent/WO2011108354A1/en active Application Filing
- 2011-02-16 EP EP11750467.0A patent/EP2543308B1/en not_active Not-in-force
- 2011-02-16 CN CN201180011021.8A patent/CN102770062B/en not_active Expired - Fee Related
-
2012
- 2012-08-29 US US13/597,978 patent/US8440984B2/en active Active
Patent Citations (2)
| Publication number | Priority date | Publication date | Assignee | Title |
|---|---|---|---|---|
| US6364829B1 (en) * | 1999-01-26 | 2002-04-02 | Newton Laboratories, Inc. | Autofluorescence imaging system for endoscopy |
| EP2081016A2 (en) * | 2008-01-16 | 2009-07-22 | Konica Minolta Sensing, Inc. | Fluorescence detecting apparatus, and fluorescence detecting method |
Non-Patent Citations (1)
| Title |
|---|
| See also references of WO2011108354A1 * |
Cited By (1)
| Publication number | Priority date | Publication date | Assignee | Title |
|---|---|---|---|---|
| US9538907B2 (en) | 2013-04-12 | 2017-01-10 | Olympus Corporation | Endoscope system and actuation method for displaying an organ model image pasted with an endoscopic image |
Also Published As
| Publication number | Publication date |
|---|---|
| EP2543308B1 (en) | 2015-07-29 |
| WO2011108354A1 (en) | 2011-09-09 |
| JP2011177419A (en) | 2011-09-15 |
| CN102770062A (en) | 2012-11-07 |
| US8440984B2 (en) | 2013-05-14 |
| JP5562683B2 (en) | 2014-07-30 |
| EP2543308A4 (en) | 2014-09-03 |
| CN102770062B (en) | 2014-12-24 |
| US20120319006A1 (en) | 2012-12-20 |
Similar Documents
| Publication | Publication Date | Title |
|---|---|---|
| EP2543308B1 (en) | Fluoroscopy system | |
| JP6785941B2 (en) | Endoscopic system and how to operate it | |
| JP6834184B2 (en) | Information processing device, operation method of information processing device, program and medical observation system | |
| JP6053673B2 (en) | Fluorescence observation apparatus and image display method thereof | |
| JP6103827B2 (en) | Image processing apparatus and stereoscopic image observation system | |
| JP4875319B2 (en) | Endoscope | |
| JPWO2018221033A1 (en) | Medical image processing device, endoscope system, diagnosis support device, and medical service support device | |
| JP7060536B2 (en) | Endoscopic image processing device, operation method and program of endoscopic image processing device, endoscopic system | |
| US20140037179A1 (en) | Fluoroscopy apparatus and fluoroscopy system | |
| US20140085686A1 (en) | Fluorescence observation device | |
| JP4298151B2 (en) | Fluorescent image display method and apparatus | |
| US20210153720A1 (en) | Medical image processing apparatus, endoscope system, and method for operating medical image processing apparatus | |
| JP7190597B2 (en) | endoscope system | |
| JP7335399B2 (en) | MEDICAL IMAGE PROCESSING APPARATUS, ENDOSCOPE SYSTEM, AND METHOD OF OPERATION OF MEDICAL IMAGE PROCESSING APPARATUS | |
| WO2020090729A1 (en) | Medical image processing apparatus, medical image processing method and program, and diagnosis assisting apparatus | |
| JP2002345739A (en) | Image display device | |
| JP7291314B2 (en) | Medical imaging device and method of operating a medical imaging device | |
| WO2021201272A1 (en) | Medical image processing apparatus, endoscope system, operation method for medical image processing apparatus, and program for medical image processing apparatus | |
| WO2022014235A1 (en) | Image analysis processing device, endoscopy system, operation method for image analysis processing device, and program for image analysis processing device | |
| WO2022009478A1 (en) | Image processing device, endoscope system, operation method for image processing device, and program for image processing device | |
| US20220378276A1 (en) | Endoscopy service support device, endoscopy service support system, and method of operating endoscopy service support device | |
| CN115607092A (en) | Endoscope system, medical image processing apparatus, and method of operating the same |
Legal Events
| Date | Code | Title | Description |
|---|---|---|---|
| PUAI | Public reference made under article 153(3) epc to a published international application that has entered the european phase |
Free format text: ORIGINAL CODE: 0009012 |
|
| 17P | Request for examination filed |
Effective date: 20120829 |
|
| AK | Designated contracting states |
Kind code of ref document: A1 Designated state(s): AL AT BE BG CH CY CZ DE DK EE ES FI FR GB GR HR HU IE IS IT LI LT LU LV MC MK MT NL NO PL PT RO RS SE SI SK SM TR |
|
| DAX | Request for extension of the european patent (deleted) | ||
| A4 | Supplementary search report drawn up and despatched |
Effective date: 20140805 |
|
| RIC1 | Information provided on ipc code assigned before grant |
Ipc: A61B 1/04 20060101ALI20140730BHEP Ipc: A61B 1/00 20060101AFI20140730BHEP |
|
| GRAP | Despatch of communication of intention to grant a patent |
Free format text: ORIGINAL CODE: EPIDOSNIGR1 |
|
| INTG | Intention to grant announced |
Effective date: 20150305 |
|
| GRAS | Grant fee paid |
Free format text: ORIGINAL CODE: EPIDOSNIGR3 |
|
| GRAA | (expected) grant |
Free format text: ORIGINAL CODE: 0009210 |
|
| AK | Designated contracting states |
Kind code of ref document: B1 Designated state(s): AL AT BE BG CH CY CZ DE DK EE ES FI FR GB GR HR HU IE IS IT LI LT LU LV MC MK MT NL NO PL PT RO RS SE SI SK SM TR |
|
| REG | Reference to a national code |
Ref country code: GB Ref legal event code: FG4D |
|
| REG | Reference to a national code |
Ref country code: CH Ref legal event code: EP |
|
| REG | Reference to a national code |
Ref country code: AT Ref legal event code: REF Ref document number: 738614 Country of ref document: AT Kind code of ref document: T Effective date: 20150815 |
|
| REG | Reference to a national code |
Ref country code: IE Ref legal event code: FG4D |
|
| REG | Reference to a national code |
Ref country code: DE Ref legal event code: R096 Ref document number: 602011018269 Country of ref document: DE |
|
| REG | Reference to a national code |
Ref country code: AT Ref legal event code: MK05 Ref document number: 738614 Country of ref document: AT Kind code of ref document: T Effective date: 20150729 |
|
| REG | Reference to a national code |
Ref country code: LT Ref legal event code: MG4D |
|
| REG | Reference to a national code |
Ref country code: NL Ref legal event code: MP Effective date: 20150729 |
|
| PG25 | Lapsed in a contracting state [announced via postgrant information from national office to epo] |
Ref country code: NO Free format text: LAPSE BECAUSE OF FAILURE TO SUBMIT A TRANSLATION OF THE DESCRIPTION OR TO PAY THE FEE WITHIN THE PRESCRIBED TIME-LIMIT Effective date: 20151029 Ref country code: LV Free format text: LAPSE BECAUSE OF FAILURE TO SUBMIT A TRANSLATION OF THE DESCRIPTION OR TO PAY THE FEE WITHIN THE PRESCRIBED TIME-LIMIT Effective date: 20150729 Ref country code: GR Free format text: LAPSE BECAUSE OF FAILURE TO SUBMIT A TRANSLATION OF THE DESCRIPTION OR TO PAY THE FEE WITHIN THE PRESCRIBED TIME-LIMIT Effective date: 20151030 Ref country code: LT Free format text: LAPSE BECAUSE OF FAILURE TO SUBMIT A TRANSLATION OF THE DESCRIPTION OR TO PAY THE FEE WITHIN THE PRESCRIBED TIME-LIMIT Effective date: 20150729 Ref country code: FI Free format text: LAPSE BECAUSE OF FAILURE TO SUBMIT A TRANSLATION OF THE DESCRIPTION OR TO PAY THE FEE WITHIN THE PRESCRIBED TIME-LIMIT Effective date: 20150729 |
|
| PG25 | Lapsed in a contracting state [announced via postgrant information from national office to epo] |
Ref country code: IS Free format text: LAPSE BECAUSE OF FAILURE TO SUBMIT A TRANSLATION OF THE DESCRIPTION OR TO PAY THE FEE WITHIN THE PRESCRIBED TIME-LIMIT Effective date: 20151129 Ref country code: PT Free format text: LAPSE BECAUSE OF FAILURE TO SUBMIT A TRANSLATION OF THE DESCRIPTION OR TO PAY THE FEE WITHIN THE PRESCRIBED TIME-LIMIT Effective date: 20151130 Ref country code: PL Free format text: LAPSE BECAUSE OF FAILURE TO SUBMIT A TRANSLATION OF THE DESCRIPTION OR TO PAY THE FEE WITHIN THE PRESCRIBED TIME-LIMIT Effective date: 20150729 Ref country code: RS Free format text: LAPSE BECAUSE OF FAILURE TO SUBMIT A TRANSLATION OF THE DESCRIPTION OR TO PAY THE FEE WITHIN THE PRESCRIBED TIME-LIMIT Effective date: 20150729 Ref country code: SE Free format text: LAPSE BECAUSE OF FAILURE TO SUBMIT A TRANSLATION OF THE DESCRIPTION OR TO PAY THE FEE WITHIN THE PRESCRIBED TIME-LIMIT Effective date: 20150729 Ref country code: ES Free format text: LAPSE BECAUSE OF FAILURE TO SUBMIT A TRANSLATION OF THE DESCRIPTION OR TO PAY THE FEE WITHIN THE PRESCRIBED TIME-LIMIT Effective date: 20150729 Ref country code: HR Free format text: LAPSE BECAUSE OF FAILURE TO SUBMIT A TRANSLATION OF THE DESCRIPTION OR TO PAY THE FEE WITHIN THE PRESCRIBED TIME-LIMIT Effective date: 20150729 Ref country code: AT Free format text: LAPSE BECAUSE OF FAILURE TO SUBMIT A TRANSLATION OF THE DESCRIPTION OR TO PAY THE FEE WITHIN THE PRESCRIBED TIME-LIMIT Effective date: 20150729 |
|
| PG25 | Lapsed in a contracting state [announced via postgrant information from national office to epo] |
Ref country code: NL Free format text: LAPSE BECAUSE OF FAILURE TO SUBMIT A TRANSLATION OF THE DESCRIPTION OR TO PAY THE FEE WITHIN THE PRESCRIBED TIME-LIMIT Effective date: 20150729 |
|
| PG25 | Lapsed in a contracting state [announced via postgrant information from national office to epo] |
Ref country code: SK Free format text: LAPSE BECAUSE OF FAILURE TO SUBMIT A TRANSLATION OF THE DESCRIPTION OR TO PAY THE FEE WITHIN THE PRESCRIBED TIME-LIMIT Effective date: 20150729 Ref country code: DK Free format text: LAPSE BECAUSE OF FAILURE TO SUBMIT A TRANSLATION OF THE DESCRIPTION OR TO PAY THE FEE WITHIN THE PRESCRIBED TIME-LIMIT Effective date: 20150729 Ref country code: CZ Free format text: LAPSE BECAUSE OF FAILURE TO SUBMIT A TRANSLATION OF THE DESCRIPTION OR TO PAY THE FEE WITHIN THE PRESCRIBED TIME-LIMIT Effective date: 20150729 Ref country code: EE Free format text: LAPSE BECAUSE OF FAILURE TO SUBMIT A TRANSLATION OF THE DESCRIPTION OR TO PAY THE FEE WITHIN THE PRESCRIBED TIME-LIMIT Effective date: 20150729 Ref country code: IT Free format text: LAPSE BECAUSE OF FAILURE TO SUBMIT A TRANSLATION OF THE DESCRIPTION OR TO PAY THE FEE WITHIN THE PRESCRIBED TIME-LIMIT Effective date: 20150729 |
|
| REG | Reference to a national code |
Ref country code: DE Ref legal event code: R097 Ref document number: 602011018269 Country of ref document: DE |
|
| PG25 | Lapsed in a contracting state [announced via postgrant information from national office to epo] |
Ref country code: RO Free format text: LAPSE BECAUSE OF FAILURE TO SUBMIT A TRANSLATION OF THE DESCRIPTION OR TO PAY THE FEE WITHIN THE PRESCRIBED TIME-LIMIT Effective date: 20150729 Ref country code: BE Free format text: LAPSE BECAUSE OF NON-PAYMENT OF DUE FEES Effective date: 20160229 |
|
| PLBE | No opposition filed within time limit |
Free format text: ORIGINAL CODE: 0009261 |
|
| STAA | Information on the status of an ep patent application or granted ep patent |
Free format text: STATUS: NO OPPOSITION FILED WITHIN TIME LIMIT |
|
| 26N | No opposition filed |
Effective date: 20160502 |
|
| PG25 | Lapsed in a contracting state [announced via postgrant information from national office to epo] |
Ref country code: SI Free format text: LAPSE BECAUSE OF FAILURE TO SUBMIT A TRANSLATION OF THE DESCRIPTION OR TO PAY THE FEE WITHIN THE PRESCRIBED TIME-LIMIT Effective date: 20150729 |
|
| PG25 | Lapsed in a contracting state [announced via postgrant information from national office to epo] |
Ref country code: LU Free format text: LAPSE BECAUSE OF FAILURE TO SUBMIT A TRANSLATION OF THE DESCRIPTION OR TO PAY THE FEE WITHIN THE PRESCRIBED TIME-LIMIT Effective date: 20160216 Ref country code: MC Free format text: LAPSE BECAUSE OF FAILURE TO SUBMIT A TRANSLATION OF THE DESCRIPTION OR TO PAY THE FEE WITHIN THE PRESCRIBED TIME-LIMIT Effective date: 20150729 |
|
| REG | Reference to a national code |
Ref country code: CH Ref legal event code: PL |
|
| GBPC | Gb: european patent ceased through non-payment of renewal fee |
Effective date: 20160216 |
|
| PG25 | Lapsed in a contracting state [announced via postgrant information from national office to epo] |
Ref country code: CH Free format text: LAPSE BECAUSE OF NON-PAYMENT OF DUE FEES Effective date: 20160229 Ref country code: LI Free format text: LAPSE BECAUSE OF NON-PAYMENT OF DUE FEES Effective date: 20160229 |
|
| REG | Reference to a national code |
Ref country code: FR Ref legal event code: ST Effective date: 20161028 |
|
| REG | Reference to a national code |
Ref country code: IE Ref legal event code: MM4A |
|
| PG25 | Lapsed in a contracting state [announced via postgrant information from national office to epo] |
Ref country code: BE Free format text: LAPSE BECAUSE OF FAILURE TO SUBMIT A TRANSLATION OF THE DESCRIPTION OR TO PAY THE FEE WITHIN THE PRESCRIBED TIME-LIMIT Effective date: 20150729 |
|
| PG25 | Lapsed in a contracting state [announced via postgrant information from national office to epo] |
Ref country code: GB Free format text: LAPSE BECAUSE OF NON-PAYMENT OF DUE FEES Effective date: 20160216 Ref country code: IE Free format text: LAPSE BECAUSE OF NON-PAYMENT OF DUE FEES Effective date: 20160216 Ref country code: FR Free format text: LAPSE BECAUSE OF NON-PAYMENT OF DUE FEES Effective date: 20160229 |
|
| PG25 | Lapsed in a contracting state [announced via postgrant information from national office to epo] |
Ref country code: MT Free format text: LAPSE BECAUSE OF FAILURE TO SUBMIT A TRANSLATION OF THE DESCRIPTION OR TO PAY THE FEE WITHIN THE PRESCRIBED TIME-LIMIT Effective date: 20150729 |
|
| PGFP | Annual fee paid to national office [announced via postgrant information from national office to epo] |
Ref country code: DE Payment date: 20180206 Year of fee payment: 8 |
|
| PG25 | Lapsed in a contracting state [announced via postgrant information from national office to epo] |
Ref country code: SM Free format text: LAPSE BECAUSE OF FAILURE TO SUBMIT A TRANSLATION OF THE DESCRIPTION OR TO PAY THE FEE WITHIN THE PRESCRIBED TIME-LIMIT Effective date: 20150729 Ref country code: HU Free format text: LAPSE BECAUSE OF FAILURE TO SUBMIT A TRANSLATION OF THE DESCRIPTION OR TO PAY THE FEE WITHIN THE PRESCRIBED TIME-LIMIT; INVALID AB INITIO Effective date: 20110216 Ref country code: CY Free format text: LAPSE BECAUSE OF FAILURE TO SUBMIT A TRANSLATION OF THE DESCRIPTION OR TO PAY THE FEE WITHIN THE PRESCRIBED TIME-LIMIT Effective date: 20150729 |
|
| PG25 | Lapsed in a contracting state [announced via postgrant information from national office to epo] |
Ref country code: MT Free format text: LAPSE BECAUSE OF FAILURE TO SUBMIT A TRANSLATION OF THE DESCRIPTION OR TO PAY THE FEE WITHIN THE PRESCRIBED TIME-LIMIT Effective date: 20160229 Ref country code: TR Free format text: LAPSE BECAUSE OF FAILURE TO SUBMIT A TRANSLATION OF THE DESCRIPTION OR TO PAY THE FEE WITHIN THE PRESCRIBED TIME-LIMIT Effective date: 20150729 Ref country code: MK Free format text: LAPSE BECAUSE OF FAILURE TO SUBMIT A TRANSLATION OF THE DESCRIPTION OR TO PAY THE FEE WITHIN THE PRESCRIBED TIME-LIMIT Effective date: 20150729 |
|
| PG25 | Lapsed in a contracting state [announced via postgrant information from national office to epo] |
Ref country code: BG Free format text: LAPSE BECAUSE OF FAILURE TO SUBMIT A TRANSLATION OF THE DESCRIPTION OR TO PAY THE FEE WITHIN THE PRESCRIBED TIME-LIMIT Effective date: 20150729 |
|
| PG25 | Lapsed in a contracting state [announced via postgrant information from national office to epo] |
Ref country code: AL Free format text: LAPSE BECAUSE OF FAILURE TO SUBMIT A TRANSLATION OF THE DESCRIPTION OR TO PAY THE FEE WITHIN THE PRESCRIBED TIME-LIMIT Effective date: 20150729 |
|
| REG | Reference to a national code |
Ref country code: DE Ref legal event code: R119 Ref document number: 602011018269 Country of ref document: DE |
|
| PG25 | Lapsed in a contracting state [announced via postgrant information from national office to epo] |
Ref country code: DE Free format text: LAPSE BECAUSE OF NON-PAYMENT OF DUE FEES Effective date: 20190903 |