EP1196081B1 - Integrated imaging apparatus - Google Patents
Integrated imaging apparatus Download PDFInfo
- Publication number
- EP1196081B1 EP1196081B1 EP00943361.6A EP00943361A EP1196081B1 EP 1196081 B1 EP1196081 B1 EP 1196081B1 EP 00943361 A EP00943361 A EP 00943361A EP 1196081 B1 EP1196081 B1 EP 1196081B1
- Authority
- EP
- European Patent Office
- Prior art keywords
- data
- images
- image
- sample
- spectral
- Prior art date
- Legal status (The legal status is an assumption and is not a legal conclusion. Google has not performed a legal analysis and makes no representation as to the accuracy of the status listed.)
- Expired - Lifetime
Links
Images
Classifications
-
- A—HUMAN NECESSITIES
- A61—MEDICAL OR VETERINARY SCIENCE; HYGIENE
- A61B—DIAGNOSIS; SURGERY; IDENTIFICATION
- A61B5/00—Measuring for diagnostic purposes; Identification of persons
- A61B5/44—Detecting, measuring or recording for evaluating the integumentary system, e.g. skin, hair or nails
- A61B5/441—Skin evaluation, e.g. for skin disorder diagnosis
- A61B5/442—Evaluating skin mechanical properties, e.g. elasticity, hardness, texture, wrinkle assessment
-
- A—HUMAN NECESSITIES
- A61—MEDICAL OR VETERINARY SCIENCE; HYGIENE
- A61B—DIAGNOSIS; SURGERY; IDENTIFICATION
- A61B5/00—Measuring for diagnostic purposes; Identification of persons
- A61B5/0059—Measuring for diagnostic purposes; Identification of persons using light, e.g. diagnosis by transillumination, diascopy, fluorescence
- A61B5/0071—Measuring for diagnostic purposes; Identification of persons using light, e.g. diagnosis by transillumination, diascopy, fluorescence by measuring fluorescence emission
-
- A—HUMAN NECESSITIES
- A61—MEDICAL OR VETERINARY SCIENCE; HYGIENE
- A61B—DIAGNOSIS; SURGERY; IDENTIFICATION
- A61B5/00—Measuring for diagnostic purposes; Identification of persons
- A61B5/0059—Measuring for diagnostic purposes; Identification of persons using light, e.g. diagnosis by transillumination, diascopy, fluorescence
- A61B5/0073—Measuring for diagnostic purposes; Identification of persons using light, e.g. diagnosis by transillumination, diascopy, fluorescence by tomography, i.e. reconstruction of 3D images from 2D projections
-
- A—HUMAN NECESSITIES
- A61—MEDICAL OR VETERINARY SCIENCE; HYGIENE
- A61B—DIAGNOSIS; SURGERY; IDENTIFICATION
- A61B5/00—Measuring for diagnostic purposes; Identification of persons
- A61B5/0059—Measuring for diagnostic purposes; Identification of persons using light, e.g. diagnosis by transillumination, diascopy, fluorescence
- A61B5/0077—Devices for viewing the surface of the body, e.g. camera, magnifying lens
-
- A—HUMAN NECESSITIES
- A61—MEDICAL OR VETERINARY SCIENCE; HYGIENE
- A61B—DIAGNOSIS; SURGERY; IDENTIFICATION
- A61B5/00—Measuring for diagnostic purposes; Identification of persons
- A61B5/01—Measuring temperature of body parts ; Diagnostic temperature sensing, e.g. for malignant or inflamed tissue
- A61B5/015—By temperature mapping of body part
-
- A—HUMAN NECESSITIES
- A61—MEDICAL OR VETERINARY SCIENCE; HYGIENE
- A61B—DIAGNOSIS; SURGERY; IDENTIFICATION
- A61B5/00—Measuring for diagnostic purposes; Identification of persons
- A61B5/145—Measuring characteristics of blood in vivo, e.g. gas concentration, pH value; Measuring characteristics of body fluids or tissues, e.g. interstitial fluid, cerebral tissue
- A61B5/14535—Measuring characteristics of blood in vivo, e.g. gas concentration, pH value; Measuring characteristics of body fluids or tissues, e.g. interstitial fluid, cerebral tissue for measuring haematocrit
-
- A—HUMAN NECESSITIES
- A61—MEDICAL OR VETERINARY SCIENCE; HYGIENE
- A61B—DIAGNOSIS; SURGERY; IDENTIFICATION
- A61B5/00—Measuring for diagnostic purposes; Identification of persons
- A61B5/145—Measuring characteristics of blood in vivo, e.g. gas concentration, pH value; Measuring characteristics of body fluids or tissues, e.g. interstitial fluid, cerebral tissue
- A61B5/1455—Measuring characteristics of blood in vivo, e.g. gas concentration, pH value; Measuring characteristics of body fluids or tissues, e.g. interstitial fluid, cerebral tissue using optical sensors, e.g. spectral photometrical oximeters
-
- A—HUMAN NECESSITIES
- A61—MEDICAL OR VETERINARY SCIENCE; HYGIENE
- A61B—DIAGNOSIS; SURGERY; IDENTIFICATION
- A61B5/00—Measuring for diagnostic purposes; Identification of persons
- A61B5/41—Detecting, measuring or recording for evaluating the immune or lymphatic systems
- A61B5/414—Evaluating particular organs or parts of the immune or lymphatic systems
- A61B5/415—Evaluating particular organs or parts of the immune or lymphatic systems the glands, e.g. tonsils, adenoids or thymus
-
- A—HUMAN NECESSITIES
- A61—MEDICAL OR VETERINARY SCIENCE; HYGIENE
- A61B—DIAGNOSIS; SURGERY; IDENTIFICATION
- A61B5/00—Measuring for diagnostic purposes; Identification of persons
- A61B5/41—Detecting, measuring or recording for evaluating the immune or lymphatic systems
- A61B5/414—Evaluating particular organs or parts of the immune or lymphatic systems
- A61B5/418—Evaluating particular organs or parts of the immune or lymphatic systems lymph vessels, ducts or nodes
-
- A—HUMAN NECESSITIES
- A61—MEDICAL OR VETERINARY SCIENCE; HYGIENE
- A61B—DIAGNOSIS; SURGERY; IDENTIFICATION
- A61B5/00—Measuring for diagnostic purposes; Identification of persons
- A61B5/44—Detecting, measuring or recording for evaluating the integumentary system, e.g. skin, hair or nails
- A61B5/441—Skin evaluation, e.g. for skin disorder diagnosis
- A61B5/444—Evaluating skin marks, e.g. mole, nevi, tumour, scar
-
- A—HUMAN NECESSITIES
- A61—MEDICAL OR VETERINARY SCIENCE; HYGIENE
- A61B—DIAGNOSIS; SURGERY; IDENTIFICATION
- A61B5/00—Measuring for diagnostic purposes; Identification of persons
- A61B5/44—Detecting, measuring or recording for evaluating the integumentary system, e.g. skin, hair or nails
- A61B5/441—Skin evaluation, e.g. for skin disorder diagnosis
- A61B5/445—Evaluating skin irritation or skin trauma, e.g. rash, eczema, wound, bed sore
-
- A—HUMAN NECESSITIES
- A61—MEDICAL OR VETERINARY SCIENCE; HYGIENE
- A61B—DIAGNOSIS; SURGERY; IDENTIFICATION
- A61B5/00—Measuring for diagnostic purposes; Identification of persons
- A61B5/44—Detecting, measuring or recording for evaluating the integumentary system, e.g. skin, hair or nails
- A61B5/441—Skin evaluation, e.g. for skin disorder diagnosis
Definitions
- the invention is directed to an imaging apparatus and methods for performing assessment and monitoring with interpreted imaging.
- Embodiments of the invention are particularly useful in surgery, clinical procedures, tissue assessment, diagnostic procedures, health monitoring, and medical evaluations.
- Spectroscopy is an enormously powerful tool for the analysis of biomedical samples.
- the medical community has a definite preference for imaging methods, as exemplified by methods such as MRI and CT scanning as well as standard X-ray photography and ultrasound imaging. This is entirely understandable as many factors need to be taken into account for a physician to make a clinical diagnosis. Imaging methods potentially can provide far more information to a physician than their non-imaging counterparts. With this medical reality in mind, there has been considerable effort put into combining the power and versatility of imaging method with the specificity of spectroscopic methods.
- Near-infrared (near-IR) spectroscopy and spectroscopic imaging can measure the balance between oxygen delivery and tissue oxygen utilization by monitoring the hemoglobin oxygen saturation in tissues ( Sowa, M.G. et al., 1998, Proc. SPIE 3252, pp. 199-207 ; Sowa, G.W. et al., 1999, Journal of Surgical Research, 86:62-29 ; Sow, G.W. et al., 1999, Journal of Biomedical Optics, 4:474-481 ; Mansfield, J.R., et al., 2000, International Society of Optical Engineers, 3920:99-197 ).
- Non-invasive monitoring of hemoglobin oxygenation exploits the differential absorption of HbO 2 and Hb, along with the fact that near-IR radiation can penetrate relatively deeply into tissues.
- Pulse oximetry routinely supplies a noninvasive measure of arterial hemoglobin oxygenation based on the differential red-visible and near infrared absorption of Hb and HbO 2 .
- Visible/near-IR multispectral imaging permits the regional variations in tissue perfusion to be mapped on macro and micro scale. Unlike infrared thermography, hyperspectral imaging alone does not map the thermal emission of the tissues.
- this imaging method relies on the differential absorption of light by a chromophore, such as, Hb and HbO 2 , resulting in differences in the wavelength dependence of the tissue reflectance depending on the hemoglobin oxygen saturation of the tissue.
- Spectroscopic imaging methodologies and data are becoming increasingly common in analytical laboratories, whether it be magnetic resonance (MRI), mid-IR, Raman, fluorescence and optical microscopy, or near-IR/visible-based imaging.
- MRI magnetic resonance
- Raman Raman
- fluorescence and optical microscopy or near-IR/visible-based imaging.
- the volume of information contained in spectroscopic images can make standard data processing techniques cumbersome.
- the objective of analyzing spectroscopic images is not only to determine what the spectrum is at any particular pixel in the sample, but also to determine which regions of the sample contain similar spectra; i.e., what regions of the sample contain chemically related compounds.
- Multivariate analysis methodologies can be used to determine both the spectral and spatial characteristics of a sample within a spectroscopic imaging data set. These techniques can also be used to analyze variations in the temporal shape of a time series of images either derived for extracted from a time series of spectroscopic images.
- Spectroscopic imaging provides the specificity of spectroscopy while at the same time relaying spatial information by providing images of the sample that convey some chemical meaning.
- the objective in analyzing heterogeneous systems is to identify not only the components present in the system, but their spatial distribution.
- the true power of this technique relative to traditional imaging methods lies in its inherent multivariate nature. Spatial relationships among many parameters can be assessed simultaneously.
- the chemical heterogeneity or regional similarity within a sample is captured in a high dimensional representation which can be projected onto a number of meaningful low dimensional easily interpretable representations which typically comprise a set of composite images each having a specific meaning.
- spectroscopic imaging data cube spectroscopic imaging data cube or just hypercube.
- This is a three dimensional array of data, consisting of two spatial dimensions (the imaging component), and one spectral dimension. It can be thought of as an array of spatially resolved individual spectra, with every pixel in the first image consisting of an entire spectrum, or as a series of spectrally resolved images.
- the 3D data cube can be treated as a single entity containing enormous amounts of spatial and spectral information about the sample from which it was acquired.
- Multi-modal image fusion is an important problem frequently addressed in medical image analysis. Registration is the process of aligning data that arise from different sources into one consistent coordinate frame. For example, various tissues appear more clearly in different types of imaging methods. Soft tissue, for example, is imaged well in MR scans, while bone is more easily discernible in CT scans. Blood vessels are often highlighted better in an MR angiogram than in a standard MR scan. Multiple scans of the same patient will generally be unregistered when acquired, as the patient may be in different positions in each scanner, and each scanner has its own coordinate system. In order to fuse the information from all scans into one coherent frame, the scans must be registered. The very reason why multiple scans are useful is what makes the registration process difficult. As each modality images tissue differently and has its own artifacts and noise characteristics, accurately modeling the intensity relationship between the scans, and subsequently aligning them, is difficult.
- the registration of two images consists of finding the transformation that best maps one image into the other. If I 1 and I 2 are two images of the same tissue and T is the correct transformation, then the voxel I 1 (x) corresponds to the same position in the sample as the voxel I 2 (T(x)).
- T is a rigid transformation consisting of three degrees of freedom of rotation and three degrees of freedom of translation. The need for rigid registration arises primarily from the patient being in different positions in the scanning devices used to image the anatomy. The information from all the images is best used when presented in one unified coordinate system. Without such image fusion, the clinician must mentally relate the information from the disparate coordinate frames.
- One method of aligning the two images is to define an intermediate, patient-centered coordinate system, instead of trying to directly register the images to one another.
- An example of a patient-centered reference frame is the use of fiducial markers attached to a patient throughout the various image acquisitions.
- the fiducial markers define a coordinate system specific to the patient, independent of the scanner or choice of imaging modality.
- the volumes can be registered by computing the best alignment of the corresponding fiducials ( Horn, B.K.P., 1987, Journal of the Optical Society of America A, 4:629-642 ; Mandava, V.R., et al., Proc SPIE, 1992, 1652:271-282 ; Haralick, R.M., et al., 1993, Computer and Robot Vision ).
- the main drawback of this method is that the markers must remain attached to the patient at the same positions throughout all image acquisitions. For applications such as change detection over months or years, this registration method is not suitable.
- Fiducial registration is typically used as ground-truth to evaluate the accuracy of other methods as careful placement and localization of the markers can provide very accurate alignment ( West, J. et al., 1996, Proc SPIE, Newport Beach, California ).
- corresponding anatomical feature points can be extracted from the images and used to compute the best alignment ( Maintz, J.B. Antione, et al., 1995 Computer Vision, Virtual Reality and Robotics in Medicine, pp. 219-228 ; Maguire, Jr., G., et al., 1991, IEEE Computer Graphics Applications, 11:20-29 ).
- This approach depends greatly on the ability to automatically and accurately extract reliable image features.
- methods of feature extraction such as intensity thresholding or edge detection do not work well on medical scans, due to non-linear gain fields and highly textured structures. Even manual identification of corresponding 3D anatomical points can be unreliable. Without the ability to accurately localize corresponding features in the images, alignment in this manner is difficult.
- a common method of registering MR and CT of the head involves extracting the skin (or skull) surfaces from both images, and aligning the 3D head models ( Jiang, H., et al., 1992 Proc. SPIE, 1808:196-213 ; Lemoine, D. et al., 1994, Proc. SPIE, 2164:46-56 ).
- the brain surface is typically used since the skull is not clearly visible in PET ( Pelizzari, C., et al., J Comput Assist. Tomogr., 1989, 13:20-26 ).
- the 3D models are then rigidly registered using surface-based registration techniques ( Ettinger, G., 1997, MIT Ph.D Thesis) .
- surface-based registration techniques Ettinger, G., 1997, MIT Ph.D Thesis.
- the success of such methods relies on the structures being accurately and consistently segmented across modalities and the surfaces having rich enough structure to be unambiguously registered.
- Voxel-based approaches to registration do not extract any features from the images, but use the intensities themselves to register the two images. Such approaches model the relationships between intensities of the two images when they are registered, and then search through the transformation space to find an alignment that best agrees with the model. Various intensity models are discussed, including correlation, mutual information. and joint intensity priors.
- Correlation is a measure commonly used to compare two images or regions of images for computer vision problems such as alignment or matching. Given the intensity values of two image patches stacked in the vectors u and v, the normalized correlation measure is the dot product of unit vectors in the directions of u and v: u • v / ⁇ u ⁇ ⁇ v ⁇
- correlation-based methods can be computed quite efficiently using convolution operators. Correlation is applicable when one expects a linear relationship between the intensities in the two images.
- normalized correlation provides some amount of robustness to lighting variation over a measure such as sum of square differences (SSD),
- SSD sum of square differences
- 2 The primary reason for acquiring more than one medical scan of a patient stems from the fact that each scan provides different information to the clinician. Therefore, two images that have a simple linear intensity relationship may be straightforward to register, but do not provide any additional information than one scan by itself. On the other hand, if the images are completely independent (e.g. no intensity relationship exists between them), then they cannot be registered using voxel-based methods. In general, there is some dependence between images of different modalities and each modality does provide additional information.
- an internal image is a rendering function R of underlying tissue properties, P(x), over positions x.
- An image of modality A could be represented as a function R A (P) and a registered image of modality B of the same patient would be another function, say R B (P).
- R A P
- R B P
- F F
- T * argmin T ⁇ ⁇ x ⁇ F R B P x - R A P x 2
- T is the transformation between the two sets of image coordinates.
- Van den Elsen et al. compute such a mapping that makes a CT image appear more like an MR, and then register the images using correlation ( van den Elsen, P., et al., 1994, "Visualization in Biomedical Computing," 1994 Proc SPIE, 2359:227-237 ).
- explicitly computing the function F that relates two imaging modalities is difficult and under-constrained.
- MI mutual information
- H U V H U + H V - H U V
- H(U) and H(V) are the entropies of the two variables
- H(U,V) is the joint entropy.
- H(U, V) H(U) + H(V), which implies the mutual information is zero.
- Derivatives of the entropies with respect to the pose parameters can be calculated and used to perform stochastic gradient ascent (Wells, 1996).
- West et al. compare many multi-modal registration techniques and find mutual information to be one of the most accurate across all pairs of modalities (West, 1996).
- Leventon et al. introduced an approach to multi-modal registration using statistical models derived from a training set of images ( Leventon, M., et al., 1998, Medical Image Computing and Computer-assisted Intervention ).
- the method involved building a prior model of the intensity relationship between the two scans being registered.
- the method requires a pair of registered training images of the same modalities as those to be registered in order to build the joint intensity model.
- To align a novel pair of images the likelihood of the two images given a certain pose based on our model by sampling the intensities at corresponding points is computed. This current hypothesis can be improved by ascending the log likelihood function. In essence, one computes a probabilistic estimate of the function F (that relates the two imaging modalities) based on intensity co-occurrence.
- F that relates the two imaging modalities
- the present invention is defined in claims 1 and 10 and overcomes problems and disadvantages associated with current strategies and designs and provides methods and apparatus for imaging using real-time or near real-time assessment and monitoring.
- Embodiments of the device are useful in a plurality of settings including surgery, clinical procedures, tissue assessment, diagnostic procedures, forensic, health monitoring and medical evaluations.
- One embodiment of the invention is directed to an imaging apparatus comprising integrating spatial, spectral and temporal features, and optionally other physiologic or relevant data, such as room temperature or ambient light, in a spectral and temporal multimodal imaging system for the evaluation of biological systems and stimuli and fusing one or more thermal images or other imaging modalities and hyperspectral data cube for assessment of biological processes.
- the integrated features may comprise two or more of visible or infrared hyperspectral images, visible or infrared brightfield images, thermal images, fluorescence images, Raman images and/or other relevant imaging modalities.
- the imaging apparatus may further comprise a specific UV, visible and/or infrared light source, and means for collecting two or more of visible or infrared hyperspectral images, visible or infrared brightfield images, thermal images, fluorescence images, Raman images, or standard video images.
- a specific UV, visible and/or infrared light source and means for collecting two or more of visible or infrared hyperspectral images, visible or infrared brightfield images, thermal images, fluorescence images, Raman images, or standard video images.
- Another embodiment of the invention is directed to methods for detecting a diseased condition comprising acquiring thermal images from a target, acquiring visible or infrared hyperspectral images from the same target, fusing the thermal images and visible or infrared hyperspectral images to analyze spatial distributions and/or feature determination of the target.
- Thermal images or hyperspectral images of the target and/or other data can be interlaced with a time dependent reference to determine changes which could influence and be correlated with results from other imaging modalities.
- Wavelengths can be selected to maximize diagnostic information for a specific tissue state or anticipated end diagnostic goal.
- the selection step involves performing multivariate image and spectral processing using multivariate image and spectral processing algorithms to extract information from the plurality of images and spectra for real-time or near real-time assessment.
- hyperspectral collection devices in a variety of wavelength regimens could be used simultaneously or sequentially or on an as needed basis.
- a visible hyperspectral images could be combined with a near infrared hyperspectral imager (plus or minus a broad band thermal camera) to provide combined information from both wavelength regions.
- tissue health mapping skin sebum level mapping; skin dryness, skin texture, skin feel or skin color mapping; skin damage detection and mapping (UV damage, frostbite, bums, cuts, abrasions) impact of cosmetics or other substances applied to the skin bruise age, force of impact, peripheral vascular disease diagnosis, extent, determination or regionalization of ischemia, varicose veins or hemorrhage detection, local detection and mapping, systemic infection detection, differentiation between viral, bacterial and fungal, and more specific identification, such as between gram negative and gram positive bacterial infection, venous occlusion increase in total hemoglobin, hematocrit, and change in deoxyhemoglobin/oxyhemoglobin ratio, differentiate between ischemia and hypoxia, burn depth and wound healing evaluation, non-invasive diagnosis of shock by imaging uninjured skin, hemorrhagic shock, septic shock, burn shock, changes in a dynamic system as a function of time or other parameter, vascular occlusion, vaso
- the present invention is directed to an imaging apparatus and methods for performing real-time or near real-time assessment and monitoring.
- Embodiments of the device are useful in a plurality of settings including surgery, clinical procedures, tissue assessment, diagnostic procedures, forensic, health monitoring and medical evaluations.
- ATR Automatic Target Recognition
- a technology developed within the military for automatic analysis and pattern recognition of signature data and gating of images relative to repetitive physiological parameters such as heart rate or respiration.
- an ATR is used to maintain image centering.
- the addition of such novel features as a common optical path optimizes data collection and minimizes processing requirements for a fused image.
- Image fusion between hyperspectral image datasets (also referred to as cubes) and other imaging modalities would allow for the extraction of more medically-relevant features and diagnostic information than any of the modalities alone.
- Addition of physiologically or medically related scalar variables to the data set of one or more hyperspectral imaging sets with or without formal image fusion being required allows for the enhancement of diagnostic algorithms.
- Thermal images or hyperspectral images may be used as an interlaced, time dependent reference to identify changes in the dynamic system. These changes may influence and be correlated with the results from all modalities.
- signal beam 110 is acquired and IR Beam-splitter 160 is placed in the path of signal beam 110 and accordingly, splits or diverts a portion of the infra-red signal beam 110 to infra-red focal plane array 120.
- 90/10 Visible Beam-splitter 130 is placed in signal beam 110 behind IR Beamsplitter 160. Visible Beam-splitter 130 splits the visible spectrum of signal beam 110 into two portions, wherein one portion is received by video camera 150, and the other is received by visible camera 140.
- One or multiple mirrors can be used for the beam splitter. This allows for the simultaneous acquisition of data from multiple modalities.
- Fusion of broad band infrared and hyperspectral imaging methodologies may be useful to devise algorithms for wavelength selection that maximize the diagnostic information for a specific tissue state; employ various multivariate image processing algorithms to extract information from the hyperspectral images and spectra and the thermal images for real-time or near real-time assessment of tissue state; devise image processing algorithms to assess the size and shape of abnormal tissue regions or domains; acquire sequential hyperspectral imaging cubes, thermal images or other physiological data to examine changes in a dynamic system as a function of time. Utility is extended by pairing more superficial data from hyperspectral imaging cubes with deeper perfusion data.
- a method for determining a total hematocrit comprises measuring a spatial distribution of oxyhemoglobin, deoxyhemoglobin and methemoglobin using hyperspectral imaging methods within the visible range or infrared range of the electro-magnetic spectrum; determining total hematocrit by calculating the area under the oxyhemoglobin, deoxyhemoglobin and methemoglobin spectrum or the intensity at their respective wavelengths; and pairing this with perfusion data from broad band thermal camera to permit assessment of total blood volume.
- the invention may be used to determine blood flow within a patient.
- a thermal camera demonstrates a state of perfusion and a hyperspectral camera demonstrates a state of oxygen extraction.
- Spatial characteristics relative to blood vessel assist diagnosis, i.e., like mottling visible in skin, and can see more or less heterogeneity under certain thermal, neurohumoral, physiological or pathological circumstances and in specific spatial patterns.
- the present invention may be used to determine a static or dynamic response of tissue or musculature when applying an active stimulus, such as a thermal change, drug injection, and electromagnetic or mechanical stimulus.
- Venous occlusion causes an increase in total hemoglobin, hematocrit, and an increase in deoxyhemoglobin/oxyhemoglobin ratio. The time course also varies with arterial occlusion and oxyhemoglobin/deoxyhemoglobin ratios.
- Artery and vein measurements can be used as internal calibration on a given picture for tissue levels of oxyhemoglobin/deoxyhemoglobin or thermal image or signature. Further, one can add thermal data by fusing thermal image just as one of the wavelengths in series in hyperspectral cube, i.e., an extra plane. Alternatively, thermal images can be fused to each wavelength image in series. Alternatively or in addition, generic processed analysis of thermal image (degree of variation) weights an image of each wavelength plane or impacts hyperspectral algorithmic analysis. Scalar data presenting physiologic or other relevant data can be also incorporated as described above.
- correction for a patient's motion is done by tissue stabilization or in the case of repetitive motions by gating image frames with a patient's cardiac or respiration cycle.
- Frames at the specific wavelengths selected for a particular diagnostic module are acquired at the same position in sequential cardiac cycles.
- the timing of the cardiac cycle is provided by electrocardiogram or cardiac ultrasound or other method.
- the respiratory variation is timed with an external sensor of respiration or with either the ventilating mechanism or a sensor mechanism of an artificial respirator.
- the present invention may be used to provide signatures of tissue viability or cancer. Markers of cell viability include hyperspectral signatures of oxyhemoglobin and deoxyhemoglobin or other chromaphores, thermal signatures, or fused signatures.
- the present invention is used to determine drug impact on vasodilitation, neurohumoral response, physiology, and pathology.
- the present invention is used to identify and classify a large variety of chemical species, for example, those other than oxyhemoglobin and deoxyhemoglobin.
- Sensor/image fusion permits additional data acquisition and incorporation into diagnostic assessment. This is facilitated by the use of multiple optical paths properly aligned to optimize registration. Inclusion of simultaneous recording of standard video camera images facilitates registration and provides additional data.
- False color imaging may be added real-time to facilitate the rapid understanding of the data presented to the surgeon or other user.
- On board CCD chip filters can be provided to increase processing speed.
- Input for physiologic monitoring systems, such as blood pressure, heart rate, peripheral oxygenation, can be added to the data acquired and fed into diagnostic algorithms.
- a recording system can be included to log the real-time or near real-time output of imaging systems.
- a split frame video display is used to show all modes simultaneously.
- parameters of wound healing may be displayed, such as: oxyhemoglobin or deoxyhemoglobin independently or as a ratio; signatures associated with rapidly dividing cells or dead cells, or particular types of cells; fluid content; hydration/dehydration or edema of tissue; or tissue performance.
- Tissue perfusion data provided by a thermal camera increases accuracy, delivers information about underlying vascular, beds, and/or provides data that will minimize the hyperspectral data processing requirements.
- Thermal images are used provide a baseline to track oxygen extraction or signature changes induced by tissue exposure.
- Increased heterogeneity and spatial features can be important in a diagnosis. For example, in vasoconstriction, it allows identification of areas that are less well perfused small micro areas that manifest as heterogeneity, to be diagnosed. Differences in oxyhemoglobin and deoxyhemoglobin ratios with spatial characteristics provide an image of micromottling. If vasodilated are more uniform, the patterns of vasoconstriction are helpful in diagnosis of infection in general and can aid in the identification of specific infection. Other patterns of heterogeneity are seen with cancers, and for example are associated with areas of increased metabolism or necrosis.
- the present invention may be used to analyze tissue health mapping; skin sebum level mapping; skin dryness, skin texture, skin feel or skin color mapping; skin damage detection and mapping (UV damage, frostbite, bums, cuts, abrasions) impact of cosmetics or other substances applied to the skin bruise age, force of impact, peripheral vascular disease diagnosis, extent, determination or regionalization of ischemia, varicose veins or hemorrhage detection, local detection and mapping, systemic infection detection, differentiation between viral, bacterial and fungal, and more specific identification, such as between gram negative and gram positive bacterial infection, venous occlusion increase in total hemoglobin, hematocrit, and change in deoxyhemoglobin/oxyhemoglobin ratio, differentiate between ischemia and hypoxia, burn depth and wound healing evaluation, non-invasive diagnosis of shock by imaging uninjured skin, hemorrhagic shock, septic shock, burn shock, changes in a dynamic system as a function of time or other parameter, vascular occlusion, va
- motion artifacts of the measurements are used to measure heterogeneity.
- a homogeneous tissue will continue to produce the same spectral signature, whereas heterogeneous tissue will demonstrate a variety of different signatures.
- Extraneous motion artifacts can be reduced by mechanical stabilization of field of regard, for example, by clamping tissue or region of interest. Even in the absence of discrete spatial information, the simple range of spectra obtained, demonstrating the heterogeneity per se can be useful. Dilation makes thermal imaging more uniform and constriction more heterogeneous. The latter correlates with ischemia, microvascular mottling or the edge of larger vessels. Different changes would be detected in association with tumors, immunologic response to infection or other stimulus.
- Motion artifacts are used as an indicator of inhomogeneous distributions of oxygenation and perfusion. Increases or decreases in artifacts not related to motion are used to assess heterogeneity of oxygenation and perfusion, and, hence, viability.
- the present invention may be used to look for signs of perfusion vs. viability. Integration of spatial and spectral and temporal features allows for the diagnosis of viability by creating a perfusion viability matrix. Because blood flow has a temporal component, the amount of blood that gets to tissue may be measured. This can be useful in the assessment of viability, cancer or infection.
- images are correlated with pain and drug response to provide pain feedback with infusion; other drug levels, to provide positive/negative feedback.
- Surface heterogeneity is correlated with infection, to provide determine time of infection, severity, systemic vs. local infection, type of organism, bacterial vs. viral, gram positive versus gram negative
- the present invention is also used to detect drug usage.
- the present invention may also be used for the assessment of metabolism and nutrition. Tissue structure and function, and hence signature, are influenced by nutritional status.
- the present invention may also be used to define adequacy of regional anesthesia or evaluation of pain response and the response to drug therapy with or without an automatic feedback component. It may also be used to identify and evaluate the presence of a drug substance and evaluate the initial response and/or therapeutic efficacy of a variety of pharmaceuticals. It can be used to track die agents and quantify their presence in association with blood flow parameters.
Description
- The invention is directed to an imaging apparatus and methods for performing assessment and monitoring with interpreted imaging. Embodiments of the invention are particularly useful in surgery, clinical procedures, tissue assessment, diagnostic procedures, health monitoring, and medical evaluations.
- Spectroscopy, whether it is visible, near infrared, infrared or Raman, is an enormously powerful tool for the analysis of biomedical samples. The medical community, however, has a definite preference for imaging methods, as exemplified by methods such as MRI and CT scanning as well as standard X-ray photography and ultrasound imaging. This is entirely understandable as many factors need to be taken into account for a physician to make a clinical diagnosis. Imaging methods potentially can provide far more information to a physician than their non-imaging counterparts. With this medical reality in mind, there has been considerable effort put into combining the power and versatility of imaging method with the specificity of spectroscopic methods.
- Xuegang et al. in SPIE 3545 pp. 574-577 (1998) teach multimodal imaging with image fusion, but without hyperspectral data.
- Near-infrared (near-IR) spectroscopy and spectroscopic imaging can measure the balance between oxygen delivery and tissue oxygen utilization by monitoring the hemoglobin oxygen saturation in tissues (Sowa, M.G. et al., 1998, Proc. SPIE 3252, pp. 199-207; Sowa, G.W. et al., 1999, Journal of Surgical Research, 86:62-29; Sow, G.W. et al., 1999, Journal of Biomedical Optics, 4:474-481; Mansfield, J.R., et al., 2000, International Society of Optical Engineers, 3920:99-197). For in-vivo human studies, the forearm or leg has been the investigational site for many of the noninvasive near-IR studies. Non-imaging near-IR applications have examined the local response of tissue to manipulations of blood flow (De-Blasi, R.A. et al., 1992, Adv. Exp. Med. Biol, 317:771-777). Clinically, there are situations where the regional variations in oxygenation saturation are of interest (Stranc, M.F. et al, 1998, British Journal of Plastic Surgery, 51:210-218). Near-IR imaging offers a means of accessing the spatial heterogeneity of the hemoglobin oxygenation saturation response to tissue perfusion. (Mansfield, J.R. et al., 1997, Analytical Chemistry, 69:3370-3374; Mansfield, J.R., et al., 1997, Computerized Medical Imaging and Graphics, 21:299-308; Salzer, R., et al., 2000, Fresenius Journal of Analytical Chemistry, 366:712-726; Shaw, R.A., et al., 2000, Journal of Molecular Structure (Theochem), 500:129-138; Shaw, R.A., et al., 2000, Journal of Inorganic Biochemistry, 79:285-293; Mansfield, J.R., et al., 1999, Proc. SPIE Int. Soc. Opt. Eng., 3597:222-233; Mansfield, J.R., et al., 1999, Applied Spectroscopy, 53:1323-1330; McIntosh, L.M., et al., 1999, Biospectroscopy, 5:265-275; Mansfield, R., et al., Vibrational Spectroscopy, 19:33-45; Payette, J.R., et al., 1999, American Clinical Laboratory, 18:4-6; Mansfield, J.R., et al., 1998, IEEE Transactions on Medical Imaging, 6:1011-1018
- Non-invasive monitoring of hemoglobin oxygenation exploits the differential absorption of HbO2 and Hb, along with the fact that near-IR radiation can penetrate relatively deeply into tissues. Pulse oximetry routinely supplies a noninvasive measure of arterial hemoglobin oxygenation based on the differential red-visible and near infrared absorption of Hb and HbO2. Visible/near-IR multispectral imaging permits the regional variations in tissue perfusion to be mapped on macro and micro scale. Unlike infrared thermography, hyperspectral imaging alone does not map the thermal emission of the tissues. Instead, this imaging method relies on the differential absorption of light by a chromophore, such as, Hb and HbO2, resulting in differences in the wavelength dependence of the tissue reflectance depending on the hemoglobin oxygen saturation of the tissue. (Sowa, M.G., et al., 1997, Applied Spectroscopy, 51:143-152; Leventon, M., 2000, MIT Ph.D. Thesis)
- Spectroscopic imaging methodologies and data are becoming increasingly common in analytical laboratories, whether it be magnetic resonance (MRI), mid-IR, Raman, fluorescence and optical microscopy, or near-IR/visible-based imaging. However, the volume of information contained in spectroscopic images can make standard data processing techniques cumbersome. Furthermore, there are few techniques that can demarcate which regions of a spectroscopic image contain similar spectra without a priori knowledge of either the spectral data or the sample's composition. The objective of analyzing spectroscopic images is not only to determine what the spectrum is at any particular pixel in the sample, but also to determine which regions of the sample contain similar spectra; i.e., what regions of the sample contain chemically related compounds. Multivariate analysis methodologies can be used to determine both the spectral and spatial characteristics of a sample within a spectroscopic imaging data set. These techniques can also be used to analyze variations in the temporal shape of a time series of images either derived for extracted from a time series of spectroscopic images.
- There are few techniques that can demarcate which regions of a sample contain similar substances without a priori knowledge of the sample's composition. Spectroscopic imaging provides the specificity of spectroscopy while at the same time relaying spatial information by providing images of the sample that convey some chemical meaning. Usually the objective in analyzing heterogeneous systems is to identify not only the components present in the system, but their spatial distribution. The true power of this technique relative to traditional imaging methods lies in its inherent multivariate nature. Spatial relationships among many parameters can be assessed simultaneously. Thus, the chemical heterogeneity or regional similarity within a sample is captured in a high dimensional representation which can be projected onto a number of meaningful low dimensional easily interpretable representations which typically comprise a set of composite images each having a specific meaning.
- While it is now clear that both spectroscopy and spectroscopic imaging can play roles in providing medically relevant information, the raw spectral or imaging measurement seldom reveals directly the property of clinical interest. For example using spectroscopy, one cannot easily determine whether the tissue is cancerous, or determine blood glucose concentrations and the adequacy of tissue perfusion. Instead, pattern recognition algorithms, clustering methods, regression and other theoretical methods provide the means to distill diagnostic information from the original analytical measurements.
- There are however various methods for the collection of spectroscopic images. In all such cases, the result of a spectroscopic imaging experiment is something termed a spectral image cube, spectroscopic imaging data cube or just hypercube. This is a three dimensional array of data, consisting of two spatial dimensions (the imaging component), and one spectral dimension. It can be thought of as an array of spatially resolved individual spectra, with every pixel in the first image consisting of an entire spectrum, or as a series of spectrally resolved images. In either representation, the 3D data cube can be treated as a single entity containing enormous amounts of spatial and spectral information about the sample from which it was acquired.
- As an extension of the three dimensional array acquired in a spectroscopic imaging experiment, one can collect data cubes as a function of additional parameters such as time, temperature or pH. Numerous algorithms can be used to analyze these multi-dimensional data sets so that chemical and spectral variations can be studied as additional parameters. However, taken together, they can allow one to more fully understand the variations in the data. This can be done in a gated or sequential fashion.
- Multi-modal image fusion, or image registration, is an important problem frequently addressed in medical image analysis. Registration is the process of aligning data that arise from different sources into one consistent coordinate frame. For example, various tissues appear more clearly in different types of imaging methods. Soft tissue, for example, is imaged well in MR scans, while bone is more easily discernible in CT scans. Blood vessels are often highlighted better in an MR angiogram than in a standard MR scan. Multiple scans of the same patient will generally be unregistered when acquired, as the patient may be in different positions in each scanner, and each scanner has its own coordinate system. In order to fuse the information from all scans into one coherent frame, the scans must be registered. The very reason why multiple scans are useful is what makes the registration process difficult. As each modality images tissue differently and has its own artifacts and noise characteristics, accurately modeling the intensity relationship between the scans, and subsequently aligning them, is difficult.
- The registration of two images consists of finding the transformation that best maps one image into the other. If I1 and I2 are two images of the same tissue and T is the correct transformation, then the voxel I1(x) corresponds to the same position in the sample as the voxel I2(T(x)). In the simplest case, T is a rigid transformation consisting of three degrees of freedom of rotation and three degrees of freedom of translation. The need for rigid registration arises primarily from the patient being in different positions in the scanning devices used to image the anatomy. The information from all the images is best used when presented in one unified coordinate system. Without such image fusion, the clinician must mentally relate the information from the disparate coordinate frames.
- One method of aligning the two images is to define an intermediate, patient-centered coordinate system, instead of trying to directly register the images to one another. An example of a patient-centered reference frame is the use of fiducial markers attached to a patient throughout the various image acquisitions. The fiducial markers define a coordinate system specific to the patient, independent of the scanner or choice of imaging modality. If the markers remain fixed and can be accurately localized in all the images, then the volumes can be registered by computing the best alignment of the corresponding fiducials (Horn, B.K.P., 1987, Journal of the Optical Society of America A, 4:629-642; Mandava, V.R., et al., Proc SPIE, 1992, 1652:271-282; Haralick, R.M., et al., 1993, Computer and Robot Vision ). The main drawback of this method is that the markers must remain attached to the patient at the same positions throughout all image acquisitions. For applications such as change detection over months or years, this registration method is not suitable. Fiducial registration is typically used as ground-truth to evaluate the accuracy of other methods as careful placement and localization of the markers can provide very accurate alignment (West, J. et al., 1996, Proc SPIE, Newport Beach, California).
- When fiducial markers are not available to define the patient coordinate frame, corresponding anatomical feature points can be extracted from the images and used to compute the best alignment (Maintz, J.B. Antione, et al., 1995 Computer Vision, Virtual Reality and Robotics in Medicine, pp. 219-228; Maguire, Jr., G., et al., 1991, IEEE Computer Graphics Applications, 11:20-29). This approach depends greatly on the ability to automatically and accurately extract reliable image features. In general, methods of feature extraction such as intensity thresholding or edge detection do not work well on medical scans, due to non-linear gain fields and highly textured structures. Even manual identification of corresponding 3D anatomical points can be unreliable. Without the ability to accurately localize corresponding features in the images, alignment in this manner is difficult.
- Instead of localizing feature points in the images, richer structures such as object surfaces can be extracted and used as a basis of registration. A common method of registering MR and CT of the head involves extracting the skin (or skull) surfaces from both images, and aligning the 3D head models (Jiang, H., et al., 1992 Proc. SPIE, 1808:196-213; Lemoine, D. et al., 1994, Proc. SPIE, 2164:46-56). For PET/MR registration, the brain surface is typically used since the skull is not clearly visible in PET (Pelizzari, C., et al., J Comput Assist. Tomogr., 1989, 13:20-26). The 3D models are then rigidly registered using surface-based registration techniques (Ettinger, G., 1997, MIT Ph.D Thesis). The success of such methods relies on the structures being accurately and consistently segmented across modalities and the surfaces having rich enough structure to be unambiguously registered.
- Voxel-based approaches to registration do not extract any features from the images, but use the intensities themselves to register the two images. Such approaches model the relationships between intensities of the two images when they are registered, and then search through the transformation space to find an alignment that best agrees with the model. Various intensity models are discussed, including correlation, mutual information. and joint intensity priors.
- Correlation is a measure commonly used to compare two images or regions of images for computer vision problems such as alignment or matching. Given the intensity values of two image patches stacked in the vectors u and v, the normalized correlation measure is the dot product of unit vectors in the directions of u and v:

- An advantage of correlation-based methods is that they can be computed quite efficiently using convolution operators. Correlation is applicable when one expects a linear relationship between the intensities in the two images. In computer vision problems, normalized correlation provides some amount of robustness to lighting variation over a measure such as sum of square differences (SSD), || u - v ||2. The primary reason for acquiring more than one medical scan of a patient stems from the fact that each scan provides different information to the clinician. Therefore, two images that have a simple linear intensity relationship may be straightforward to register, but do not provide any additional information than one scan by itself. On the other hand, if the images are completely independent (e.g. no intensity relationship exists between them), then they cannot be registered using voxel-based methods. In general, there is some dependence between images of different modalities and each modality does provide additional information.
- One simplified model of the medical imaging process is that an internal image is a rendering function R of underlying tissue properties, P(x), over positions x. An image of modality A could be represented as a function RA(P) and a registered image of modality B of the same patient would be another function, say RB(P). Suppose a function F(×) could be computed relating the two rendering functions such that the following is true (with the possible addition of some Gaussian noise, N):

The function F would predict the intensity at a point in Image A given the intensity at the corresponding point in Image B. Such a function could be used to align a pair of images that are initially in different coordinate systems using SSD:
where T is the transformation between the two sets of image coordinates. Van den Elsen et al. compute such a mapping that makes a CT image appear more like an MR, and then register the images using correlation (van den Elsen, P., et al., 1994, "Visualization in Biomedical Computing," 1994 Proc SPIE, 2359:227-237). In general, explicitly computing the function F that relates two imaging modalities is difficult and under-constrained. - Maximization of mutual information (MI) is a general approach applicable to a wide range of multi-modality registration applications (Bell, A.J., et al., 1995 Advances in Neural Information Processing 7; Collignon, D., et al., 1995, First Conf. on Computer Vision, Virtual Reality and Robotics in Medicine Springer ; Maes, F. et al, 1996, Mathematical Methods in Biomedical Image Analysis ; Wells, W.M., et al., 1996, Medical Image Analysis, 1(1):35-51). One of the strengths of using mutual information is that MI does not use any prior information about the relationship between joint intensity distributions. While mutual information does not explicitly model the function F that relates the two imaging modalities, it assumes that when the images are aligned, each image should explain the other better than when the images are not aligned.
- Given two random variables U and V, mutual information is defined as (Bell, 1995):

where H(U) and H(V) are the entropies of the two variables, and H(U,V) is the joint entropy. The entropy of a discrete random variable is defined as:
where Pu(u) is the probability mass function associated with U. Similarly, the expression for joint entropy entropy operates over the joint PDF:
- When U and V are independent, H(U, V) = H(U) + H(V), which implies the mutual information is zero. When there is a one-to-one functional relationship between U and V, (i.e. they are completely dependent), the mutual information is maximized as:

- To operate on images over a transformation, we consider the two images, I1(x) and I2(x) to be random variables under a spatial parameterization, x. We seek to find the value of the transformation T that maximizes the mutual information (Wells, 1996):


The entropies of the two images encourage transformations that project I1 onto complex parts of I2. The third term, the (negative) joint entropy of I1 and I2, takes on large values when X explains Y well. Derivatives of the entropies with respect to the pose parameters can be calculated and used to perform stochastic gradient ascent (Wells, 1996). West et al. compare many multi-modal registration techniques and find mutual information to be one of the most accurate across all pairs of modalities (West, 1996). - Leventon et al. introduced an approach to multi-modal registration using statistical models derived from a training set of images (Leventon, M., et al., 1998, Medical Image Computing and Computer-assisted Intervention ). The method involved building a prior model of the intensity relationship between the two scans being registered. The method requires a pair of registered training images of the same modalities as those to be registered in order to build the joint intensity model. To align a novel pair of images, the likelihood of the two images given a certain pose based on our model by sampling the intensities at corresponding points is computed. This current hypothesis can be improved by ascending the log likelihood function. In essence, one computes a probabilistic estimate of the function F (that relates the two imaging modalities) based on intensity co-occurrence. To align the novel images, the pose is found that maximizes the likelihood that those images arose from the same relation F.
- Building a joint-intensity model does require having access to a registered pair of images of the same modality and approximately the same coverage as the novel pair to be registered. Mutual information approaches do not need to draw upon previously registered scans. However, when this information is available, the prior joint intensity model provides the registration algorithm with additional guidance which results in convergence on the correct alignment more quickly, more reliably and from more remote initial starting points.
- The present invention is defined in claims 1 and 10 and overcomes problems and disadvantages associated with current strategies and designs and provides methods and apparatus for imaging using real-time or near real-time assessment and monitoring. Embodiments of the device are useful in a plurality of settings including surgery, clinical procedures, tissue assessment, diagnostic procedures, forensic, health monitoring and medical evaluations.
- One embodiment of the invention is directed to an imaging apparatus comprising integrating spatial, spectral and temporal features, and optionally other physiologic or relevant data, such as room temperature or ambient light, in a spectral and temporal multimodal imaging system for the evaluation of biological systems and stimuli and fusing one or more thermal images or other imaging modalities and hyperspectral data cube for assessment of biological processes. The integrated features may comprise two or more of visible or infrared hyperspectral images, visible or infrared brightfield images, thermal images, fluorescence images, Raman images and/or other relevant imaging modalities. The imaging apparatus may further comprise a specific UV, visible and/or infrared light source, and means for collecting two or more of visible or infrared hyperspectral images, visible or infrared brightfield images, thermal images, fluorescence images, Raman images, or standard video images.
- Another embodiment of the invention is directed to methods for detecting a diseased condition comprising acquiring thermal images from a target, acquiring visible or infrared hyperspectral images from the same target, fusing the thermal images and visible or infrared hyperspectral images to analyze spatial distributions and/or feature determination of the target. Thermal images or hyperspectral images of the target and/or other data can be interlaced with a time dependent reference to determine changes which could influence and be correlated with results from other imaging modalities. Wavelengths can be selected to maximize diagnostic information for a specific tissue state or anticipated end diagnostic goal. The selection step involves performing multivariate image and spectral processing using multivariate image and spectral processing algorithms to extract information from the plurality of images and spectra for real-time or near real-time assessment. Multiple hyperspectral collection devices in a variety of wavelength regimens could be used simultaneously or sequentially or on an as needed basis. For instance a visible hyperspectral images could be combined with a near infrared hyperspectral imager (plus or minus a broad band thermal camera) to provide combined information from both wavelength regions. In this way, one can analyze tissue health mapping; skin sebum level mapping; skin dryness, skin texture, skin feel or skin color mapping; skin damage detection and mapping (UV damage, frostbite, bums, cuts, abrasions) impact of cosmetics or other substances applied to the skin bruise age, force of impact, peripheral vascular disease diagnosis, extent, determination or regionalization of ischemia, varicose veins or hemorrhage detection, local detection and mapping, systemic infection detection, differentiation between viral, bacterial and fungal, and more specific identification, such as between gram negative and gram positive bacterial infection, venous occlusion increase in total hemoglobin, hematocrit, and change in deoxyhemoglobin/oxyhemoglobin ratio, differentiate between ischemia and hypoxia, burn depth and wound healing evaluation, non-invasive diagnosis of shock by imaging uninjured skin, hemorrhagic shock, septic shock, burn shock, changes in a dynamic system as a function of time or other parameter, vascular occlusion, vaso-dilation and vaso-constriction changes related to the presence of cancer in primary tissue or lymph nodes, either surface or subsurface, changes related to a specific chemical, mechanical, thermal, pharmacological or physiological stimulus. Different levels of microvascular constriction and relaxation lead to different ratios of oxyhemoglobin/deoxyhemoglobin, to tissue perfusion, tissue abnormality, disease state or diagnostic condition, total hematocrit, differentiate differences in reperfusion state following occlusion where oxygenation levels may remain low although there is good perfusion.
- Other technical advantages of the present invention are set forth in or will be apparent from drawings and the description of the invention which follows, or may be learned from the practice of the invention.
-
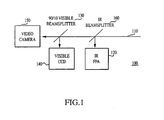
- Figure 1
- A schematic diagram of a common optical path shared by multiple modalities.
- As embodied and broadly described herein, the present invention is directed to an imaging apparatus and methods for performing real-time or near real-time assessment and monitoring. Embodiments of the device are useful in a plurality of settings including surgery, clinical procedures, tissue assessment, diagnostic procedures, forensic, health monitoring and medical evaluations.
- It has been surprisingly found that the pairing of hyperspectral imaging data with data obtained from other single-image imaging methodologies, (examples of which include thermal imaging or fluorescence imaging) provides a sensitive and accurate assessment measure of a physiological condition. This is particularly appealing in terms of tissue assessment in that both thermal perfusion assessments and various multi-modal tissue signatures which incorporate things such as oxyhemoglobin/deoxyhemoglobin ratios and other indices of tissue physiology, pathology or function are interrelated. By fusing data from multiple collection devices and multiple spectral modalities, such as a broad band thermal camera and one or more hyperspectral cameras, or a single imaging device that can respond in multiple discreet bands, data can be obtained to provide medically relevant information. Additionally, pixel to pixel registration for fusion will benefit from methodologies designed to permit this. Included among these technologies are Automatic Target Recognition (ATR), a technology developed within the military for automatic analysis and pattern recognition of signature data, and gating of images relative to repetitive physiological parameters such as heart rate or respiration. In an embodiment of the invention, an ATR is used to maintain image centering. The addition of such novel features as a common optical path optimizes data collection and minimizes processing requirements for a fused image. Image fusion between hyperspectral image datasets (also referred to as cubes) and other imaging modalities would allow for the extraction of more medically-relevant features and diagnostic information than any of the modalities alone. Addition of physiologically or medically related scalar variables to the data set of one or more hyperspectral imaging sets with or without formal image fusion being required allows for the enhancement of diagnostic algorithms.
- Incorporation of a stable broad band light source with the ability to be filtered to provide illumination, either singly or in multiples of different spectral regions, an electronically tunable imaging spectrometer, a video camera, a CCD, and a parfocal infrared focal plane array or other camera with the same field of view as the CCD.
- Image fusion using beam splitters for the simultaneous acquisition of multiple discreet images incorporating spectral data, each discreet image providing a unique information set, and these various information sets are combined in a variety of manners to allow for enhanced and more unique signatures. Enhancement results in a broader and more discernible identification methodology. If desired, data analysis can be enhanced by triangulation with two cameras. Polarizing imagers may be used as desired to enhance signatures for various targets. Temporal analysis is included in a signature. Temporal alterations or heterogeneity, with or without a meaningful pattern, is acquired with or without gating.
- Thermal images or hyperspectral images, either singly or in combination with other modal images, may be used as an interlaced, time dependent reference to identify changes in the dynamic system. These changes may influence and be correlated with the results from all modalities.
- Referring to
Figure 1 ,signal beam 110 is acquired and IR Beam-splitter 160 is placed in the path ofsignal beam 110 and accordingly, splits or diverts a portion of the infra-red signal beam 110 to infra-redfocal plane array 120. 90/10 Visible Beam-splitter 130 is placed insignal beam 110 behindIR Beamsplitter 160. Visible Beam-splitter 130 splits the visible spectrum ofsignal beam 110 into two portions, wherein one portion is received byvideo camera 150, and the other is received byvisible camera 140. One or multiple mirrors can be used for the beam splitter. This allows for the simultaneous acquisition of data from multiple modalities. - Fusion of broad band infrared and hyperspectral imaging methodologies may be useful to devise algorithms for wavelength selection that maximize the diagnostic information for a specific tissue state; employ various multivariate image processing algorithms to extract information from the hyperspectral images and spectra and the thermal images for real-time or near real-time assessment of tissue state; devise image processing algorithms to assess the size and shape of abnormal tissue regions or domains; acquire sequential hyperspectral imaging cubes, thermal images or other physiological data to examine changes in a dynamic system as a function of time. Utility is extended by pairing more superficial data from hyperspectral imaging cubes with deeper perfusion data.
- According to an embodiment of the present invention, a method for determining a total hematocrit comprises measuring a spatial distribution of oxyhemoglobin, deoxyhemoglobin and methemoglobin using hyperspectral imaging methods within the visible range or infrared range of the electro-magnetic spectrum; determining total hematocrit by calculating the area under the oxyhemoglobin, deoxyhemoglobin and methemoglobin spectrum or the intensity at their respective wavelengths; and pairing this with perfusion data from broad band thermal camera to permit assessment of total blood volume.
- Alternatively, the invention may be used to determine blood flow within a patient. For example, a thermal camera demonstrates a state of perfusion and a hyperspectral camera demonstrates a state of oxygen extraction. Spatial characteristics relative to blood vessel assist diagnosis, i.e., like mottling visible in skin, and can see more or less heterogeneity under certain thermal, neurohumoral, physiological or pathological circumstances and in specific spatial patterns. In addition, the present invention may be used to determine a static or dynamic response of tissue or musculature when applying an active stimulus, such as a thermal change, drug injection, and electromagnetic or mechanical stimulus.
- Different levels of microvascular constriction lead to different ratios of blood oxy/deoxygenation or signature of tissue vs. artery vs. vein. In addition to heme and heme-containing or related components, many chemicals and substances can be identified including, for example, glucose, enzymes and metabolic effluents, and moisture content and distribution can be determined and calibrated with artery verses vein. Arterial occlusion causes a decrease in perfusion and total hemoglobin and increase in deoxyhemoglobin/oxyhemoglobin ratio. The time course will be useful as well as including both first and second derivatives. Arterial reperfusion causes increase in perfusion and total hemoglobin. This increase in perfusion, leads to decreased differences between artery and tissue and vein for both hemoglobin saturation and thermal differences. This is due to a decreased resistance to flow at the arteriolar level. Venous occlusion causes an increase in total hemoglobin, hematocrit, and an increase in deoxyhemoglobin/oxyhemoglobin ratio. The time course also varies with arterial occlusion and oxyhemoglobin/deoxyhemoglobin ratios.
- Artery and vein measurements can be used as internal calibration on a given picture for tissue levels of oxyhemoglobin/deoxyhemoglobin or thermal image or signature. Further, one can add thermal data by fusing thermal image just as one of the wavelengths in series in hyperspectral cube, i.e., an extra plane. Alternatively, thermal images can be fused to each wavelength image in series. Alternatively or in addition, generic processed analysis of thermal image (degree of variation) weights an image of each wavelength plane or impacts hyperspectral algorithmic analysis. Scalar data presenting physiologic or other relevant data can be also incorporated as described above.
- According to an embodiment of the present invention, correction for a patient's motion is done by tissue stabilization or in the case of repetitive motions by gating image frames with a patient's cardiac or respiration cycle. Frames at the specific wavelengths selected for a particular diagnostic module are acquired at the same position in sequential cardiac cycles. The timing of the cardiac cycle is provided by electrocardiogram or cardiac ultrasound or other method. The respiratory variation is timed with an external sensor of respiration or with either the ventilating mechanism or a sensor mechanism of an artificial respirator.
- The present invention may be used to provide signatures of tissue viability or cancer. Markers of cell viability include hyperspectral signatures of oxyhemoglobin and deoxyhemoglobin or other chromaphores, thermal signatures, or fused signatures. The present invention is used to determine drug impact on vasodilitation, neurohumoral response, physiology, and pathology. The present invention is used to identify and classify a large variety of chemical species, for example, those other than oxyhemoglobin and deoxyhemoglobin. Sensor/image fusion permits additional data acquisition and incorporation into diagnostic assessment. This is facilitated by the use of multiple optical paths properly aligned to optimize registration. Inclusion of simultaneous recording of standard video camera images facilitates registration and provides additional data. False color imaging may be added real-time to facilitate the rapid understanding of the data presented to the surgeon or other user. On board CCD chip filters can be provided to increase processing speed. Input for physiologic monitoring systems, such as blood pressure, heart rate, peripheral oxygenation, can be added to the data acquired and fed into diagnostic algorithms. A recording system can be included to log the real-time or near real-time output of imaging systems.
- In an embodiment of the present invention, a split frame video display is used to show all modes simultaneously. For example, parameters of wound healing may be displayed, such as: oxyhemoglobin or deoxyhemoglobin independently or as a ratio; signatures associated with rapidly dividing cells or dead cells, or particular types of cells; fluid content; hydration/dehydration or edema of tissue; or tissue performance. Tissue perfusion data provided by a thermal camera increases accuracy, delivers information about underlying vascular, beds, and/or provides data that will minimize the hyperspectral data processing requirements. Thermal images are used provide a baseline to track oxygen extraction or signature changes induced by tissue exposure.
- Increased heterogeneity and spatial features can be important in a diagnosis. For example, in vasoconstriction, it allows identification of areas that are less well perfused small micro areas that manifest as heterogeneity, to be diagnosed. Differences in oxyhemoglobin and deoxyhemoglobin ratios with spatial characteristics provide an image of micromottling. If vasodilated are more uniform, the patterns of vasoconstriction are helpful in diagnosis of infection in general and can aid in the identification of specific infection. Other patterns of heterogeneity are seen with cancers, and for example are associated with areas of increased metabolism or necrosis.
- The present invention may be used to analyze tissue health mapping; skin sebum level mapping; skin dryness, skin texture, skin feel or skin color mapping; skin damage detection and mapping (UV damage, frostbite, bums, cuts, abrasions) impact of cosmetics or other substances applied to the skin bruise age, force of impact, peripheral vascular disease diagnosis, extent, determination or regionalization of ischemia, varicose veins or hemorrhage detection, local detection and mapping, systemic infection detection, differentiation between viral, bacterial and fungal, and more specific identification, such as between gram negative and gram positive bacterial infection, venous occlusion increase in total hemoglobin, hematocrit, and change in deoxyhemoglobin/oxyhemoglobin ratio, differentiate between ischemia and hypoxia, burn depth and wound healing evaluation, non-invasive diagnosis of shock by imaging uninjured skin, hemorrhagic shock, septic shock, burn shock, changes in a dynamic system as a function of time or other parameter, vascular occlusion, vaso-dilation and vaso-constriction changes related to the presence of cancer in primary tissue or lymph nodes, either surface or subsurface, changes related to a specific chemical, mechanical, thermal, pharmacological or physiological stimulus. Different levels of microvascular constriction and relaxation lead to different ratios of oxyhemoglobin/deoxyhemoglobin, to tissue perfusion, tissue abnormality, disease state or diagnostic condition, total hematocrit, differentiate differences in reperfusion state following occlusion where oxygenation levels may remain low although there is good perfusion.
- In an embodiment of the present invention, motion artifacts of the measurements are used to measure heterogeneity. With motion, a homogeneous tissue will continue to produce the same spectral signature, whereas heterogeneous tissue will demonstrate a variety of different signatures. Extraneous motion artifacts can be reduced by mechanical stabilization of field of regard, for example, by clamping tissue or region of interest. Even in the absence of discrete spatial information, the simple range of spectra obtained, demonstrating the heterogeneity per se can be useful. Dilation makes thermal imaging more uniform and constriction more heterogeneous. The latter correlates with ischemia, microvascular mottling or the edge of larger vessels. Different changes would be detected in association with tumors, immunologic response to infection or other stimulus. Spatial patterns will vary with pathological or physiological differences. Motion artifacts are used as an indicator of inhomogeneous distributions of oxygenation and perfusion. Increases or decreases in artifacts not related to motion are used to assess heterogeneity of oxygenation and perfusion, and, hence, viability.
- The present invention may be used to look for signs of perfusion vs. viability. Integration of spatial and spectral and temporal features allows for the diagnosis of viability by creating a perfusion viability matrix. Because blood flow has a temporal component, the amount of blood that gets to tissue may be measured. This can be useful in the assessment of viability, cancer or infection.
- In an embodiment of the present invention, images are correlated with pain and drug response to provide pain feedback with infusion; other drug levels, to provide positive/negative feedback. Surface heterogeneity is correlated with infection, to provide determine time of infection, severity, systemic vs. local infection, type of organism, bacterial vs. viral, gram positive versus gram negative The present invention is also used to detect drug usage.
- The present invention may also be used for the assessment of metabolism and nutrition. Tissue structure and function, and hence signature, are influenced by nutritional status. The present invention may also be used to define adequacy of regional anesthesia or evaluation of pain response and the response to drug therapy with or without an automatic feedback component. It may also be used to identify and evaluate the presence of a drug substance and evaluate the initial response and/or therapeutic efficacy of a variety of pharmaceuticals. It can be used to track die agents and quantify their presence in association with blood flow parameters.
- Other embodiments and uses of the invention will be apparent to those skilled in the art from consideration of the specification and practice of the invention disclosed herein. Reference is made to
U.S. Patent Nos. 5,441,053 ,5,553,614 ,5,377,003 ,5,528,368 ,6,937,885 ,6,741,884 , andWO 99/22640 WO 00/13578
Claims (19)
- A multimodal imaging apparatus for examining changes in a dynamic system as a function of time comprising:a first collection device for collecting spectral data of a sample and for creating a hyperspectral data cube;a means for registering and analyzing multiple hyperspectral data cubes created over time;one or more additional collection devices for collecting thermal image data or other image modality data from said sample; anda means for fusing said multiple hyperspectral data cubes created over time with said thermal image data or other image modality datawherein the multiple hyperspectral data cubes comprise three dimensional arrays of data comprising data from two spatial dimensions and one spectral dimension.
- The imaging apparatus of claim 1, wherein the other image modality data comprise data from one or more of visible or infrared hyperspectral images, visible or infrared brightfield images, fluorescence images, Raman images, and a combination thereof.
- The imaging apparatus of claim 1 or 2, further comprising
a means for integration of physiologic data with said multiple hyperspectral data cubes; and/or
a means for integration of calibration data with said multiple hyperspectral data cubes. - The imaging apparatus of any of claims 1 to 3, further comprising a light source and, preferably, wherein the light source is a visible light source or an infrared light source.
- The imaging apparatus of claim 4, wherein the light source emits a signal beam at one or more predetermined wavelengths and, preferably, wherein the imaging apparatus further comprises one or more beam splitters for splitting said signal beam into a plurality of wavelengths.
- The imaging apparatus of any of claims 1 to 5, further comprising a collection optic that is an endoscope.
- The imaging apparatus of any of claims 1 to 6, further comprising one or more inputs for signals from one or more instruments monitoring one or more biological functions of a patient and, preferably, wherein the one or more biological functions is selected from the group consisting of respiration, cardiac cycle, muscle contraction, heart rate, and a combination thereof.
- The imaging apparatus of any of claims 1 to 7, further comprising:a video camera; and/oran on-board CCD chip filter, processing electronics to perform data operations prior to transmission of signal, and one or more inputs for physiological monitoring systems; and/orone or more devices for image fusion and alignment, means for aligning optical paths, a video display for displaying data and for camera alignment and aiming, and a storage system for recording and logging real-time or near real-time output.
- The imaging apparatus of any of claims 1 to 8, further comprising:means for stabilizing and integrating said data and said image modality data in a temporally and geometrically dynamic environment; and/oran image registration device to maintain image alignment; and/ora reference frame device; and/ora tracked imaging device comprising a means of creating a unified spatial mosaic of hyperspectral image cubes taken at one or more locations or times.
- A method for analyzing a sample comprising the steps of:collecting multiple hyperspectral data cubes over time, each respective hyperspectral data cube in the multiple hyperspectral data cubes comprising a plurality of spectral images of said sample;registering each respective spectral image in the plurality of spectral images; andregistering one or more thermal images of said sample with said multiple hyperspectral data cubes taken over time,wherein the multiple hyperspectral data cubes comprise three dimensional arrays of data comprising data from two spatial dimensions and one spectral dimension.
- The method of claim 10, wherein the step of registering one or more thermal images of said sample with said multiple hyperspectral data cubes comprises registering a single thermal image with each respective hyperspectral data cube in the plurality of hyperspectral data cubes.
- The method claim 10, wherein the step of registering one or more thermal images of said sample with said multiple hyperspectral data cubes comprises registering a thermal image with each respective spectral image in the plurality of spectral images.
- The method of any of claims 10 to 12, further comprising the step of selecting a wavelength to obtain diagnostic information of said sample and, preferably, wherein the selection step is performed by one or more multivariate image and spectral processing algorithms to extract information from the plurality of spectral images for real-time or near real-time assessment.
- The method of any of claims 10 to 13 wherein the sample is a biological sample and comprises skin, an organ, a tissue or combination thereof.
- The method of any of claims 10 to 14, wherein total hematocrit is determined by measuring a spatial distribution of oxyhemoglobin, deoxyhemoglobin and methemoglobin of said sample and, preferably, wherein total blood volume is determined by further measuring perfusion data.
- The method of any of claims 13 to 15, further comprising the step of gating each respective spectral image in the plurality of spectral images and the corresponding one or more thermal images to a biological function and, preferably, wherein the biological function is selected from the group consisting of cardiac cycle, breathing, pulse, muscle contraction, and a combination thereof.
- The method of any of claims 10 to 16 wherein the method further comprises identifying a chemical species other than hemoglobin.
- The method of any of claims 10 to 17, further comprising the step of
using one or more automatic feature extraction techniques to localize landmarks in the multiple hyperspectral data cubes. - The method of claim 10, further comprising the step of registering a three dimensional spatial medical image with said multiple hyperspectral data cubes taken over time and, preferably, wherein the three dimensional spatial medical image is selected from the group consisting of MR, CT, PET, SPECT, ultrasound, and combinations thereof.
Applications Claiming Priority (3)
| Application Number | Priority Date | Filing Date | Title |
|---|---|---|---|
| US14206799P | 1999-07-02 | 1999-07-02 | |
| US142067P | 1999-07-02 | ||
| PCT/US2000/018221 WO2001001854A2 (en) | 1999-07-02 | 2000-07-03 | Integrated imaging apparatus |
Publications (2)
| Publication Number | Publication Date |
|---|---|
| EP1196081A2 EP1196081A2 (en) | 2002-04-17 |
| EP1196081B1 true EP1196081B1 (en) | 2013-08-21 |
Family
ID=22498432
Family Applications (1)
| Application Number | Title | Priority Date | Filing Date |
|---|---|---|---|
| EP00943361.6A Expired - Lifetime EP1196081B1 (en) | 1999-07-02 | 2000-07-03 | Integrated imaging apparatus |
Country Status (6)
| Country | Link |
|---|---|
| US (2) | US6640130B1 (en) |
| EP (1) | EP1196081B1 (en) |
| JP (1) | JP4849755B2 (en) |
| AU (1) | AU5783900A (en) |
| CA (1) | CA2374040C (en) |
| WO (1) | WO2001001854A2 (en) |
Cited By (2)
| Publication number | Priority date | Publication date | Assignee | Title |
|---|---|---|---|---|
| WO2015117084A1 (en) * | 2014-02-03 | 2015-08-06 | The Board Of Trustees Of The Leland Stanford Junior University | Contact-free physiological monitoring during simultaneous magnetic resonance imaging |
| DE102019123356A1 (en) * | 2019-08-30 | 2021-03-04 | Schölly Fiberoptic GmbH | Sensor arrangement, method for calculating a color image and a hyperspectral image, method for carrying out a white balance and use of the sensor arrangement in medical imaging |
Families Citing this family (143)
| Publication number | Priority date | Publication date | Assignee | Title |
|---|---|---|---|---|
| US7219086B2 (en) * | 1999-04-09 | 2007-05-15 | Plain Sight Systems, Inc. | System and method for hyper-spectral analysis |
| US6734962B2 (en) | 2000-10-13 | 2004-05-11 | Chemimage Corporation | Near infrared chemical imaging microscope |
| US6640132B1 (en) * | 1999-11-17 | 2003-10-28 | Hypermed, Inc. | Forensic hyperspectral apparatus and method |
| JP3807721B2 (en) * | 2000-02-21 | 2006-08-09 | シャープ株式会社 | Image synthesizer |
| JP2002123530A (en) * | 2000-10-12 | 2002-04-26 | Hitachi Ltd | Method and device for visualizing multidimensional data |
| US8360973B2 (en) * | 2000-11-29 | 2013-01-29 | L'oreal | Process for acquiring scanned image data relating to an external body portion and/or a product applied thereto |
| AU2003211200A1 (en) * | 2002-02-14 | 2003-09-04 | Toshinori Kato | Apparatus for evaluating biological function |
| US7117026B2 (en) * | 2002-06-12 | 2006-10-03 | Koninklijke Philips Electronics N.V. | Physiological model based non-rigid image registration |
| US20060078037A1 (en) * | 2003-04-16 | 2006-04-13 | Tzong-Sheng Lee | Thermometer with image display |
| JP2004317393A (en) * | 2003-04-18 | 2004-11-11 | Shimadzu Corp | Two color irradiation thermometer |
| US7265350B2 (en) * | 2004-03-03 | 2007-09-04 | Advanced Biophotonics, Inc. | Integrated multi-spectral imaging systems and methods of tissue analyses using same |
| CN1311783C (en) * | 2004-03-10 | 2007-04-25 | 刘忠齐 | Method for evaluating effect of edjustment of physiological and mental state |
| DE102004016435B4 (en) * | 2004-03-31 | 2009-05-28 | Imedos Gmbh | Method for the spectrophotometric determination of the oxygen saturation of the blood in optically accessible blood vessels |
| US20060098194A1 (en) * | 2004-11-08 | 2006-05-11 | David Tuschel | Method and apparatus for determining change in an attribute of a sample during nucleation, aggregation, or chemical interaction |
| US7046359B2 (en) * | 2004-06-30 | 2006-05-16 | Chemimage Corporation | System and method for dynamic chemical imaging |
| US7580126B2 (en) * | 2004-06-30 | 2009-08-25 | Chemimage Corp. | Method and apparatus for producing a streaming Raman image of nucleation, aggregation, and chemical interaction |
| US7394542B2 (en) | 2004-08-18 | 2008-07-01 | Chemimage Corporation | Method and apparatus for chemical imaging in a microfluidic circuit |
| WO2006009178A1 (en) * | 2004-07-20 | 2006-01-26 | Toshinori Kato | Biofunction diagnosis device, biofunction diagnosis method, bioprobe, bioprobe wearing tool, bioprobe support tool, and bioprobe wearing assisting tool |
| US7519210B2 (en) * | 2004-09-09 | 2009-04-14 | Raphael Hirsch | Method of assessing localized shape and temperature of the human body |
| US7525654B2 (en) * | 2004-10-20 | 2009-04-28 | Duquesne University Of The Holy Spirit | Tunable laser-based chemical imaging system |
| US7693564B2 (en) * | 2004-11-19 | 2010-04-06 | General Electric Company | System, apparatus and method for forensic facial approximation |
| US8224425B2 (en) * | 2005-04-04 | 2012-07-17 | Hypermed Imaging, Inc. | Hyperspectral imaging in diabetes and peripheral vascular disease |
| CA2631564A1 (en) | 2004-11-29 | 2006-06-01 | Hypermed, Inc. | Medical hyperspectral imaging for evaluation of tissue and tumor |
| US8548570B2 (en) * | 2004-11-29 | 2013-10-01 | Hypermed Imaging, Inc. | Hyperspectral imaging of angiogenesis |
| AU2013202796B2 (en) * | 2004-12-28 | 2016-06-09 | Hypermed Imaging, Inc. | Hyperspectral/multispectral imaging in determination, assessment and monitoring of systemic physiology and shock |
| EP2319406A1 (en) | 2004-12-28 | 2011-05-11 | Hyperspectral Imaging, Inc | Hyperspectral/multispectral imaging in determination, assessment and monitoring of systemic physiology and shock |
| EP1681015A1 (en) * | 2005-01-17 | 2006-07-19 | Imasys SA | Temperature mapping on structural data |
| US8971984B2 (en) | 2005-04-04 | 2015-03-03 | Hypermed Imaging, Inc. | Hyperspectral technology for assessing and treating diabetic foot and tissue disease |
| WO2006107947A2 (en) | 2005-04-04 | 2006-10-12 | Hypermed, Inc. | Hyperspectral imaging in diabetes and peripheral vascular disease |
| US7738683B2 (en) * | 2005-07-22 | 2010-06-15 | Carestream Health, Inc. | Abnormality detection in medical images |
| WO2007014212A1 (en) * | 2005-07-25 | 2007-02-01 | Massachusetts Institute Of Technology | Multi modal spectroscopy |
| US8194946B2 (en) * | 2005-07-28 | 2012-06-05 | Fujifilm Corporation | Aligning apparatus, aligning method, and the program |
| AU2013200395B2 (en) * | 2005-08-12 | 2015-03-26 | Tcms Transparent Beauty Llc | System and method for applying a reflectance modifying agent to improve the visual attractiveness of human skin |
| ATE546294T1 (en) | 2005-08-12 | 2012-03-15 | Tcms Transparent Beauty Llc | SYSTEM AND METHOD FOR DELIVERING A REFLECTION MODIFICATION AGENT TO IMPROVE THE APPEARANCE OF HUMAN SKIN |
| CA2620114A1 (en) * | 2005-09-02 | 2007-03-08 | Pola Chemical Industries Inc. | Method of evaluating skin conditions and method of estimating skin thickness |
| US20070081703A1 (en) * | 2005-10-12 | 2007-04-12 | Industrial Widget Works Company | Methods, devices and systems for multi-modality integrated imaging |
| US20070090310A1 (en) * | 2005-10-24 | 2007-04-26 | General Electric Company | Methods and apparatus for inspecting an object |
| US20070161922A1 (en) * | 2006-01-09 | 2007-07-12 | Medical Optical Imaging Systems Ltd. | Method of infrared tomography, active and passive, for earlier diagnosis of breast cancer |
| US7941199B2 (en) | 2006-05-15 | 2011-05-10 | Masimo Laboratories, Inc. | Sepsis monitor |
| US8644911B1 (en) * | 2006-06-30 | 2014-02-04 | Hypermed Imaging, Inc. | OxyVu-1 hyperspectral tissue oxygenation (HTO) measurement system |
| US8942775B2 (en) * | 2006-08-14 | 2015-01-27 | Tcms Transparent Beauty Llc | Handheld apparatus and method for the automated application of cosmetics and other substances |
| US8184901B2 (en) | 2007-02-12 | 2012-05-22 | Tcms Transparent Beauty Llc | System and method for applying a reflectance modifying agent to change a person's appearance based on a digital image |
| DE502006007337D1 (en) * | 2006-12-11 | 2010-08-12 | Brainlab Ag | Multi-band tracking and calibration system |
| US10486174B2 (en) * | 2007-02-12 | 2019-11-26 | Tcms Transparent Beauty Llc | System and method for applying a reflectance modifying agent electrostatically to improve the visual attractiveness of human skin |
| US20090018414A1 (en) * | 2007-03-23 | 2009-01-15 | Mehrdad Toofan | Subcutanous Blood Vessels Imaging System |
| EP1982652A1 (en) * | 2007-04-20 | 2008-10-22 | Medicim NV | Method for deriving shape information |
| WO2009023385A1 (en) | 2007-07-03 | 2009-02-19 | Irvine Biomedical, Inc. | Magnetically guided catheter with flexible tip |
| US8734440B2 (en) | 2007-07-03 | 2014-05-27 | St. Jude Medical, Atrial Fibrillation Division, Inc. | Magnetically guided catheter |
| US10092082B2 (en) * | 2007-05-29 | 2018-10-09 | Tcms Transparent Beauty Llc | Apparatus and method for the precision application of cosmetics |
| WO2008154578A1 (en) * | 2007-06-11 | 2008-12-18 | Board Of Regents, The University Of Texas System | Characterization of a near-infrared laparoscopic hyperspectral imaging system |
| US8368741B2 (en) * | 2007-06-27 | 2013-02-05 | General Instrument Corporation | Apparatus and system for improving image quality |
| US9326715B1 (en) | 2007-07-02 | 2016-05-03 | Hypermed Imaging, Inc. | OxyVu-1 hyperspectral tissue oxygenation (HTO) measurement system |
| JP2009039280A (en) * | 2007-08-08 | 2009-02-26 | Arata Satori | Endoscopic system and method of detecting subject using endoscopic system |
| CN103505222A (en) | 2008-03-19 | 2014-01-15 | 超级医药成像有限公司 | Miniaturized multi-spectral imager for real-time tissue oxygenation measurement |
| JP5283415B2 (en) * | 2008-03-28 | 2013-09-04 | 富士フイルム株式会社 | Imaging apparatus and exposure control method |
| US9883833B2 (en) * | 2008-05-13 | 2018-02-06 | Spectral Image, Inc. | Systems and methods for hyperspectral medical imaging using real-time projection of spectral information |
| ES2715633T3 (en) | 2008-05-20 | 2019-06-05 | Univ Health Network | Device and method for imaging and fluorescence monitoring |
| US20090318815A1 (en) * | 2008-05-23 | 2009-12-24 | Michael Barnes | Systems and methods for hyperspectral medical imaging |
| US9117133B2 (en) | 2008-06-18 | 2015-08-25 | Spectral Image, Inc. | Systems and methods for hyperspectral imaging |
| US8473024B2 (en) * | 2008-08-12 | 2013-06-25 | Brainscope Company, Inc. | Flexible headset for sensing brain electrical activity |
| WO2010064179A1 (en) | 2008-12-05 | 2010-06-10 | Koninklijke Philips Electronics N.V. | Device, system, and method for combined optical and thermographic detection of the condition of joints |
| US20100311109A1 (en) * | 2009-06-03 | 2010-12-09 | Salaimeh Ahmad A | Non-contact method for quantifying changes in the dynamics of microbial populations |
| US8300880B2 (en) * | 2009-06-05 | 2012-10-30 | Ali Esmaili | System and method for temperature data acquisition |
| US8295548B2 (en) | 2009-06-22 | 2012-10-23 | The Johns Hopkins University | Systems and methods for remote tagging and tracking of objects using hyperspectral video sensors |
| JP5715126B2 (en) | 2009-07-09 | 2015-05-07 | コーニンクレッカ フィリップス エヌ ヴェ | Skin irradiation device |
| FR2949154B1 (en) * | 2009-08-13 | 2011-09-09 | Snecma | DEVICE FOR CONTROLLING PIECES OF AN AIRCRAFT ENGINE BY INFRARED THERMOGRAPHY |
| US8219247B2 (en) * | 2009-11-19 | 2012-07-10 | Air Products And Chemicals, Inc. | Method of operating a furnace |
| US8599264B2 (en) * | 2009-11-20 | 2013-12-03 | Fluke Corporation | Comparison of infrared images |
| CA2784576C (en) | 2009-12-15 | 2020-01-07 | Shuming Nie | System and methods for providing real-time anatomical guidance in a diagnostic or therapeutic procedure |
| US8634596B2 (en) * | 2009-12-22 | 2014-01-21 | Honeywell International Inc. | Three-dimensional multilayer skin texture recognition system and method |
| US8993964B2 (en) * | 2010-03-09 | 2015-03-31 | Chemimage Technologies Llc | System and method for detecting contaminants in a sample using near-infrared spectroscopy |
| WO2011127247A2 (en) * | 2010-04-07 | 2011-10-13 | Sanjay Krishna | Apparatus and techniques of non-invasive analysis |
| WO2011134083A1 (en) * | 2010-04-28 | 2011-11-03 | Ryerson University | System and methods for intraoperative guidance feedback |
| US8988680B2 (en) | 2010-04-30 | 2015-03-24 | Chemimage Technologies Llc | Dual polarization with liquid crystal tunable filters |
| US7884933B1 (en) | 2010-05-05 | 2011-02-08 | Revolutionary Business Concepts, Inc. | Apparatus and method for determining analyte concentrations |
| US9025850B2 (en) | 2010-06-25 | 2015-05-05 | Cireca Theranostics, Llc | Method for analyzing biological specimens by spectral imaging |
| WO2012051394A1 (en) * | 2010-10-14 | 2012-04-19 | The Arizona Board Of Regents On Behalf Of The University Of Arizona | Methods and apparatus for imaging detecting, and monitoring surficial and subdermal inflammation |
| CN102128817A (en) * | 2010-12-09 | 2011-07-20 | 中国石油集团川庆钻探工程有限公司长庆录井公司 | Three-dimensional quantitative fluorescence spectrum total volume integral method |
| JP5527478B2 (en) * | 2011-03-24 | 2014-06-18 | 株式会社ニコン | Optical coherence tomography observation apparatus, method for determining relative position between images, and program for determining relative position between images |
| US10426356B2 (en) | 2011-07-09 | 2019-10-01 | Gauss Surgical, Inc. | Method for estimating a quantity of a blood component in a fluid receiver and corresponding error |
| US8792693B2 (en) | 2011-07-09 | 2014-07-29 | Gauss Surgical | System and method for estimating extracorporeal blood volume in a physical sample |
| JP2014526314A (en) * | 2011-09-08 | 2014-10-06 | インディケーター システムズ インターナショナル, インコーポレイテッド | Wound care compositions and devices activated by infection |
| EP2757933B1 (en) | 2011-09-22 | 2019-02-06 | The George Washington University | Systems for visualizing ablated tissue |
| WO2013044182A1 (en) | 2011-09-22 | 2013-03-28 | The George Washington University | Systems and methods for visualizing ablated tissue |
| US8868157B1 (en) | 2011-11-09 | 2014-10-21 | VisionQuest Biomedical LLC | Thermal optical imager system and method for detection of peripheral neuropathy |
| US8761476B2 (en) | 2011-11-09 | 2014-06-24 | The Johns Hopkins University | Hyperspectral imaging for detection of skin related conditions |
| US9115066B2 (en) | 2011-12-14 | 2015-08-25 | Indicator Systems International, Inc. | Trisubstituted methyl alcohols and their polymerizable derivatives |
| IN2014DN10002A (en) | 2012-05-14 | 2015-08-14 | Gauss Surgical | |
| JP6021237B2 (en) | 2012-05-14 | 2016-11-09 | ガウス サージカルGauss Surgical | System for managing patient blood loss |
| US9329086B2 (en) | 2012-05-30 | 2016-05-03 | Chemimage Technologies Llc | System and method for assessing tissue oxygenation using a conformal filter |
| CN104684398A (en) | 2012-08-31 | 2015-06-03 | 索隆-基特林癌症研究协会 | Particles, methods and uses thereof |
| US20140092255A1 (en) * | 2012-10-03 | 2014-04-03 | Bae Systems Information And Electronic Systems Integration Inc. | Auto correlation between camera bands |
| EP2934600A4 (en) | 2012-12-19 | 2016-08-17 | Sloan Kettering Inst Cancer | Multimodal particles, methods and uses thereof |
| US9107567B2 (en) | 2012-12-27 | 2015-08-18 | Christie Digital Systems Usa, Inc. | Spectral imaging with a color wheel |
| CA2900138A1 (en) * | 2013-02-01 | 2014-08-07 | Daniel L. Farkas | Method and system for characterizing tissue in three dimensions using multimode optical measurements |
| US11653874B2 (en) | 2013-02-01 | 2023-05-23 | Acceleritas Corporation | Method and system for characterizing tissue in three dimensions using multimode optical measurements |
| JP6635791B2 (en) * | 2013-02-20 | 2020-01-29 | スローン − ケタリング・インスティテュート・フォー・キャンサー・リサーチ | Wide-field Raman imaging apparatus and related method |
| JP6527086B2 (en) * | 2013-03-15 | 2019-06-05 | シナプティヴ メディカル (バルバドス) インコーポレイテッドSynaptive Medical (Barbados) Inc. | Imaging system for hyperspectral surgery |
| CN103491328A (en) * | 2013-06-26 | 2014-01-01 | 苏州联科盛世科技有限公司 | Vein projector with image correction function and image correction method |
| US9987093B2 (en) | 2013-07-08 | 2018-06-05 | Brainlab Ag | Single-marker navigation |
| US20150094600A1 (en) * | 2013-10-01 | 2015-04-02 | Yale University | System And Method For Imaging Myelin |
| JP6737705B2 (en) | 2013-11-14 | 2020-08-12 | ザ・ジョージ・ワシントン・ユニバーシティThe George Washingtonuniversity | Method of operating system for determining depth of injury site and system for generating images of heart tissue |
| JP2017500550A (en) | 2013-11-20 | 2017-01-05 | ザ・ジョージ・ワシントン・ユニバーシティThe George Washingtonuniversity | System and method for hyperspectral analysis of cardiac tissue |
| US20170140528A1 (en) * | 2014-01-25 | 2017-05-18 | Amir Aharon Handzel | Automated histological diagnosis of bacterial infection using image analysis |
| US10912947B2 (en) | 2014-03-04 | 2021-02-09 | Memorial Sloan Kettering Cancer Center | Systems and methods for treatment of disease via application of mechanical force by controlled rotation of nanoparticles inside cells |
| WO2015143417A1 (en) * | 2014-03-21 | 2015-09-24 | Hypermed Imaging, Inc. | Systems and methods for measuring tissue oxygenation |
| US10010278B2 (en) | 2014-03-21 | 2018-07-03 | Hypermed Imaging, Inc. | Systems and methods for measuring tissue oxygenation |
| EP3132380B1 (en) | 2014-04-15 | 2020-10-14 | Gauss Surgical, Inc. | Method for estimating a quantity of a blood component in a fluid canister |
| JP6451741B2 (en) * | 2014-07-11 | 2019-01-16 | 株式会社ニコン | Image analysis apparatus, imaging system, surgery support system, and image analysis program |
| EP3957232A1 (en) | 2014-07-24 | 2022-02-23 | University Health Network | Collection and analysis of data for diagnostic purposes |
| US9968285B2 (en) * | 2014-07-25 | 2018-05-15 | Christie Digital Systems Usa, Inc. | Multispectral medical imaging devices and methods thereof |
| EP3180038A4 (en) | 2014-07-28 | 2018-04-04 | Memorial Sloan-Kettering Cancer Center | Metal(loid) chalcogen nanoparticles as universal binders for medical isotopes |
| CN106572820B (en) * | 2014-08-18 | 2020-09-15 | Epat有限公司 | Pain assessment system |
| KR102499045B1 (en) | 2014-11-03 | 2023-02-10 | 더 조지 워싱턴 유니버시티 | Systems and methods for lesion assessment |
| JP6771731B2 (en) | 2014-11-03 | 2020-10-21 | 460メディカル・インコーポレイテッド460Medical, Inc. | Contact evaluation system and method |
| WO2016083483A1 (en) * | 2014-11-27 | 2016-06-02 | Koninklijke Philips N.V. | Imaging device and method for generating an image of a patient |
| US10919089B2 (en) | 2015-07-01 | 2021-02-16 | Memorial Sloan Kettering Cancer Center | Anisotropic particles, methods and uses thereof |
| US10779904B2 (en) | 2015-07-19 | 2020-09-22 | 460Medical, Inc. | Systems and methods for lesion formation and assessment |
| US10460439B1 (en) | 2015-08-12 | 2019-10-29 | Cireca Theranostics, Llc | Methods and systems for identifying cellular subtypes in an image of a biological specimen |
| CN105354851B (en) * | 2015-11-20 | 2018-07-17 | 中国安全生产科学研究院 | It adjusts the distance adaptive infrared and visible light video fusion method |
| US10114467B2 (en) | 2015-11-30 | 2018-10-30 | Photopotech LLC | Systems and methods for processing image information |
| US10706621B2 (en) | 2015-11-30 | 2020-07-07 | Photopotech LLC | Systems and methods for processing image information |
| US11217009B2 (en) | 2015-11-30 | 2022-01-04 | Photopotech LLC | Methods for collecting and processing image information to produce digital assets |
| US10306156B2 (en) | 2015-11-30 | 2019-05-28 | Photopotech LLC | Image-capture device |
| US10778877B2 (en) | 2015-11-30 | 2020-09-15 | Photopotech LLC | Image-capture device |
| EP3736771A1 (en) | 2015-12-23 | 2020-11-11 | Gauss Surgical, Inc. | Method for estimating blood component quantities in surgical textiles |
| ES2716170T3 (en) * | 2016-06-16 | 2019-06-10 | Biomerieux Sa | Method and system of identification of the Gram type of a bacterium |
| WO2018009670A1 (en) * | 2016-07-06 | 2018-01-11 | Chemimage Corporation | Systems and methods for detecting edema |
| WO2018035612A1 (en) | 2016-08-24 | 2018-03-01 | Mimosa Diagnostics Inc. | Multispectral mobile tissue assessment |
| CN106361281B (en) * | 2016-08-31 | 2018-06-19 | 北京数字精准医疗科技有限公司 | Fluorescence real time imagery, fusion method and device |
| US11229368B2 (en) | 2017-01-13 | 2022-01-25 | Gauss Surgical, Inc. | Fluid loss estimation based on weight of medical items |
| US10733442B2 (en) | 2017-05-09 | 2020-08-04 | Vision Engineering Solutions, LLC | Optical surveillance system |
| US10746470B2 (en) | 2017-06-29 | 2020-08-18 | Air Products & Chemicals, Inc. | Method of operating a furnace |
| FR3071124B1 (en) * | 2017-09-12 | 2019-09-06 | Carbon Bee | DEVICE FOR CAPTURING A HYPERSPECTRAL IMAGE |
| CN107991591A (en) * | 2017-12-04 | 2018-05-04 | 云南电网有限责任公司普洱供电局 | One kind is based on the modified image interfusion method of the unimodal interpolation of Kaiser windows FFT |
| US10943092B2 (en) | 2018-05-23 | 2021-03-09 | ClairLabs Ltd. | Monitoring system |
| CN109034213B (en) * | 2018-07-06 | 2021-08-03 | 华中师范大学 | Hyperspectral image classification method and system based on correlation entropy principle |
| MX2021000628A (en) | 2018-07-16 | 2021-05-27 | Bbi Medical Innovations Llc | Perfusion and oxygenation measurement. |
| US11561294B2 (en) | 2018-07-27 | 2023-01-24 | Vision Engineering Solutions, LLC | Laser safety system |
| WO2020101635A1 (en) | 2018-11-12 | 2020-05-22 | Hewlett-Packard Development Company, L.P. | Multiple-pattern fiducial for heterogeneous imaging sensor systems |
| TWI664582B (en) * | 2018-11-28 | 2019-07-01 | 靜宜大學 | Method, apparatus and system for cell detection |
| CA3127682A1 (en) | 2019-02-04 | 2020-08-13 | Massachusetts Institute Of Technology | Systems and methods for lymph nodes and vessels imaging |
| US20220132052A1 (en) * | 2020-10-26 | 2022-04-28 | Epilog Imaging Systems Inc. | Imaging method and device |
Family Cites Families (24)
| Publication number | Priority date | Publication date | Assignee | Title |
|---|---|---|---|---|
| US4751571A (en) * | 1987-07-29 | 1988-06-14 | General Electric Company | Composite visible/thermal-infrared imaging apparatus |
| US5553614A (en) | 1988-12-21 | 1996-09-10 | Non-Invasive Technology, Inc. | Examination of biological tissue using frequency domain spectroscopy |
| US5490516A (en) * | 1990-12-14 | 1996-02-13 | Hutson; William H. | Method and system to enhance medical signals for real-time analysis and high-resolution display |
| US5784162A (en) * | 1993-08-18 | 1998-07-21 | Applied Spectral Imaging Ltd. | Spectral bio-imaging methods for biological research, medical diagnostics and therapy |
| US5936731A (en) * | 1991-02-22 | 1999-08-10 | Applied Spectral Imaging Ltd. | Method for simultaneous detection of multiple fluorophores for in situ hybridization and chromosome painting |
| US5991028A (en) * | 1991-02-22 | 1999-11-23 | Applied Spectral Imaging Ltd. | Spectral bio-imaging methods for cell classification |
| US5441053A (en) | 1991-05-03 | 1995-08-15 | University Of Kentucky Research Foundation | Apparatus and method for multiple wavelength of tissue |
| JPH0556918A (en) * | 1991-09-05 | 1993-03-09 | Olympus Optical Co Ltd | Endoscope device |
| US5377003A (en) | 1992-03-06 | 1994-12-27 | The United States Of America As Represented By The Department Of Health And Human Services | Spectroscopic imaging device employing imaging quality spectral filters |
| US5528368A (en) | 1992-03-06 | 1996-06-18 | The United States Of America As Represented By The Department Of Health And Human Services | Spectroscopic imaging device employing imaging quality spectral filters |
| US5568384A (en) * | 1992-10-13 | 1996-10-22 | Mayo Foundation For Medical Education And Research | Biomedical imaging and analysis |
| US5782770A (en) | 1994-05-12 | 1998-07-21 | Science Applications International Corporation | Hyperspectral imaging methods and apparatus for non-invasive diagnosis of tissue for cancer |
| US5871013A (en) * | 1995-05-31 | 1999-02-16 | Elscint Ltd. | Registration of nuclear medicine images |
| EP0830789A4 (en) * | 1995-06-07 | 1998-12-02 | Stryker Corp | Imaging system with independent processing of visible and infrared light energy |
| JP2001518241A (en) * | 1995-06-07 | 2001-10-09 | ストリカー・コーポレーション | An imaging system that processes visible light energy and infrared light energy separately |
| JPH09178566A (en) * | 1995-12-26 | 1997-07-11 | Tokai Carbon Co Ltd | Method and apparatus for displaying thermal image |
| GB9606124D0 (en) | 1996-03-22 | 1996-05-22 | Rogers Gary | System for detecting cancers |
| JPH1073412A (en) * | 1996-08-30 | 1998-03-17 | Tokimec Inc | Far infrared image pickup device |
| US5760899A (en) | 1996-09-04 | 1998-06-02 | Erim International, Inc. | High-sensitivity multispectral sensor |
| JPH1189789A (en) * | 1997-09-24 | 1999-04-06 | Olympus Optical Co Ltd | Fluorescent image device |
| AU751456B2 (en) * | 1997-10-30 | 2002-08-15 | Hypermed Imaging, Inc. | Multispectral/hyperspectral medical instrument |
| US6198957B1 (en) * | 1997-12-19 | 2001-03-06 | Varian, Inc. | Radiotherapy machine including magnetic resonance imaging system |
| AU5908699A (en) | 1998-09-03 | 2000-03-27 | Hypermed Imaging, Inc. | Infrared endoscopic balloon probes |
| US6173201B1 (en) * | 1999-02-22 | 2001-01-09 | V-Target Ltd. | Stereotactic diagnosis and treatment with reference to a combined image |
-
2000
- 2000-07-03 JP JP2001507361A patent/JP4849755B2/en not_active Expired - Lifetime
- 2000-07-03 US US09/609,544 patent/US6640130B1/en not_active Expired - Lifetime
- 2000-07-03 WO PCT/US2000/018221 patent/WO2001001854A2/en active Application Filing
- 2000-07-03 CA CA2374040A patent/CA2374040C/en not_active Expired - Fee Related
- 2000-07-03 EP EP00943361.6A patent/EP1196081B1/en not_active Expired - Lifetime
- 2000-07-03 AU AU57839/00A patent/AU5783900A/en not_active Abandoned
-
2003
- 2003-10-06 US US10/678,651 patent/US20040236229A1/en not_active Abandoned
Cited By (2)
| Publication number | Priority date | Publication date | Assignee | Title |
|---|---|---|---|---|
| WO2015117084A1 (en) * | 2014-02-03 | 2015-08-06 | The Board Of Trustees Of The Leland Stanford Junior University | Contact-free physiological monitoring during simultaneous magnetic resonance imaging |
| DE102019123356A1 (en) * | 2019-08-30 | 2021-03-04 | Schölly Fiberoptic GmbH | Sensor arrangement, method for calculating a color image and a hyperspectral image, method for carrying out a white balance and use of the sensor arrangement in medical imaging |
Also Published As
| Publication number | Publication date |
|---|---|
| US6640130B1 (en) | 2003-10-28 |
| JP4849755B2 (en) | 2012-01-11 |
| CA2374040A1 (en) | 2001-01-11 |
| JP2003503135A (en) | 2003-01-28 |
| AU5783900A (en) | 2001-01-22 |
| US20040236229A1 (en) | 2004-11-25 |
| WO2001001854A2 (en) | 2001-01-11 |
| CA2374040C (en) | 2010-10-19 |
| EP1196081A2 (en) | 2002-04-17 |
| WO2001001854A3 (en) | 2001-09-13 |
Similar Documents
| Publication | Publication Date | Title |
|---|---|---|
| EP1196081B1 (en) | Integrated imaging apparatus | |
| US20020173723A1 (en) | Dual imaging apparatus | |
| EP2271901B1 (en) | Miniaturized multi-spectral imager for real-time tissue oxygenation measurement | |
| JP2003503135A5 (en) | ||
| US11278220B2 (en) | Determining peripheral oxygen saturation (SpO2) and hemoglobin concentration using multi-spectral laser imaging (MSLI) methods and systems | |
| EP3243068B1 (en) | Multi-spectral laser imaging (msli) methods and systems for blood flow and perfusion imaging and quantification | |
| US20150078642A1 (en) | Method and system for non-invasive quantification of biologial sample physiology using a series of images | |
| EP2840957B1 (en) | Optical coherent imaging medical device and method | |
| EP3298963B1 (en) | Systems and methods for measuring tissue oxygenation | |
| EP1931262B1 (en) | Disposable calibration-fiducial mark for hyperspectral imaging | |
| US20200294228A1 (en) | Non-Contact Multispectral Imaging for Blood Oxygen Level and Perfusion Measurement and Related Systems and Computer Program Products | |
| CN115474930A (en) | Hyperspectral image reconstruction-based noninvasive hemoglobin detection method | |
| Jüstel et al. | Spotlight on nerves: portable multispectral optoacoustic imaging of peripheral nerve vascularization and morphology | |
| RU2528087C1 (en) | Device for measuring haemoglobin concentration and degree of blood oxygenation in mucous membranes | |
| Meriaudeau et al. | 3D and multispectral imaging for subcutaneous veins detection | |
| CN113261953B (en) | Multispectral surface diagnosis measuring method | |
| US10258237B2 (en) | Photobiomedical measurement apparatus | |
| Jolivot et al. | Research Article Skin Parameter Map Retrieval from a Dedicated Multispectral Imaging System Applied to Dermatology/Cosmetology | |
| Vilaseca et al. | Asian Journal of Physics | |
| Giggin et al. | ADVANCEMENTS IN IMAGING FOR CUTANEOUS WOUND EVALUATION | |
| Borisova et al. | Chromatic Monitoring of Biological Tissues and Fluids |
Legal Events
| Date | Code | Title | Description |
|---|---|---|---|
| PUAI | Public reference made under article 153(3) epc to a published international application that has entered the european phase |
Free format text: ORIGINAL CODE: 0009012 |
|
| 17P | Request for examination filed |
Effective date: 20020128 |
|
| AK | Designated contracting states |
Kind code of ref document: A2 Designated state(s): AT BE CH CY DE DK ES FI FR GB GR IE IT LI LU MC NL PT SE |
|
| AX | Request for extension of the european patent |
Free format text: AL;LT;LV;MK;RO;SI |
|
| RIN1 | Information on inventor provided before grant (corrected) |
Inventor name: HOPMEIER, MICHAEL J. Inventor name: LEVENTON, MICHAEL Inventor name: LEWIS, EDGAR N. Inventor name: MANSFIELD, JAMES Inventor name: FREEMAN, JENNY, E. |
|
| RAP1 | Party data changed (applicant data changed or rights of an application transferred) |
Owner name: HYPERMED, INC. |
|
| 17Q | First examination report despatched |
Effective date: 20080911 |
|
| RAP1 | Party data changed (applicant data changed or rights of an application transferred) |
Owner name: HYPERSPECTRAL IMAGING, INC |
|
| RAP1 | Party data changed (applicant data changed or rights of an application transferred) |
Owner name: HYPERMED IMAGING, INC. |
|
| GRAP | Despatch of communication of intention to grant a patent |
Free format text: ORIGINAL CODE: EPIDOSNIGR1 |
|
| GRAS | Grant fee paid |
Free format text: ORIGINAL CODE: EPIDOSNIGR3 |
|
| GRAA | (expected) grant |
Free format text: ORIGINAL CODE: 0009210 |
|
| AK | Designated contracting states |
Kind code of ref document: B1 Designated state(s): AT BE CH CY DE DK ES FI FR GB GR IE IT LI LU MC NL PT SE |
|
| REG | Reference to a national code |
Ref country code: GB Ref legal event code: FG4D |
|
| REG | Reference to a national code |
Ref country code: CH Ref legal event code: EP |
|
| REG | Reference to a national code |
Ref country code: AT Ref legal event code: REF Ref document number: 627549 Country of ref document: AT Kind code of ref document: T Effective date: 20130915 |
|
| REG | Reference to a national code |
Ref country code: IE Ref legal event code: FG4D |
|
| REG | Reference to a national code |
Ref country code: DE Ref legal event code: R096 Ref document number: 60048214 Country of ref document: DE Effective date: 20131017 |
|
| REG | Reference to a national code |
Ref country code: AT Ref legal event code: MK05 Ref document number: 627549 Country of ref document: AT Kind code of ref document: T Effective date: 20130821 Ref country code: NL Ref legal event code: VDEP Effective date: 20130821 |
|
| PG25 | Lapsed in a contracting state [announced via postgrant information from national office to epo] |
Ref country code: PT Free format text: LAPSE BECAUSE OF FAILURE TO SUBMIT A TRANSLATION OF THE DESCRIPTION OR TO PAY THE FEE WITHIN THE PRESCRIBED TIME-LIMIT Effective date: 20131223 Ref country code: CY Free format text: LAPSE BECAUSE OF NON-PAYMENT OF DUE FEES Effective date: 20130610 Ref country code: AT Free format text: LAPSE BECAUSE OF FAILURE TO SUBMIT A TRANSLATION OF THE DESCRIPTION OR TO PAY THE FEE WITHIN THE PRESCRIBED TIME-LIMIT Effective date: 20130821 Ref country code: SE Free format text: LAPSE BECAUSE OF FAILURE TO SUBMIT A TRANSLATION OF THE DESCRIPTION OR TO PAY THE FEE WITHIN THE PRESCRIBED TIME-LIMIT Effective date: 20130821 |
|
| PG25 | Lapsed in a contracting state [announced via postgrant information from national office to epo] |
Ref country code: GR Free format text: LAPSE BECAUSE OF FAILURE TO SUBMIT A TRANSLATION OF THE DESCRIPTION OR TO PAY THE FEE WITHIN THE PRESCRIBED TIME-LIMIT Effective date: 20131122 Ref country code: FI Free format text: LAPSE BECAUSE OF FAILURE TO SUBMIT A TRANSLATION OF THE DESCRIPTION OR TO PAY THE FEE WITHIN THE PRESCRIBED TIME-LIMIT Effective date: 20130821 Ref country code: BE Free format text: LAPSE BECAUSE OF FAILURE TO SUBMIT A TRANSLATION OF THE DESCRIPTION OR TO PAY THE FEE WITHIN THE PRESCRIBED TIME-LIMIT Effective date: 20130821 |
|
| PG25 | Lapsed in a contracting state [announced via postgrant information from national office to epo] |
Ref country code: CY Free format text: LAPSE BECAUSE OF NON-PAYMENT OF DUE FEES Effective date: 20130821 |
|
| PG25 | Lapsed in a contracting state [announced via postgrant information from national office to epo] |
Ref country code: NL Free format text: LAPSE BECAUSE OF FAILURE TO SUBMIT A TRANSLATION OF THE DESCRIPTION OR TO PAY THE FEE WITHIN THE PRESCRIBED TIME-LIMIT Effective date: 20130821 Ref country code: DK Free format text: LAPSE BECAUSE OF FAILURE TO SUBMIT A TRANSLATION OF THE DESCRIPTION OR TO PAY THE FEE WITHIN THE PRESCRIBED TIME-LIMIT Effective date: 20130821 |
|
| PG25 | Lapsed in a contracting state [announced via postgrant information from national office to epo] |
Ref country code: IT Free format text: LAPSE BECAUSE OF FAILURE TO SUBMIT A TRANSLATION OF THE DESCRIPTION OR TO PAY THE FEE WITHIN THE PRESCRIBED TIME-LIMIT Effective date: 20130821 Ref country code: ES Free format text: LAPSE BECAUSE OF FAILURE TO SUBMIT A TRANSLATION OF THE DESCRIPTION OR TO PAY THE FEE WITHIN THE PRESCRIBED TIME-LIMIT Effective date: 20130821 |
|
| PLBE | No opposition filed within time limit |
Free format text: ORIGINAL CODE: 0009261 |
|
| STAA | Information on the status of an ep patent application or granted ep patent |
Free format text: STATUS: NO OPPOSITION FILED WITHIN TIME LIMIT |
|
| 26N | No opposition filed |
Effective date: 20140522 |
|
| REG | Reference to a national code |
Ref country code: DE Ref legal event code: R097 Ref document number: 60048214 Country of ref document: DE Effective date: 20140522 |
|
| PG25 | Lapsed in a contracting state [announced via postgrant information from national office to epo] |
Ref country code: LU Free format text: LAPSE BECAUSE OF FAILURE TO SUBMIT A TRANSLATION OF THE DESCRIPTION OR TO PAY THE FEE WITHIN THE PRESCRIBED TIME-LIMIT Effective date: 20140703 |
|
| REG | Reference to a national code |
Ref country code: CH Ref legal event code: PL |
|
| REG | Reference to a national code |
Ref country code: IE Ref legal event code: MM4A |
|
| REG | Reference to a national code |
Ref country code: FR Ref legal event code: ST Effective date: 20150331 |
|
| PG25 | Lapsed in a contracting state [announced via postgrant information from national office to epo] |
Ref country code: CH Free format text: LAPSE BECAUSE OF NON-PAYMENT OF DUE FEES Effective date: 20140731 Ref country code: LI Free format text: LAPSE BECAUSE OF NON-PAYMENT OF DUE FEES Effective date: 20140731 |
|
| PG25 | Lapsed in a contracting state [announced via postgrant information from national office to epo] |
Ref country code: FR Free format text: LAPSE BECAUSE OF NON-PAYMENT OF DUE FEES Effective date: 20140731 |
|
| PG25 | Lapsed in a contracting state [announced via postgrant information from national office to epo] |
Ref country code: IE Free format text: LAPSE BECAUSE OF NON-PAYMENT OF DUE FEES Effective date: 20140703 |
|
| PG25 | Lapsed in a contracting state [announced via postgrant information from national office to epo] |
Ref country code: MC Free format text: LAPSE BECAUSE OF FAILURE TO SUBMIT A TRANSLATION OF THE DESCRIPTION OR TO PAY THE FEE WITHIN THE PRESCRIBED TIME-LIMIT Effective date: 20130821 |
|
| PGFP | Annual fee paid to national office [announced via postgrant information from national office to epo] |
Ref country code: GB Payment date: 20170628 Year of fee payment: 18 |
|
| PGFP | Annual fee paid to national office [announced via postgrant information from national office to epo] |
Ref country code: DE Payment date: 20170627 Year of fee payment: 18 |
|
| REG | Reference to a national code |
Ref country code: DE Ref legal event code: R119 Ref document number: 60048214 Country of ref document: DE |
|
| GBPC | Gb: european patent ceased through non-payment of renewal fee |
Effective date: 20180703 |
|
| PG25 | Lapsed in a contracting state [announced via postgrant information from national office to epo] |
Ref country code: GB Free format text: LAPSE BECAUSE OF NON-PAYMENT OF DUE FEES Effective date: 20180703 Ref country code: DE Free format text: LAPSE BECAUSE OF NON-PAYMENT OF DUE FEES Effective date: 20190201 |