EP0514933A2 - Method of extracting feature image data and method of extracting person's face data - Google Patents
Method of extracting feature image data and method of extracting person's face data Download PDFInfo
- Publication number
- EP0514933A2 EP0514933A2 EP92108701A EP92108701A EP0514933A2 EP 0514933 A2 EP0514933 A2 EP 0514933A2 EP 92108701 A EP92108701 A EP 92108701A EP 92108701 A EP92108701 A EP 92108701A EP 0514933 A2 EP0514933 A2 EP 0514933A2
- Authority
- EP
- European Patent Office
- Prior art keywords
- region
- mountain
- original image
- picture elements
- color
- Prior art date
- Legal status (The legal status is an assumption and is not a legal conclusion. Google has not performed a legal analysis and makes no representation as to the accuracy of the status listed.)
- Granted
Links
Images


Classifications
-
- G—PHYSICS
- G03—PHOTOGRAPHY; CINEMATOGRAPHY; ANALOGOUS TECHNIQUES USING WAVES OTHER THAN OPTICAL WAVES; ELECTROGRAPHY; HOLOGRAPHY
- G03B—APPARATUS OR ARRANGEMENTS FOR TAKING PHOTOGRAPHS OR FOR PROJECTING OR VIEWING THEM; APPARATUS OR ARRANGEMENTS EMPLOYING ANALOGOUS TECHNIQUES USING WAVES OTHER THAN OPTICAL WAVES; ACCESSORIES THEREFOR
- G03B27/00—Photographic printing apparatus
- G03B27/72—Controlling or varying light intensity, spectral composition, or exposure time in photographic printing apparatus
- G03B27/73—Controlling exposure by variation of spectral composition, e.g. multicolor printers
- G03B27/735—Controlling exposure by variation of spectral composition, e.g. multicolor printers in dependence upon automatic analysis of the original
-
- G—PHYSICS
- G06—COMPUTING; CALCULATING OR COUNTING
- G06V—IMAGE OR VIDEO RECOGNITION OR UNDERSTANDING
- G06V40/00—Recognition of biometric, human-related or animal-related patterns in image or video data
- G06V40/10—Human or animal bodies, e.g. vehicle occupants or pedestrians; Body parts, e.g. hands
- G06V40/16—Human faces, e.g. facial parts, sketches or expressions
- G06V40/161—Detection; Localisation; Normalisation
-
- G—PHYSICS
- G03—PHOTOGRAPHY; CINEMATOGRAPHY; ANALOGOUS TECHNIQUES USING WAVES OTHER THAN OPTICAL WAVES; ELECTROGRAPHY; HOLOGRAPHY
- G03B—APPARATUS OR ARRANGEMENTS FOR TAKING PHOTOGRAPHS OR FOR PROJECTING OR VIEWING THEM; APPARATUS OR ARRANGEMENTS EMPLOYING ANALOGOUS TECHNIQUES USING WAVES OTHER THAN OPTICAL WAVES; ACCESSORIES THEREFOR
- G03B27/00—Photographic printing apparatus
- G03B27/72—Controlling or varying light intensity, spectral composition, or exposure time in photographic printing apparatus
- G03B27/80—Controlling or varying light intensity, spectral composition, or exposure time in photographic printing apparatus in dependence upon automatic analysis of the original
Definitions
- the present invention relates to a method of extracting feature image data and a method of extracting person's face data, more particularly to a method of extracting feature image data and a method of extracting person's face density data used to copy a color original image to a color copying material or black-and-white copying material.
- a person's face is most remarked for appreciation of a portrait. To finish a high-quality photo, it is necessary to print the person's face with a proper color.
- the face region in the original image of a color film is specified by a light pen to extract the data for the density of a person's face and the exposure is determined so that the face color is properly printed according to the extracted density data.
- This type of art is disclosed in the official gazettes of Japanese Patent Application Laid-Open Nos. 62-115430, 62-115431, 62-115432, 62-189456, 62-189457, 63-138340, and 63-178222.
- the above related art has a problem that printing requires a lot of time because the operator has to specify the face region for each image by a light pen. Moreover, it is difficult to realize automation because the operator has to visually specify the face region.
- each photometric point is resolved into three colors of R (red), G (green), and B (blue) to photometrically measure them, and it is judged if the color of each photometric point calculated from photometric data is kept within the flesh-color range. Then, a cluster (group) of the photometric points decided as a color within the flesh-color range is used for face density data.
- the light source can roughly be classified into sunlight, fluorescent light, and tungsten light.
- the color tone of sunlight depends on the season and time zone and also on direct or indirect light even if the season and time zone are the same.
- the present invention is made to solve the above problem and it is the object of the present invention to provide a feature image data extraction method for automatically extracting only feature image data such as person's face data at a high accuracy the color original image on a negative film or the like and a person's face data extraction method for automatically extracting only person's face data at a high accuracy from it.
- the first invention divides a color original image into many picture elements to resolve each picture element into three colors of red, green, and blue lights and photometrically measure them, obtains the histogram of hue values in accordance with the data obtained through photometry, divides the obtained histogram into mountains, classifies picture elements into groups corresponding to the divided mountains by judging which divided mountain each picture element of the color original image belongs to, dividing the color original image for each group, and selecting at least one of the divided regions to extract the data for the selected region as feature image data.
- the first invention it is possible to obtain a two-dimensional histogram on hue values and saturation values in accordance with the data obtained through photometry in stead of a one-dimensional histogram on hue values, divide the obtained two-dimensional histogram into mountains, judge which divided mountain each picture element of the color original image belongs to in order to divide many picture elements into groups corresponding to the divided mountains, divide the color original image for each group, and select at least one of the divided regions to extract the data for the selected region as feature image data.
- the first invention it is possible to extract person's face density data as feature image data by judging if a selected divided region is a person's face and selecting the region decided as a Person's face.
- a color original image is divided into many picture elements to resolve each picture element into three colors of red, green, and blue lights and photometrically measure them, and a histogram of hue values is obtained in accordance with the data obtained through photometry. Then, the obtained histogram is divided into mountains by separating them at the trough or the foot of mountain. Thereby, the hue value range of each mountain can be specified. Then, it is decided which divided mountain each picture element belongs to by judging which hue value range the hue value of each picture element belongs to and many picture elements are classified into groups (clusters) corresponding to the divided mountains. Then, the color original image is divided into regions corresponding to the divided groups.
- picture elements included in the same region may be divided into different regions, picture elements included in different groups are not included in the same region. Therefore, the color original image is divided for each region including picture elements having hue values within the hue value range divided by the histogram. Resultingly, picture elements with hue values kept within the predetermined range are included in one region on the color original image.
- feature image data can be extracted by selecting at least one region showing the feature of the image because the data for the selected region shows feature image data.
- the color tone of color original image is uniformly changed in the whole screen due to difference of the type of film or light source, change of film characteristic with time, or difference between developed films.
- divided regions of the color original image are not changed due to change of color tone because groups consisting of picture elements of an image are stored though only the position on the histogram changes even if the color tone changes. Therefore, the present invention makes it possible to extract person's face density data even if the color tone or color range of the color original image changes due to difference of the type of film or light source, change of film characteristic with time, or difference between developed films.
- the saturation value is adopted in addition to the hue value to obtain a two-dimensional histogram of hue values and saturation values, the two-dimensional histogram is divided into mountains to divide the color original image similarly to the above procedure, and at least one of the divided regions is selected to determine an exposure in accordance with the extracted feature image data.
- hue values and saturation values feature image data can be extracted even if portions having a color tone same as or similar to the feature image are mixed.
- a person's face is most remarked for appreciation of a portrait, it is preferable to judge if a divided region of a color original image is a person's face and extract the data for the region decided as a person's face as feature image data.
- feature image data or person's face data can be extracted in accordance with the histogram of hue values
- person's face data in accordance with the two-dimensional histogram of hue values and saturation values.
- the color tone of person's face is similar to that of flesh color portions of ground and tree. However, the saturation of it is different from that of them in most cases. Therefore, person's face data can also be extracted from an image in which a person's face, ground, and trees are mixed, by extracting person's face data in accordance with the two-dimensional histogram of hue values and saturation values.
- the data to be extracted as feature image data can be data other than person's face data.
- the following second and third inventions divide even a two-dimensional histogram consisting of a complex shape into mountains.
- the second invention divides a color original image into many picture elements to resolve each picture element into three colors of red, green, and blue lights and photometrically measure them, obtains a two-dimensional histogram of hue values and saturation values in accordance with the data obtained through photometry, cuts the two-dimensional histogram by a feature plane parallel with a coordinate plane including a cross section corresponding to the crest of a specific single mountain of the obtained two-dimensional histogram and also including the hue-value axis and saturation-value axis of the two-dimensional histogram to obtain cross sections of the two-dimensional histogram, executes the exclusive expansion for expanding each cross section until the interval between cross-section boundaries adjacent on the feature plane decreases to a predetermined value or less or until the frequency of the boundaries decreases to a predetermined value close to the minimum value or a predetermined value close to the minimum value or less to divide the two-dimensional histogram for each mountain at the cross-section boundaries after exclusive expansion, judges which divided mountain each picture element of the color original image belongs to in order to divide picture
- a color original image is divided into many picture elements, each picture element is resolved into three colors of red, green, and blue lights to photometrically measure them, and a two-dimensional histogram of hue and saturation values is obtained in accordance with the data obtained through photometry.
- cross sections of the two-dimensional histogram are obtained by cutting the two-dimensional histogram by a feature plane parallel with a coordinate plane including a cross section corresponding to the crest of a specific single mountain of the obtained two-dimensional histogram and also including the hue-value axis and saturation-value axis of the two-dimensional histogram. Therefore, exclusive expansion is applied to the cross sections on the feature plane.
- the exclusive expansion is a processing for expanding each cross section until the interval of cross-section boundaries adjacent on the feature plane decreases to a predetermined value or less.
- each cross section present on the feature plane expands but expansion stops at a boundary between mountains or a trough.
- the two-dimensional histogram is divided into mountains at the cross-section boundary or the mountain contour after the exclusive expansion on the feature plane. Thereby, for a complex shape in which a plurality of mountains are overlapped in a two-dimensional histogram, the two-dimensional histogram can be divided into a plurality of mountains.
- the color original image is divided into regions corresponding to divided groups.
- picture elements included in the same group may be classified into different regions, picture elements included in different regions are not included in the same region. Therefore, the color original image is divided for each region including the picture elements having hue and saturation values within the ranges of hue and saturation values divided by the histogram.
- feature image data can be extracted through region selection because picture elements whose hue and saturation values are kept within a predetermined range are included in one region on the color original image and the data for a selected region expresses feature image data by selecting at least one of the regions expressing the feature of the image.
- the second invention uses hue and saturation values, feature image data can be extracted even if a portion with the hue same as or similar to that of a feature image is mixed.
- a person's face is most remarked for appreciation of a portrait, it is preferable to judge if a divided region of a color original image is a person's face and extract the data for the region decided as a person's face as feature image data.
- the hue of a person's face is similar to that of a flesh-color portion such as ground and trees but the saturation differs in most cases. Therefore, it is also possible to extract person's face data from an image in which faces, ground, and trees are mixed by extracting person's face data in accordance with a two-dimensional histogram of hue and saturation values.
- the third invention divides a color original image into many picture elements to resolve each picture element into three colors of red, green, and blue lights and photometrically measure them, obtains a two-dimensional histogram of hue values and saturation values in accordance with the data obtained through photometry, divides each mountain of the obtained two-dimensional histogram into small mountains respectively having a crest by a feature plane which is parallel with a coordinate plane including the hue and saturation values of the two-dimensional histogram and includes the maximum cross section corresponding to only the crest of one mountain, judges which small mountain each picture element of the color original image is included in to classify each picture element into a group corresponding to each small mountain, obtains the degree of similarity between at least one picture element included in each small mountain and picture elements excluded from the small mountain in accordance with the hue and saturation values, unifies the picture elements excluded from the small mountain into groups in which the obtained degree of similarity corresponds to a high small mountain, divides the color original image for each unified group, and selects at least one of the divided regions to extract the data for
- the third invention it is possible to obtain the degree of similarity between at least one picture element included in each small mountain and picture elements excluded from the small mountain every small mountain by obtaining core picture elements of the color original image corresponding to the crest of each small mountain and judging in the color original image whether or not the distance between the picture elements excluded from the small mountain and each core picture element is minimum.
- the third invention it is also possible to obtain the degree of similarity between at least one picture element included in each small mountain and picture elements excluded from the small mountain every small mountain by obtaining core picture elements of the color original image corresponding to the crest of each small mountain and the degree of similarity between at least one picture element included in each small mountain and picture elements excluded from the small mountain and judging whether or not the distance between the picture elements excluded from the small mountain and each obtained core picture element is minimum.
- the third invention it is possible to extract person's face density data as feature image data by selecting a divided region decided as a person's face.
- each mountain of the obtained two-dimensional histogram is divided into small mountains respectively having a crest by a feature plane which is parallel with a coordinate plane including hue and saturation values of the two-dimensional histogram and includes the maximum cross section corresponding to only the crest of one mountain.
- each mountain of the two-dimensional histogram is divided at the small mountain close to the crest which is a feature portion of only each mountain and the main hue- and saturation-value ranges of each mountain are determined.
- the regions in which picture elements of the color original image are included in the small mountain are divided into regions including picture elements having hue and saturation values within the hue- and saturation-value ranges in accordance with the feature portion of each mountain of the two-dimensional histogram. Then, the degree of similarity between at least one picture element included in each small mountain divided in accordance with hue and saturation values and picture elements excluded from the small mountain is obtained every small mountain.
- the scale for obtaining degree of similarity uses the value statistically determined on a plane consisting of the hue- and saturation-value axes. It is also possible to use the value statistically determined in a feature space consisting of hue, saturation, and lightness. Then, picture elements excluded from a small mountain with the obtained high degree of similarity are unified to a group corresponding to the small mountain. Thus, it is possible to unify picture elements by the degree of similarity on the color original image even for a two-dimensional histogram with a complex shape to be hardly divided because a plurality of mountains are overlapped. Then, the color original image is divided every group unified in the above manner.
- one divided region of the color original image includes similar picture elements in addition to those within the main hue- and saturation-value ranges.
- the data for this region as feature image data by selecting at least one of the divided regions as the region for expressing the feature of the image.
- the degree of similarity can be obtained as shown below.
- a picture element on the color original image corresponding to the crest of each small mountain that is, a picture element corresponding to the crest (peak) of a two-dimensional histogram is obtained as a core picture element.
- hue and saturation values of the core picture element express the feature of each small mountain. It is also possible to obtain the core picture element in accordance with hue and saturation values of each small mountain. Then, the distance between picture elements excluded from the small mountain and each obtained core picture element is obtained in the color original image.
- the third invention it is possible to obtain the degree of similarity as shown below.
- a core picture element corresponding to each small mountain of the two-dimensional histogram is obtained and the distance between picture elements excluded from small mountains and each obtained core picture element is obtained in the color original image.
- the degree of similarity between one or more picture elements included in each small mountain and picture elements excluded from the small mountain is obtained every small mountain. In this case, it may be difficult to judge which small mountain a picture element with a high degree of similarity belongs to in the two-dimensional histogram.
- picture elements excluded from the small mountain are unified to a group corresponding to a small mountain corresponding to the core picture element having the obtained small distance and the obtained high degree of similarity because it is more certain to unify the picture elements to be unified to a group corresponding to a small mountain corresponding to the core picture element with a small distance on the color original image.
- the picture elements to be unified are unified to a small mountain having the minimum distance between the picture element in the color original image and the core picture element corresponding to each small mountain of the two-dimensional histogram in addition to the degree of similarity in accordance with hue and saturation values of picture elements, it is possible to unify the picture elements to be unified to a more certain region on the color original image because the degree of similarity in accordance with distance is added on the color original image even if it is difficult to decide the unification to a specific region only with the degree of similarity of picture elements in the two-dimensional histogram and even if it is difficult to judge which region of the color original image they are unified to because of the two-dimensional histogram with a complex shape.
- the present invention uses hue and saturation values, it is possible to extract feature image data even if a portion whose hue is the same as or similar to that of a feature image is mixed.
- a person's face is most remarked for appreciation of a portrait, it is preferable to judge if a divided region of a color original image is a person's face and extract the data for the region decided as a person's face as feature image data.
- the hue of a person's face is similar to that of a flesh-color portion such as ground and trees but the saturation differs in most cases. Therefore, it is also possible to extract person's face data from an image in which faces, ground, and trees are mixed by extracting person's face data in accordance with a two-dimensional histogram of hue and saturation values.
- the data to be extracted as feature image data can be data other than person's face data.
- an image for a resort or pool includes many regions with the same color as a face in which much skin is exposed around the face and the regions around the face may be combined with the face region. Also there are some portraits in which a person rests his chin. In this case, images with the same color as the face are combined with the face region. Therefore, to extract the face region from the feature of the colors of the color original image, only the face region cannot be extracted but combined regions with the same color as the face are extracted. Thus, it is difficult to automatically extract the density data only for the face.
- the fourth and fifth inventions automatically extract the data only for a person's face which is feature image data from the color original image on a negative film or the like.
- the fourth invention divides a color original image into many picture elements to resolve each picture element into three colors of red, green, and blue lights and photometrically measure them, obtains color regions whose hue is the same as or similar to that of the color original image on the color original image in accordance with the data obtained through photometry, assumes circles or ellipses inscribed to the boundary portion between the obtained color regions, divides the regions obtained by circular or elliptic regions from the largest circle or ellipse in order, and selects at least one of the divided regions to extract the data for the selected region as person's face data.
- the fifth invention divides a color original image into many picture elements to resolve each picture element into three colors of red, green, and blue lights and photometrically measure them, obtains color regions whose hue is the same as or similar to that of the color original image on the color original image, assumes circles or ellipses inscribed to the boundary portion between the obtained color regions to obtain the largest circular or elliptic region and a convex region with a predetermined area or more protruded outward from the circumference of the circle or ellipse and contacting the obtained regions, divides the color regions by the circular region inscribed to the boundary portion between color regions included in the convex region, and select at least one of the divided regions to extract the data for the selected region as person's face data.
- a person's face is most remarked for appreciation of a portrait, it is preferable to extract data for the person's face region from a color original image and use the data as feature image data. Because most person's faces are circular or elliptic, the person's face region is more certainly extracted by preferentially extracting circular regions from the same color regions of the color original image.
- a color original image is divided into many picture elements to resolve each picture element into three colors of red, green, and blue lights and photometrically measure them and color regions with the same or similar hue are obtained on the color original image. Then, circles or ellipses inscribed to the boundary portion between the obtained color regions are assumed and the color regions obtained by circular or elliptic regions are divided from the largest circle or ellipse in order. Thus, it is more certain that the finally-divided region is an independent region of only a face.
- Each divided color region of the color original image is further divided into regions to be more certainly extracted as a face region.
- the data for the selected region expresses feature image data. Therefore, feature image data can be extracted through region selection.
- the face region When the face region contacts a portion other than the face (for example, when a person is photographed from a diagonally upper position at a pool, the face region is buried in his body), the face region may be divided and extracted if the circle inscribed to the color region is preferentially divided. Therefore, for the fifth invention, color regions with the same or similar hue are obtained on a color original image in accordance with the data obtained through photometry as described in the fourth invention.
- circles or ellipses inscribed to the boundary portion between the obtained color regions are assumed to obtain the largest circle or ellipse.
- the color regions are divided by the circular region inscribed to the boundary portion between the color regions included in the convex region.
- a circular or elliptic region to be more certainly extracted as a person's face region can preferentially be divided as a person's face region even if similar color regions contact each other on the color original image and, by selecting at least one of the divided regions, the data for the selected region can be extracted as feature image data.
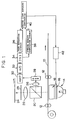
- the automatic printer of this embodiment has carrying rollers 12 for carrying a color negative film 10.
- a light source 14, color correction filter 16 such as a color modulation filter, and diffusion box 18 are arranged in order under the negative film 10 to be carried by the carrying rollers 12.
- a distribution prism for distributing the ray transmitted through the negative film 10 in two ways is arranged above the negative film 10.
- a projective optical system 22, black shutter 23, and color paper (photographic paper) 24 are arranged in order on one optical path distributed by the distribution prism 20, and a projective optical system 26 and a CCD image sensor 28 are arranged in order on the other optical path.
- the CCD image sensor 28 divides one full screen (one frame) of the negative film 10 into many picture elements (e.g. 256 x 256 picture elements) and resolves each picture element into three colors of R (red), G (green), and B (blue) to photometrically measure them.
- the CCD image sensor 28 is connected to a 3x3 matrix circuit 34 for correcting the sensitivity of the CCD image sensor through an amplifier 30 for amplifying the CCD image sensor output and an analog-to-digital (A-D) converter 32.
- the 3x3 matrix circuit 34 is connected to a proper exposure computation circuit 40 through a face extraction circuit 36 consisting of a microcomputer storing the program of a routine to be described later and through an average density computation circuit 38 for computing the average density of one full screen.
- the proper exposure computation circuit 40 is connected to the color correction filter 16 through a driver 42 for driving the color correction filter.
- the ray emitted from the light source 14 passes through the color correction filter 16, diffusion box 18, and color negative film 10, and is distributed by the distribution prism 20 and received by the CCD image sensor 28.
- the black shutter 28 is closed.
- the CCD image sensor 28 receives the ray, it divides one full screen into many picture elements, resolves each picture element into three colors of R, G, and B to photometrically measure them, and outputs a photometric data signal.
- the photometric data signal is amplified by the amplifier 30 before it is converted into a digital signal by the A-D converter 32.
- the sensitivity of the image sensor is corrected by the 3x3 matrix circuit 34 and the digital signal is inputted to the face extraction circuit 36 and the average density computation circuit 38.
- the average density computation circuit 38 computes the average density of one full screen.
- the face extraction circuit 36 estimates the portion of a person's face in one screen and outputs three-color photometric data for R, G, and B.
- the exposure computation circuit 40 computes an exposure by using the three-color photometric data outputted from the face extraction circuit 36 and the average density obtained by the average density computation circuit 38, controls the color correction filter 16 through the driver 42, and performs printing by operating the black shutter 23.
- the exposure correction value for the average density can be obtained by using the average density obtained by the average density computation circuit 38. Unless the exposure correction value is obtained, the average density computation circuit 38 is not always necessary and it is possible to directly obtain an exposure from the three-color photometric data outputted by the face extraction circuit 36.
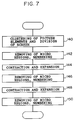
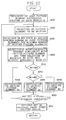
- Fig. 2 shows a face extraction routine by the face extraction circuit 36, in which elimination of noises from inputted three-color photometric data, that is, smoothing is executed in the step 100.
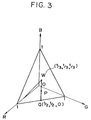
- three-color photometric data for R, G, and B is converted into H (hue value), L (lightness value), and S (saturation value).
- L (R+G+B)/3 (1 )
- S 1-min (r' , g' , b' ) (2)
- H H' /2Pi (3)
- R, G, and B are three-color photometric data specified so that the minimum value is 0 and the maximum value is 1 respectively as shown in the three-dimensional coordinates in Fig.
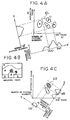
- step 104 a two-dimensional histogram of hue values and saturation values is obtained by using a coordinate system consisting of the hue value axis, saturation value axis, and number-of-picture-element axis which are perpendicular to each other as shown in Fig. 4A.
- the obtained two-dimensional histogram is divided into mountains, that is, the two-dimensional histogram is clustered.
- many picture elements are clustered in accordance with the mountains of the clustered two-dimensional histogram and a screen is divided in accordance with the clustering to extract an region prospective for a person's face among divided regions.
- the region of a face is estimated from the region extracted as a prospect of the face and three-color photometric data for R, G, and B of the region estimated as the face is outputted.
- Fig. 5 shows details of the step 106.
- a region to be evaluated is cut out of the two-dimensional histogram of hue values and saturation values.
- one frame is used as an evaluation region to simplify explanation.
- it is judged if any evaluation region is present.
- the routine is completed because no evaluation region is present.
- X and Y axes are determined to make a histogram for cutting out mountains in the step 124. That is, the evaluation region is rotated around the axis parallel with the number-of-picture-element axis to obtain a position where priority is given to multi-crest property and the mountains become sharpest when viewing mountains of the histogram from the side and determine the X and Y axes on the basis of the position.
- the processing time should be decreased, it is possible to use either X or Y axis in which the variance of the histogram is maximized though the accuracy slightly decreases.
- X axis is determined in the direction perpendicular to the direction when they can be seen and Y axis is determined in the direction perpendicular to the X axis.
- each one-dimensional histogram is made by projecting the two-dimensional histogram on X and Y axes.
- Fig. 4A when viewing the mountains from the direction perpendicular to X axis, three mountains including the mountain marked with the numerals 3, the mountain marked with numerals 1 and 2, and the mountain marked with numeral 4 appear in the one-dimensional histogram about X axis because the mountains marked with numerals 1 and 2 are overlapped like one mountain.
- one mountain appears in the one-dimensional histogram about Y axis because the mountains marked with numerals 1 through 4 are overlapped like one mountain.
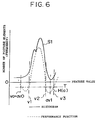
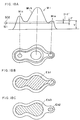
- the histogram is converted into a performance function H (a) by the following expression (5) and mountains are cut out of the histogram about X axis in accordance with the performance function.
- H (a) is the number of picture elements when the value (feature value) in X-axis direction is "a” and "x" is the deviation from the feature value "a”.
- the average value T of the performance function H (a) is obtained and the range (trough and foot existing range) lower than the average value T of the performance function H (a) is obtained. Then, the position where the histogram within this range is minimum is obtained as the trough or foot of the histogram. Then, the histogram is cut out at the obtained trough or foot.
- the broken line in Fig. 6 represents the performance function H (a) obtained from the histogram shown by the continuous line S1.
- the range in which the performance function H (a) is equal to or lower than the average value T about the negative portion is the range in which the feature value ranges between v0 and v1 and between v2 and v3.
- the histogram is cut out at these positions.
- mountains of the histogram about Y axis are cut out similarly to cutting-out of mountains of the histogram about X axis.
- an region where mountains of the one-dimensional histogram about X and Y axes cut out in the above manner on the two-dimensional histogram are overlapped is obtained to cut mountains out of the two-dimensional histogram of hue values and saturation values.
- the region E1 in Fig. 4A shows the mountains cut out in the above manner.
- Step 134 it is judged if the mountain cut out of the two-dimensional histogram has one crest. If not, Steps 124 through 134 are repeated until the mountain cut out of the two-dimensional histogram has one crest.
- the region E2 in Fig. 4C shows the one-crest mountain cut out in the above manner.
- next step 136 the processing for providing cut-out one-crest mountains with a label to identify them (i.e. labeling) is performed.
- step 138 labeled mountains are masked to restart the step 120. The above steps are repeated to divide all regions of the two-dimensional histogram of hue values and saturation values into one-crest mountains.
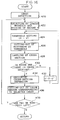
- Fig. 7 shows the details of the step 108.
- the X-axis directional range XR ⁇ Fig. 4C ⁇ of one-crest mountains divided in the above manner and the Y-axis directional range YR ⁇ Fig. 4C ⁇ of them are obtained for each one-crest mountain, it is judged about each picture element of the original image if hue values and saturation values are kept within these ranges in order to cluster picture elements, and the picture elements enclosed by the ranges XR and YR are collected to divide the original image so that the collected picture elements form one region on the original image.
- the divided regions are numbered.
- FIG. 4B shows a divided original image, in which the picture elements in regions marked with numerals 1 through 4 correspond to the picture elements enclosed by one-crest mountains marked with numerals 1 through 4.
- the picture elements belonging to the same one-crest mountain in Fig. 4A are divided into different regions in Fig. 4B. This is because the picture elements having the hue value range and saturation value range of one-crest mountain in Fig. 4A are located in different regions in Fig. 4B.
- micro regions are removed and numbering is retried by judging the area of divided regions.
- small regions connected with a large region are separated from the large region by executing contraction for removing all picture elements at the boundary between regions to remove one layer and expansion for increasing picture elements at the boundary in the background picture element direction to add one layer contrary to contraction.
- numbering is executed by removing micro regions similarly to the step 142 and contraction and expansion similar to the above are executed to separate regions slightly bonded in the step 148 from each other.
- removal of micro regions and numbering are executed similarly to the above.
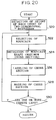
- Fig. 8 shows the details of the step 110.
- one region is selected as a remarked region among the regions extracted by the routine in the step 108 or Fig. 7, the size of the remarked region is standardized by expanding and contracting the remarked region so that the horizontal- and vertical-fillet diameters of the remarked region will have the predetermined value, and the density or brightness value is standardized in accordance with the following expression (6).
- the correlation coefficient "gamma" of the remarked region for previously stored several types (ten types for this embodiment) of standard face images e.g. face images viewed from the front, viewed from the side (right and left respectively), turned downward, and turned upward
- the correlation coefficient is assumed as the feature value.
- standard face images can be the data for only the contour of face or the data obtained by adding the data for internal structures of face (e.g.
- T represents the horizontal- and vertical-fillet diameters of image (both fillet diameters are the same in this case)
- f (x, y) represents the remarked region
- g (x, y) represents the standard face image.
- step 166 it is judged whether or not the remarked region is a person's face through the linear discrimination analysis using the above feature value as a variable and R-, G-, and B-photometric data for the region decided as a face is outputted to the proper exposure computation circuit 40.
- step 168 it is judged if the decision on whether or not all extracted regions belong to a face is completed. If not, the steps 162 through 168 are repeated.
- the correlation coefficient is used as the feature value for the judgment on a person's face.
- the invariant, autocorrelation function, or geometrical invariant obtained from the central moment is also possible.
- the driver 42 computes an exposure control value with the proper exposure Ei to control the color modulation filter 16.
- E i LM i ⁇ CS i ⁇ (DN i -Di) +PB i +LB i +MB i +NB i +K1 +K2 (8)
- LM Magnification slope coefficient which is previously set in accordance with the enlargement ratio determined by the type of negative
- CS Color slope coefficient prepared for each type of negative, which includes the under- and over-exposure types. It is decided whether the average density of the frame to be printed is under or over the standard negative density before the under- or over-exposure type is selected.
- DN Standard negative density value
- D Average density value of print frame
- PB Correction balance value for standard color paper, which is determined in accordance with the type of the color paper
- LB Correction balance value for standard printing lens, which is determined in accordance with the type of the printing lens
- MB Correction value (master balance value) for fluctuation of the printing light source or change of paper developing performance
- NB Negative balance (color balance) value determined by the characteristic of negative film
- K2 Color correction value
- K1 Density correction value shown by the following expression Where, Ka and Kb are a constant and FD is the average density of face region.
- face data can also be extracted from an image in which a face, ground, and tree having similar hue are mixed.
- the second embodiment of the present invention is described below. This embodiment is made by modifying the method of the first embodiment for judging whether a face or not, which judges whether the remarked region is a face or not on each prospective region extracted in the step 108 by using the shape and color information of the remarked region and those of adjacent regions which are located around the remarked region.
- Fig. 9 shows the routine for judging a face or not.
- the step 170 it is judged whether or not a region corresponding to the hand or foot of a person is extracted by judging if a region which has the hue value and saturation value same as or close to those of the remarked region around the remarked region and whose size (capable of adopting, for example, horizontal or vertical fillet diameter) is 25 to 100% of that of the remarked region is extracted.
- the range to be judged should be a range in which the body of a person is present, in order words, a range having the radius five times as large as the diameter of the circle with the same area as that of the remarked region. If image information is discontinued, the objective range should be up to the position where image information is discontinued in the discontinuous direction.
- the flag Fa is set in the step 172.
- next step 174 it is judged whether or not a region of the body of a person is extracted by judging if a region connected with the remarked region is present and the region corresponds to the body of the person. Because the body of a person is normally symmetric to the axis for the right and left and asymmetric for the top and bottom and connects with his face, it is possible to decide whether or not the region corresponding to the body of the person is present by judging if a region connected with the remarked region is present and it is symmetric to the axis for the right and left and asymmetric for the top and bottom. When the region corresponding to the body of the person is present, the flag Fb is set in the step 176.
- the head is adjacent to a face and shows an approximate ellipse when it is combined with the face. Because a cap, helmet, or hair is normally present on the head, the hue or saturation of the head is different from that of the face.
- the flag Fc is set in the step 180.
- the step 182 it is judged if the flags Fa and Fb are set. If so, in other words, when a region corresponding to the hand or foot is present around the remarked region and the region connected with the remarked region is a region corresponding to the body, it is decided that the remarked region is a person's face and the R-, G-, and B-photometric data for the remarked region is outputted in the step 188. If not in the step 188, it is judged in the step 184 if the flags Fb and Fc are set.
- the remarked region is a person's face and the step 188 starts. If not in the step 184, it is judged in the step 186 if the flags Fa, Fb, and Fc are set. If so, it is decided that the remarked region is a person's face and the step 188 starts. In the next step 190, the flags Fa, Fb, and Fc are reset in order to decide the remarked region.
- the remarked region is a hand, foot, body, or head in this embodiment, it is also possible to previously store a plurality of standard hand or foot images, a plurality of standard body images, and a plurality of standard head images and compare the remarked region with these standard images for decision as described in the above first embodiment.
- This embodiment is made by modifying the method of the first embodiment for judging a face or not, which converts an extracted region into a line graphic to judge whether or not the remarked region is a face in accordance with the shape of regions around the remarked region and that of the remarked region.
- Fig. 10 shows a face decision routine in accordance with line graphic conversion, in which each region is converted into a ling graphic by extracting line information from the extracted region for one screen in the above manner.
- it is judged whether or not a line graphic showing the shoulder of a person is present by comparing the previously stored standard line graphic showing the person's shoulder with the line graphics for one screen. Unless the line graphic showing the should is present, this routine is completed.
- the line graphic showing the should it is judged if any line graphic is present on the former line graphic. If so, the latter line graphic is assumed as a remarked line graphic to judge if any line graphic showing a head (e.g. cap, hair, or helmet) is present on the top of the remarked line graphic in the step 206. If so in the step 206, the remarked line graphic has a large probability that the remarked line graphic is a face line graphic because the line graphic showing the face is present at the top of the remarked line graphic and the line graphic showing the shoulder is present at the bottom of the remarked line graphic. Therefore, it is judged in the step 208 if the contour of the remarked line graphic is similar to that of the standard face line graphic.
- step 208 it is decided in the step 210 that the remarked line graphic is a face and the R-, G-, and B-photometric data for the region corresponding to the remarked line graphic is outputted. If not in the step 208, however, it is decided in the step 212 that the lower portion of the line graphic at the top of the line graphic showing the shoulder is a face and R-, G-, and B-photometric data for the portion is outputted.
- face data can also be extracted from an image including a face, ground, and tree with similar hue. Moreover, because a face is not decided by using the microstructure of the face, the face can be decided with a short computation time even if the resolution of the image to be decided is low.
- the fourth embodiment of the present invention is described below in detail. This embodiment is made by modifying the contents of the step 110 of the first embodiment in Fig. 2, which further divides the color region extracted as a prospect of a face in the step 110 into circular or elliptic regions to divide at least the face region from other regions, estimates the face region in accordance with the divided regions, and outputs R-, G, and B-photometric data of the region estimated as a face.
- Fig. 11 shows the details of the step 110 of this embodiment.
- Fig. 11 is explained by using an image in Fig. 12A covering a wide range of a color region with the color same as or similar to a face.
- one region is selected as a remarked region among the regions extracted by the routine in the step 108 or Fig. 7 (see Fig. 12A).
- a core for decomposing the selected remarked region is obtained by contracting the remarked region. That is, contraction is repeated to eliminate boundary picture elements of the remarked region and a finally-left point or line region is used as the core.
- the line region is defined as a plurality of continuous points (picture element or collection of picture elements) or the line L1 as shown in Fig. 12B.
- An objective image has the above core or a certain area because it is not the continuous system but the discrete system since it is based on the data obtained by photometrically measuring an original image by the CCD image sensor 28. More than one core may finally be left depending on the shape of the objective image. In this case, the region with the minimum area is determined as the core. When regions with the same area are left, any one of them is selected as the core.
- the largest circle or ellipse inscribed to the remarked region is obtained around the core obtained in the above manner. That is, by performing expansion around the core by the number of times in which contraction is repeated to obtain the core, the core can be obtained as an inscribed circle when it is a point and as an inscribed ellipse when it is a line (morphologic filter).
- the step 266 starts labeling for attaching a label to the obtained largest circle (or ellipse consisting of the circle) to identify it.
- the region BL1 of the labeled circle or ellipse is masked and the step 270 is started.
- the regions BL1 through BL10 are divided in order by large circles as shown in Figs. 12B through 12F.
- the step 272 starts.
- at least one of the circles or ellipses divided by the routine of the first embodiment described in Fig. 8 is selected to estimate a face region and R-, G-, and B-photometric data of the region estimated as a face is outputted to the proper exposure computation circuit 40.
- the proper exposure computation circuit 40 computes the proper exposure Ei in accordance with the expression (8) and the driver 40 controls the color modulation filter 16 in accordance with the computed proper exposure.
- the color region can further be divided at the circular region having a high probability of the face region.
- the data only for the face region can be extracted at a high probability from an image including a face, body, hands, ground, and trees with similar hue and saturation.
- B Circular component
- the value "ni" for a size to be decomposed can be decided by properly selecting the value of "k”.
- the following expression (15) can be used instead of the above expression (14).
- the relationship between the above circular component B and X region can be expressed as follows: Where, The fifth embodiment of the present invention is described below by referring to the flow chart shown in Fig. 13.
- This embodiment is made by modifying the contents of the step 110 of the first embodiment in Fig. 2, which most preferably divides a face region from a region contacting the face region. That is, the face region in a portrait is present around the body in most cases. Therefore, when a color region including the face region has a plurality of convex regions, the color region is divided from a circular region inscribed to the convex portion and the divided circular region is selected to preferentially divide a prospective region capable of estimating the circular region as the face region.
- one region is selected among the regions extracted by the routine in the step 108 or Fig. 7 ⁇ see Fig. 14A ⁇ . Then, similarly to the fourth embodiment, the selected remarked region is contracted to obtain the core La of the remarked region ⁇ see Fig. 14B ⁇ .
- the largest circle or ellipse Ba inscribed to the remarked region is obtained around the core La obtained in the above manner.
- step 386 the core La obtained in the above manner is excluded (masked) from the remarked region as shown in Fig. 14C.
- step 388 contraction and expansion are performed like the above mentioned to obtain the largest circle or ellipse Bb in which the core La is inscribed to the masked remarked region ⁇ see Fig. 14D ⁇ .
- the size of the convex portion outside the remarked color region is judged by expanding each of thus-obtained inscribed circles or ellipses Ba and Bb within the range of approximately predetermined (e.g. 1 through 3) picture elements and judging if the region protruded from the remarked region has the size of predetermined value or more. That is, it is judged that larger region protruded from the remarked region among expanded regions is more convex.
- the step 394 is started to perform labeling for identifying the inscribed circle or ellipse Bb before the step 396 is started.
- the obtained convex portion has the size of predetermined value or less, labeling for identifying the largest circle (or ellipse consisting of the circle) inscribed to the remarked region is performed in the step 392 similarly to the fourth embodiment before the step 396 is started.
- step 396 the circle or ellipse labeled in the step 392 or 395 is masked. Then, the step 398 is started. In the step 398, it is judged if division of every extracted region by circles or ellipses is completed.
- the steps 380 through 398 are repeated.
- at least one of the divided circles or ellipses is selected to judge the face region similarly to the first embodiment and R-, G-, and B-photometric data for the region decided as a face is outputted to the proper exposure computation circuit 40.
- this embodiment preferentially divides a large circular region inscribed to the convex portion around a color region or a circular region having a high probability of a face region from the remarked region, data for the face region can be extracted by more certainly dividing only the face region even for the color region in which the body and face contact each other.
- the above embodiment describes a case in which the color region is divided in accordance with a two-dimensional histogram of hue and saturation values.
- this embodiment is not restricted to the case. It is also possible to divide the color region in accordance with a histogram of only hue values. Moreover, the color region can be divided not only by a histogram but by other feature value of an original image.
- Fig. 15 shows a face extraction routine of the face extraction circuit 36 of this embodiment. Because Fig. 15 is the same as Fig. 2, the corresponding portions are provided with the same symbol. In the step 106' in Fig. 15, however, many picture elements are clustered in accordance with the obtained two-dimensional histogram, a screen is divided through clustering, and a prospective region of a person's face is extracted from the divided regions.
- evaluation is performed with a two-dimensional histogram of the entire frame to simplify the description.
- Fig. 16 shows the details of the step 106' in Fig. 15.
- the crest of each mountain of a two-dimensional histogram is detected by slowly and parallely displacing a plane parallel with the coordinate plane consisting of hue- and saturation-value axes.
- the plane parallel with the coordinate plane consisting of hue- and saturation-value axes is parallely displaced in the direction in which the number of picture elements increases from 0.
- the cross-sectional area of each mountain of the two-dimensional histogram cut out by the plane decreases and comes to 0 at the crest of the mountain.
- the point where the cross-sectional area comes to 0 is judged as the crest of the mountain. That is, when taking the two-dimensional histogram in Fig. 17C as an example, each closed region which is a cross-sectional region of the mountain sliced by the plane ST1 is present on the plane ST1 (with "n" picture elements) parallel with the coordinate plane consisting of hue- and saturation-value axes as shown in Fig. 17B.
- the cross-sectional region of the mountain M2 of the two-dimensional histogram corresponds to the closed region Ea1.
- the region Ea1 disappears on the plane ST2 made by parallely displacing it in the direction in which the number of picture elements increases (positive direction of the number-of-picture element axis).
- the point where the closed region disappears (or when it comes to 0) is the crest of the mountain M2.
- the number of crests of a mountain is counted in the above manner.
- the height V of the mountain is read by reading the plane height when the crest is detected (i.e. the number of picture element s or frequency).
- the lowest mountain is selected in a two-dimensional histogram. That is, as shown in Fig. 18A, the lowest mountain M1a is selected in the mountain M1. Then, the height V of the selected mountain is taken in. In this case, a value smaller than the mountain height V (e.g. value "v" which is the predetermined rate of the mountain height V) is obtained. The value "v" can use a previously set value.
- the threshold (V - v) for cutting out the selected mountain is set.
- the two-dimensional histogram is cut out by the plane SI1 determined by the set threshold.
- the cross section serves as the closed region Eb1 shown as a hatched area in Fig. 18B.
- the processing (labeling) for attaching a label to each cross section is performed to identify the cut-out mountain.
- the threshold and the plane height for cutting out a mountain increase. Because of increase of the plane height, the closed region Eb1 is divided into the closed regions Eb2 and Eb3 as shown in Fig. 18C. Thus, only the crest of the lowest mountain corresponds to the close region Eb2. Also, the plane from which the closed region Eb2 corresponding to only the lowest mountain M1a is obtained is determined as a feature plane. The value "v'" is set so that it will be smaller than the value "v". Thus, the steps 24 through 430 are repeated until the crest of the lowest mountain corresponds to a cross section one by one.
- step 434 exclusive expansion is performed for all closed regions of the cross-sectional portion of the two-dimensional histogram on the plane (feature plane) in accordance with the threshold of the lowest mountain.
- the exclusive expansion is described below by referring to Fig. 19.
- the feature plane is divided into a plurality of planes by the unit region consisting of the predetermined hue and saturation values.
- all unit regions of the closed region (hatched portion in Fig. 19) of the cross-sectional portion of the two-dimensional histogram cut out by the feature plane are provided with the density value "1" and unit regions belonging to regions other than the above are provided with the density value "0".
- the unit regions provided with the density value "0" are exclusively expanded so that their density value comes to "1".
- the exclusive expansion is performed from the circumferential region (boundary portion) of each cross section.
- an evaluation region having the size of the 3x3 unit region is used as the region for evaluating unit regions provided with the density value "0". Then, the unit region to be evaluated is set to the center of the evaluation region.
- the unit region to be evaluated is provided with the density value "1".
- the area of the closed region is expanded by applying the above processing to all unit regions provided with the density value "0" on the feature plane. All closed regions on the feature plane are expanded by repeating the above processing. Expansion is completed when the interval between the boundaries of close regions comes to a predetermined value (e.g. one-unit region). That is, the unit region in which the interval between the boundaries of closed regions equals the predetermined value is determined as the density value "0".
- a predetermined value e.g. one-unit region
- the obtained two-dimensional histogram is referenced to read the number of picture elements in the unit region to be evaluated in the two-dimensional histogram.
- the read number of picture elements is one or less, exclusive expansion is not performed because expansion is unnecessary. Therefore, the contour of the mountain can be obtained by the obtained trough and foot of the mountain.
- a two-dimensional histogram can be divided into mountains with one crest by performing exclusive expansion and obtaining the contour of mountains.
- the color region of an original image corresponding to a selected crest is cut out. That is, the original image corresponding to the hue- and saturation-value ranges obtained through the above exclusive expansion is divided and cut out.
- the step 438 it is judged if any crest remains. If two or more crests remain, the step 422 is restarted. When cutting out of color regions of the original image corresponding to all crests is completed, this routine is completed. When one crest remains, the processing (labeling) for attaching a label to a cross section is performed without repeating the above processing because the hue- and saturation-value ranges are already obtained and the next processing is started. All color regions of the original image can be divided and cut out by repeating the processing for dividing and cutting the original image.
- the original image can easily he divided even if it is clustered into complex shapes because the crests of mountains of a two-dimensional histogram are detected, mountains of the two-dimensional histogram are cut out by corresponding to the crests, the cut-out cross sections are exclusively expanded, and the two-dimensional histogram is divided by the expanded cross sections.
- this embodiment can use the judging methods described in the second, third, fourth, and fifth embodiments in addition to the judging method using the contour and internal structure of the region described in the first embodiment.
- Fig. 20 shows the details of the step 106 of this embodiment.
- the crest of each mountain of a two-dimensional histogram is detected by slowly and parallely displacing a plane parallel with the coordinate plane consisting of hue- and saturation-value axes.
- the plane parallel with the coordinate plane consisting of hue- and saturation-value axes is parallely displaced in the direction in which the number of picture elements increases from 0.
- the cross-sectional area of each mountain of the two-dimensional histogram cut out by the plane decreases and comes to 0 at the crest of mountain.
- the point where the cross-sectional area comes to 0 is judged as a crest of mountain. That is, when taking the two-dimensional histogram in Fig.
- each closed region which is a cross section of the mountain sliced by the plane ST1 is present on the plane ST1 (with "n" picture elements) parallel with the coordinate plane consisting of hue- and saturation-value axes as shown in Fig. 17B.
- the mountain M2 of the two-dimensional histogram corresponds to the closed region Ea1.
- the region Ea1 disappears on the plane ST2 made by parallely displacing it in the direction in which the number of picture elements increases.
- the point where the closed region disappears (or when it comes to 0) is assumed as the crest of the mountain M2 to count the number of crests of a mountain.
- the height V of the mountain is read by reading the plane height when the crest is detected (i.e.
- a remarked mountain is selected in the two-dimensional histogram and the height of the mountain is taken in.
- the remarked mountain can be any one of the mountains of the two-dimensional histogram, the mountain M1 (Fig. 21) including the highest mountain M1b is selected for this embodiment.
- the maximum cross section corresponding to only the crest of the remarked mountain is obtained.
- the feature plane SI determined by the height V of the highest mountain M1b in the mountain M1 is slowly and parallely displaced in the direction in which the mountain height decreases.
- the height for parallely displacing the feature plane is determined by the threshold "v".
- the threshold "v” decreases from the mountain height V at the predetermined rate.
- the value decreasing at this predetermined rate can use a pre-set value.
- the two-dimensional histogram is cut out by the feature plane SI determined by the threshold "v".
- Parallel displacement of the feature plane is completed when the interval between the boundaries of the remarked closed region and other closed region reaches a predetermined value.
- the threshold which is the height of the above plane decreases to a predetermined value (e.g. one picture element value) or less. Therefore, the maximum cross section up to the foot of a mountain with one crest can be obtained.
- the cross section corresponding to the highest mountain M1b comes to the closed region Eb1 which is shown as the hatched portion in Fig. 21C.
- the processing (labeling) for attaching a label to the cross section of the remarked mountain is performed to identify the cut-out mountain.
- the labeled mountain is masked to judge in the step 530 if any crest remains. If so, the step 522 is restarted. Then, the above steps are repeated to divide all regions of the two-dimensional histogram of hue and saturation values into small mountains with one crest.
- Fig. 22 shows the details of the step 108 in Fig. 2.
- the picture elements of an original image expressing the features of small mountains corresponding to each cross section are obtained as a core picture element in accordance with hue and saturation values within the hue- and saturation-value ranges of each cross section of a two-dimensional histogram on the feature plane specified by the threshold "v" of each mountain for obtaining the maximum cross section.
- This embodiment uses the picture elements on the original image corresponding to hue and saturation values including many picture elements (of mountain crest) in the mountain cut out by the feature plane specified by the threshold of each mountain ⁇ see symbols Z1 through Z6 in Fig. 23B ⁇ .
- More than one core picture element may be present on the original image corresponding to hue and saturation values of the crest of one mountain of a two-dimensional histogram.
- this embodiment uses one typical picture element (e.g. picture element at the position determined by an average value) as the core picture element corresponding to the crest of one mountain. It is also possible to obtain the hue and saturation values of the core picture element Z by computing the average values of hue and saturation values within the hue- and saturation-value ranges of the cross section on the feature plane of each mountain.
- Fig. 23B shows an example in which an original image is divided and the picture elements of each region provided with symbols FD1 through FD6 correspond to the picture elements included in the cross sections provided with symbols SD1 through SD6 of each mountain. Then, the picture element (picture element to be unified) P1 other than the picture elements clustered on the original image is selected.
- the picture element P1 corresponds to the point P1 shown in Fig. 23A on the two-dimensional histogram.
- the distances L1 through L6 between the core picture elements Z1 through Z6 and the picture element P1 to be unified are obtained on the original image and the label MD1 is given to the mountain corresponding to the core picture element 72 having the minimum distance L2 among these obtained distances L so that it will be identified as the mountain M1b as shown in Fig. 23B.
- the degree of similarity between each of the core picture elements Z1 through Z6 and the picture element P1 to be unified is obtained on the original image and the labels MD2 and MD3 are given to the mountain corresponding to the core picture elements Z with the highest degree of similarity and the next mountain so that the former can be discriminated from the latter.
- the similarity between the core picture element and the picture element to be unified is judged by the number of and hue and saturation values of the picture elements included in the small mountains (cross sections) of the two-dimensional histogram corresponding to the core picture elements Z.
- the degree of similarity can be judged by the T-value obtained through the T-test of the expression (17) shown below.
- the degree of similarity between the picture element to be unified and the mountain corresponding to the core picture element increases as the T-value obtained through the T-test decreases. Therefore, it is preferable to unify picture elements with a mountain having smaller T-value. It is also possible to obtain the degree of similarity by other method without using the T-test.
- comparison with the picture element to be unified can be made through statistical processing in accordance with the average value of hue and saturation values of the picture element corresponding to each mountain, the shape (distribution of two-dimensional histogram) of each mountain, the number of picture elements of each mountain.
- N Number of picture elements corresponding to cut-out mountains
- S2 Variance of picture elements corresponding to cut-out mountains on feature plane
- y Average of picture elements corresponding to cut-out mountains on feature plane
- xm Average of picture elements to be unified
- Picture elements to be unified is unified to the mountain with a small distance and high degree of similarity on the original image by the obtained distance L and T-value indicating degree of similarity on the obtained original image.
- the shaded portion (hatched portion Cx) of a face and the portion of the tree (hatched portion Tx) having hue and saturation values similar to the shaded portion of the face shown in Fig. 24A may come to a region (Ar) close to the trough where a plurality of mountains are overlapped on the two-dimensional histogram as shown in Figs. 24B and 24C. Therefore, it is not clear whether the unified picture element Pz included in the region Ar belongs to the mountain corresponding to the face portion (Cp) or that corresponding to the tree portion (Tp).
- the picture elements present on the original image frequently have a high degree of similarity with the region of the image around the picture elements. Therefore, in this case, the original image can be clustered by unifying the picture elements to a mountain belonging to a nearer region on the original image.
- the picture element P1 to be unified is unified to the color region of the mountain as a picture element included in the mountain provided with the label MD1 in the step 644.
- the picture element P1 to be unified is unified to the color region of the mountain as a picture element included in the mountain provided with the label MD1 in the step 648.
- the mountain provided with the label MD1 does not coincide with the mountain provided with the label MD2 or MD3
- the picture element to be unified is unified preferentially to the color region of the mountain provided with the label MD2 with a high degree of similarity (step 646).
- next step 650 it is judged if all picture elements are unified. If not, the step 634 is restarted to unify the picture elements of the original image. By repeating unification of the picture elements of the original image, all color regions of the original image can be clustered. When unification of all picture elements is completed, unified color regions of the original image are cut out in the step 652. That is, the original image is divided and cut out so that divided original images will correspond to each hue region obtained through the above unification and this routine is completed.
- an original image can most preferably be divided even if a two-dimensional histogram cannot simply be divided because the shape of each small mountain differs when the two-dimensional histogram has a complex shape in which a plurality of mountains are overlapped.
- the picture elements to be unified are unified to color regions by obtaining the degree of similarity and distance on the original image.
- picture elements are unified each other.
- regions can also be unified each other.
- This embodiment can use the judging methods described in the second, third, fourth, and fifth embodiments in addition to the judging method using the contour and internal structure of the region described in the first embodiment.
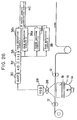
- Fig. 25 shows a modification made by applying the present invention to an exposure determination apparatus separated from a printer or printer processor.
- portions corresponding to those in Fig. 1 are provided with the same symbol and their description is omitted.
- the average density computation circuit 38 is not always necessary. Instead, it is possible to use an integrating transmission-density detection circuit for detecting LATD of the entire screen.
- Fig. 26 shows a face extraction circuit obtained by constituting the face extraction circuit in Fig. 25 by a plurality of face extraction circuits 361, 362,..., and 36 n for computing an exposure through parallel processing.
- the face extraction circuits 361, 362,..., and 36 n read an image in accordance with the time chart in Fig. 27, compute an exposure, and output the computed result.
- t1 is the image read time for one frame
- t2 is the exposure computation time for one frame
- t3 is the exposure-amount computation result transfer time, where t2 >> t1 and t2.
- the face extraction circuit 361 reads images for one frame for the time of t1, computes an exposure for the time of t2, and transfers the computation result for the time of t3.
- the film is advanced by one frame, reading of images for one frame is started by the face extraction circuit 362, exposure-amount computation by the face extraction circuit 361 and image read by the face extraction circuit 362 are simultaneously performed, and subsequently parallel processing is continued by the face extraction circuits 363, 364,.... and 36 n .
- Ts m (t1+t2+t3) + (n-1) t1
- Ts m ⁇ n (t1+t2+t3) Therefore, the speed can be increased by Ts/Tp times.
- Ts/Tp is shown as follows: This parallel-processing system can also be applied to the printer in Fig. 1.
- the present invention can also be applied not only to determination of exposure of a photo-printing equipment but to determination of exposure of a digital color printer, determination of copying conditions of a copying machine, determination of exposure of a camera, determination of display conditions of a CRT screen, and determination of exposure when a hard copy is made with magnetic image data.
Abstract
Description
- The present invention relates to a method of extracting feature image data and a method of extracting person's face data, more particularly to a method of extracting feature image data and a method of extracting person's face density data used to copy a color original image to a color copying material or black-and-white copying material.
- A person's face is most remarked for appreciation of a portrait. To finish a high-quality photo, it is necessary to print the person's face with a proper color.
- Conventionally, the face region in the original image of a color film is specified by a light pen to extract the data for the density of a person's face and the exposure is determined so that the face color is properly printed according to the extracted density data. This type of art is disclosed in the official gazettes of Japanese Patent Application Laid-Open Nos. 62-115430, 62-115431, 62-115432, 62-189456, 62-189457, 63-138340, and 63-178222.
- However, the above related art has a problem that printing requires a lot of time because the operator has to specify the face region for each image by a light pen. Moreover, it is difficult to realize automation because the operator has to visually specify the face region.
- Official gazettes of Japanese Patent Application Laid-Open Nos. 52-156624, 52-156625, 53-12330, 53-145620, 53-145621, and 53-145622 disclose the following method of extracting the data for person's face by extracting flesh-color data.
- That is, an color original image is divided into many photometric points, each photometric point is resolved into three colors of R (red), G (green), and B (blue) to photometrically measure them, and it is judged if the color of each photometric point calculated from photometric data is kept within the flesh-color range. Then, a cluster (group) of the photometric points decided as a color within the flesh-color range is used for face density data.
- For this method, however, because colors within the flesh-color range are assumed as face density data, flesh color of ground, trunk of a tree, and clothes, or portions other than face having a color similar to flesh color are extracted as face density data. Moreover, when the same object is photographed under the same condition, it may not be possible to automatically extract face density data if the type of film differs because the color tone differs in photographed images. Further more, when the color of a light source for illuminating an object differs, it may not be possible to automatically extract face density data if the color of the light source differs because the color tone of a photographed image differs (for example, an image photographed by using a fluorescent light for the light source shows green tone).
- To solve the problem caused by the difference of light-source color, it is only necessary to correct the light-source color before extracting photometric data within the flesh-color range. The light source can roughly be classified into sunlight, fluorescent light, and tungsten light. The color tone of sunlight depends on the season and time zone and also on direct or indirect light even if the season and time zone are the same.
- Artificial light such as fluorescent light has various color tones because products are diversified. Therefore, it is difficult to correct the light source by specifying the type of light source for each light source. Even if light source correction can completely be performed, it is impossible to avoid extracting flesh color of ground and trunk of a tree or portions with a color similar to flesh color. Therefore, it is impossible to take action when the type of film differs.
- The present invention is made to solve the above problem and it is the object of the present invention to provide a feature image data extraction method for automatically extracting only feature image data such as person's face data at a high accuracy the color original image on a negative film or the like and a person's face data extraction method for automatically extracting only person's face data at a high accuracy from it.
- To achieve the above objects, the first invention divides a color original image into many picture elements to resolve each picture element into three colors of red, green, and blue lights and photometrically measure them, obtains the histogram of hue values in accordance with the data obtained through photometry, divides the obtained histogram into mountains, classifies picture elements into groups corresponding to the divided mountains by judging which divided mountain each picture element of the color original image belongs to, dividing the color original image for each group, and selecting at least one of the divided regions to extract the data for the selected region as feature image data.
- For the first invention, it is possible to obtain a two-dimensional histogram on hue values and saturation values in accordance with the data obtained through photometry in stead of a one-dimensional histogram on hue values, divide the obtained two-dimensional histogram into mountains, judge which divided mountain each picture element of the color original image belongs to in order to divide many picture elements into groups corresponding to the divided mountains, divide the color original image for each group, and select at least one of the divided regions to extract the data for the selected region as feature image data.
- For the first invention, it is possible to extract person's face density data as feature image data by judging if a selected divided region is a person's face and selecting the region decided as a Person's face.
- For the first invention, a color original image is divided into many picture elements to resolve each picture element into three colors of red, green, and blue lights and photometrically measure them, and a histogram of hue values is obtained in accordance with the data obtained through photometry. Then, the obtained histogram is divided into mountains by separating them at the trough or the foot of mountain. Thereby, the hue value range of each mountain can be specified. Then, it is decided which divided mountain each picture element belongs to by judging which hue value range the hue value of each picture element belongs to and many picture elements are classified into groups (clusters) corresponding to the divided mountains. Then, the color original image is divided into regions corresponding to the divided groups. In this case, though picture elements included in the same region may be divided into different regions, picture elements included in different groups are not included in the same region. Therefore, the color original image is divided for each region including picture elements having hue values within the hue value range divided by the histogram. Resultingly, picture elements with hue values kept within the predetermined range are included in one region on the color original image. Thus, feature image data can be extracted by selecting at least one region showing the feature of the image because the data for the selected region shows feature image data.
- The color tone of color original image is uniformly changed in the whole screen due to difference of the type of film or light source, change of film characteristic with time, or difference between developed films. However, divided regions of the color original image are not changed due to change of color tone because groups consisting of picture elements of an image are stored though only the position on the histogram changes even if the color tone changes. Therefore, the present invention makes it possible to extract person's face density data even if the color tone or color range of the color original image changes due to difference of the type of film or light source, change of film characteristic with time, or difference between developed films.
- If the color original image is divided in accordance with a histogram of only hue values when the color tone of a feature image which is the featured portion of the image is the same as or similar to the color tone of other portion, it may not possible to discriminate the feature image from other portion. Therefore, the saturation value is adopted in addition to the hue value to obtain a two-dimensional histogram of hue values and saturation values, the two-dimensional histogram is divided into mountains to divide the color original image similarly to the above procedure, and at least one of the divided regions is selected to determine an exposure in accordance with the extracted feature image data.
- Therefore, by using hue values and saturation values, feature image data can be extracted even if portions having a color tone same as or similar to the feature image are mixed.
- Because a person's face is most remarked for appreciation of a portrait, it is preferable to judge if a divided region of a color original image is a person's face and extract the data for the region decided as a person's face as feature image data. In this case, though feature image data or person's face data can be extracted in accordance with the histogram of hue values, it is also possible to extract person's face data in accordance with the two-dimensional histogram of hue values and saturation values. The color tone of person's face is similar to that of flesh color portions of ground and tree. However, the saturation of it is different from that of them in most cases. Therefore, person's face data can also be extracted from an image in which a person's face, ground, and trees are mixed, by extracting person's face data in accordance with the two-dimensional histogram of hue values and saturation values.
- The data to be extracted as feature image data can be data other than person's face data.
- Because it is rare that the shape of mountains of the two-dimensional histogram of hue and saturation values obtained in accordance with photometric data is simple, it may be difficult to divide the obtained two-dimensional histogram into mountains if each mountain has a complex shape. The following second and third inventions divide even a two-dimensional histogram consisting of a complex shape into mountains.
- The second invention divides a color original image into many picture elements to resolve each picture element into three colors of red, green, and blue lights and photometrically measure them, obtains a two-dimensional histogram of hue values and saturation values in accordance with the data obtained through photometry, cuts the two-dimensional histogram by a feature plane parallel with a coordinate plane including a cross section corresponding to the crest of a specific single mountain of the obtained two-dimensional histogram and also including the hue-value axis and saturation-value axis of the two-dimensional histogram to obtain cross sections of the two-dimensional histogram, executes the exclusive expansion for expanding each cross section until the interval between cross-section boundaries adjacent on the feature plane decreases to a predetermined value or less or until the frequency of the boundaries decreases to a predetermined value close to the minimum value or a predetermined value close to the minimum value or less to divide the two-dimensional histogram for each mountain at the cross-section boundaries after exclusive expansion, judges which divided mountain each picture element of the color original image belongs to in order to divide picture element s into groups corresponding to divided mountains, divides the color original image for each group; and selects at least one of the divided regions to extract the data for the selected region as feature image data
For the second invention, it is possible to extract person's face density data as feature image data by selecting a divided region decided as a person's face. - For the second invention, a color original image is divided into many picture elements, each picture element is resolved into three colors of red, green, and blue lights to photometrically measure them, and a two-dimensional histogram of hue and saturation values is obtained in accordance with the data obtained through photometry.
- For the second invention, cross sections of the two-dimensional histogram are obtained by cutting the two-dimensional histogram by a feature plane parallel with a coordinate plane including a cross section corresponding to the crest of a specific single mountain of the obtained two-dimensional histogram and also including the hue-value axis and saturation-value axis of the two-dimensional histogram. Therefore, exclusive expansion is applied to the cross sections on the feature plane. The exclusive expansion is a processing for expanding each cross section until the interval of cross-section boundaries adjacent on the feature plane decreases to a predetermined value or less. Thus, each cross section present on the feature plane expands but expansion stops at a boundary between mountains or a trough. When the frequency of the cross-section boundary to be expanded or the picture element value decreases to the minimum value or a predetermined value close to the minimum value or less, expansion stops. Thus, expansion of cross sections stops at the foot of each mountain. Therefore, the contour of a single mountain is obtained by the trough and foot of the mountain.
- The two-dimensional histogram is divided into mountains at the cross-section boundary or the mountain contour after the exclusive expansion on the feature plane. Thereby, for a complex shape in which a plurality of mountains are overlapped in a two-dimensional histogram, the two-dimensional histogram can be divided into a plurality of mountains.
- Then, by judging which hue- and saturation-value ranges of each divided mountain the hue and saturation values of color original image picture elements belong to, it is judged which divided mountain each picture element belongs to and many picture elements are classified into regions corresponding to divided groups (clusters). Then, the color original image is divided into regions corresponding to divided groups. In this case, though picture elements included in the same group may be classified into different regions, picture elements included in different regions are not included in the same region. Therefore, the color original image is divided for each region including the picture elements having hue and saturation values within the ranges of hue and saturation values divided by the histogram. Thus, feature image data can be extracted through region selection because picture elements whose hue and saturation values are kept within a predetermined range are included in one region on the color original image and the data for a selected region expresses feature image data by selecting at least one of the regions expressing the feature of the image.
- Because the second invention uses hue and saturation values, feature image data can be extracted even if a portion with the hue same as or similar to that of a feature image is mixed.
- Because a person's face is most remarked for appreciation of a portrait, it is preferable to judge if a divided region of a color original image is a person's face and extract the data for the region decided as a person's face as feature image data. The hue of a person's face is similar to that of a flesh-color portion such as ground and trees but the saturation differs in most cases. Therefore, it is also possible to extract person's face data from an image in which faces, ground, and trees are mixed by extracting person's face data in accordance with a two-dimensional histogram of hue and saturation values.
- The third invention divides a color original image into many picture elements to resolve each picture element into three colors of red, green, and blue lights and photometrically measure them, obtains a two-dimensional histogram of hue values and saturation values in accordance with the data obtained through photometry, divides each mountain of the obtained two-dimensional histogram into small mountains respectively having a crest by a feature plane which is parallel with a coordinate plane including the hue and saturation values of the two-dimensional histogram and includes the maximum cross section corresponding to only the crest of one mountain, judges which small mountain each picture element of the color original image is included in to classify each picture element into a group corresponding to each small mountain, obtains the degree of similarity between at least one picture element included in each small mountain and picture elements excluded from the small mountain in accordance with the hue and saturation values, unifies the picture elements excluded from the small mountain into groups in which the obtained degree of similarity corresponds to a high small mountain, divides the color original image for each unified group, and selects at least one of the divided regions to extract the data for the selected region as feature image data.
- For the third invention, it is possible to obtain the degree of similarity between at least one picture element included in each small mountain and picture elements excluded from the small mountain every small mountain by obtaining core picture elements of the color original image corresponding to the crest of each small mountain and judging in the color original image whether or not the distance between the picture elements excluded from the small mountain and each core picture element is minimum.
- For the third invention, it is also possible to obtain the degree of similarity between at least one picture element included in each small mountain and picture elements excluded from the small mountain every small mountain by obtaining core picture elements of the color original image corresponding to the crest of each small mountain and the degree of similarity between at least one picture element included in each small mountain and picture elements excluded from the small mountain and judging whether or not the distance between the picture elements excluded from the small mountain and each obtained core picture element is minimum.
- Moreover, for the third invention, it is possible to extract person's face density data as feature image data by selecting a divided region decided as a person's face.
- For the third invention, each mountain of the obtained two-dimensional histogram is divided into small mountains respectively having a crest by a feature plane which is parallel with a coordinate plane including hue and saturation values of the two-dimensional histogram and includes the maximum cross section corresponding to only the crest of one mountain. Thus, each mountain of the two-dimensional histogram is divided at the small mountain close to the crest which is a feature portion of only each mountain and the main hue- and saturation-value ranges of each mountain are determined.
- Then, it is judged which divided small mountain each picture element of the color original image is included in to classify each picture element into a group (cluster) corresponding to the small mountain by judging which hue-and saturation-value ranges the hue and saturation values of each picture element are included in. Thus, the regions in which picture elements of the color original image are included in the small mountain are divided into regions including picture elements having hue and saturation values within the hue- and saturation-value ranges in accordance with the feature portion of each mountain of the two-dimensional histogram. Then, the degree of similarity between at least one picture element included in each small mountain divided in accordance with hue and saturation values and picture elements excluded from the small mountain is obtained every small mountain. The scale for obtaining degree of similarity uses the value statistically determined on a plane consisting of the hue- and saturation-value axes. It is also possible to use the value statistically determined in a feature space consisting of hue, saturation, and lightness. Then, picture elements excluded from a small mountain with the obtained high degree of similarity are unified to a group corresponding to the small mountain. Thus, it is possible to unify picture elements by the degree of similarity on the color original image even for a two-dimensional histogram with a complex shape to be hardly divided because a plurality of mountains are overlapped. Then, the color original image is divided every group unified in the above manner. Therefore, one divided region of the color original image includes similar picture elements in addition to those within the main hue- and saturation-value ranges. Thus, it is possible to the data for this region as feature image data by selecting at least one of the divided regions as the region for expressing the feature of the image.
- For the third invention, the degree of similarity can be obtained as shown below. First, a picture element on the color original image corresponding to the crest of each small mountain, that is, a picture element corresponding to the crest (peak) of a two-dimensional histogram is obtained as a core picture element. Because the core picture element corresponds to the crest with the maximum number of picture elements or maximum frequency of each small mountain, hue and saturation values of the core picture element express the feature of each small mountain. It is also possible to obtain the core picture element in accordance with hue and saturation values of each small mountain. Then, the distance between picture elements excluded from the small mountain and each obtained core picture element is obtained in the color original image. In this case, it is more certain to unify picture elements excluded from the small mountain of the two-dimensional histogram into a group corresponding to the small mountain corresponding to a close core picture element on the color original image. Therefore, the picture elements excluded from the small mountain are unified to the group corresponding to the core picture element having the minimum obtained distance. Thus, because the picture elements to be unified can be unified to a small mountain corresponding to the core picture element having the minimum distance on the color original image, it is possible to unify the picture elements to be unified to a more certain region even if a plurality of similar picture elements are present on the color original image.
- Moreover, for the third invention, it is possible to obtain the degree of similarity as shown below. First, as described above, a core picture element corresponding to each small mountain of the two-dimensional histogram is obtained and the distance between picture elements excluded from small mountains and each obtained core picture element is obtained in the color original image. Then, as described above, the degree of similarity between one or more picture elements included in each small mountain and picture elements excluded from the small mountain is obtained every small mountain. In this case, it may be difficult to judge which small mountain a picture element with a high degree of similarity belongs to in the two-dimensional histogram. Therefore, as described above, picture elements excluded from the small mountain are unified to a group corresponding to a small mountain corresponding to the core picture element having the obtained small distance and the obtained high degree of similarity because it is more certain to unify the picture elements to be unified to a group corresponding to a small mountain corresponding to the core picture element with a small distance on the color original image. Thus, because the picture elements to be unified are unified to a small mountain having the minimum distance between the picture element in the color original image and the core picture element corresponding to each small mountain of the two-dimensional histogram in addition to the degree of similarity in accordance with hue and saturation values of picture elements, it is possible to unify the picture elements to be unified to a more certain region on the color original image because the degree of similarity in accordance with distance is added on the color original image even if it is difficult to decide the unification to a specific region only with the degree of similarity of picture elements in the two-dimensional histogram and even if it is difficult to judge which region of the color original image they are unified to because of the two-dimensional histogram with a complex shape.
- Because the present invention uses hue and saturation values, it is possible to extract feature image data even if a portion whose hue is the same as or similar to that of a feature image is mixed.
- Because a person's face is most remarked for appreciation of a portrait, it is preferable to judge if a divided region of a color original image is a person's face and extract the data for the region decided as a person's face as feature image data. The hue of a person's face is similar to that of a flesh-color portion such as ground and trees but the saturation differs in most cases. Therefore, it is also possible to extract person's face data from an image in which faces, ground, and trees are mixed by extracting person's face data in accordance with a two-dimensional histogram of hue and saturation values.
- The data to be extracted as feature image data can be data other than person's face data.
- Even if data can be extracted by excluding data for flesh-color portions of ground and trunk of trees or portions similar to flesh color, an image for a resort or pool includes many regions with the same color as a face in which much skin is exposed around the face and the regions around the face may be combined with the face region. Also there are some portraits in which a person rests his chin. In this case, images with the same color as the face are combined with the face region. Therefore, to extract the face region from the feature of the colors of the color original image, only the face region cannot be extracted but combined regions with the same color as the face are extracted. Thus, it is difficult to automatically extract the density data only for the face.
- Therefore, the fourth and fifth inventions automatically extract the data only for a person's face which is feature image data from the color original image on a negative film or the like.
- The fourth invention divides a color original image into many picture elements to resolve each picture element into three colors of red, green, and blue lights and photometrically measure them, obtains color regions whose hue is the same as or similar to that of the color original image on the color original image in accordance with the data obtained through photometry, assumes circles or ellipses inscribed to the boundary portion between the obtained color regions, divides the regions obtained by circular or elliptic regions from the largest circle or ellipse in order, and selects at least one of the divided regions to extract the data for the selected region as person's face data.
- The fifth invention divides a color original image into many picture elements to resolve each picture element into three colors of red, green, and blue lights and photometrically measure them, obtains color regions whose hue is the same as or similar to that of the color original image on the color original image, assumes circles or ellipses inscribed to the boundary portion between the obtained color regions to obtain the largest circular or elliptic region and a convex region with a predetermined area or more protruded outward from the circumference of the circle or ellipse and contacting the obtained regions, divides the color regions by the circular region inscribed to the boundary portion between color regions included in the convex region, and select at least one of the divided regions to extract the data for the selected region as person's face data.
- Because a person's face is most remarked for appreciation of a portrait, it is preferable to extract data for the person's face region from a color original image and use the data as feature image data. Because most person's faces are circular or elliptic, the person's face region is more certainly extracted by preferentially extracting circular regions from the same color regions of the color original image.
- Therefore, for the fourth invention, a color original image is divided into many picture elements to resolve each picture element into three colors of red, green, and blue lights and photometrically measure them and color regions with the same or similar hue are obtained on the color original image. Then, circles or ellipses inscribed to the boundary portion between the obtained color regions are assumed and the color regions obtained by circular or elliptic regions are divided from the largest circle or ellipse in order. Thus, it is more certain that the finally-divided region is an independent region of only a face. Each divided color region of the color original image is further divided into regions to be more certainly extracted as a face region. By selecting at least one region expressing the feature of the image, the data for the selected region expresses feature image data. Therefore, feature image data can be extracted through region selection.
- When the face region contacts a portion other than the face (for example, when a person is photographed from a diagonally upper position at a pool, the face region is buried in his body), the face region may be divided and extracted if the circle inscribed to the color region is preferentially divided. Therefore, for the fifth invention, color regions with the same or similar hue are obtained on a color original image in accordance with the data obtained through photometry as described in the fourth invention.
- Then, circles or ellipses inscribed to the boundary portion between the obtained color regions are assumed to obtain the largest circle or ellipse. When a convex region with a predetermined area or more protruded outward from the circumference of circle or ellipse contacts the obtained region, the color regions are divided by the circular region inscribed to the boundary portion between the color regions included in the convex region. Thus, a circular or elliptic region to be more certainly extracted as a person's face region can preferentially be divided as a person's face region even if similar color regions contact each other on the color original image and, by selecting at least one of the divided regions, the data for the selected region can be extracted as feature image data.
-
- Fig. 1 is a schematic diagram showing the printer which is the first embodiment of the present invention;
- Fig. 2 is a flow chart showing the face extraction routine of a face extraction circuit;
- Fig. 3 is a diagram showing color coordinates;
- Fig. 4A is a diagram showing a two-dimensional histogram of hue values and saturation values;
- Fig. 4B is a diagram showing a divided original image;
- Fig. 4C is a diagram showing the single mountain with one crest extracted from the two-dimensional histogram;
- Fig. 5 is a flow chart showing details of the
step 106 in Fig. 2; - Fig. 6 is a diagram showing a histogram and a performance function;
- Fig. 7 is a flow chart showing details of the
step 108 in Fig. 2; - Fig. 8 is a flow chart showing details of the
step 110 in Fig. 2; - Fig. 9 is a flow chart of the face extraction routine of the second embodiment of the present invention;
- Fig. 10 is a flow chart of the face extraction routine of the third embodiment of the present invention;
- Fig. 11 is a flow chart showing the details of the
step 110 of the fourth embodiment; - Fig. 12A to Fig. 12G are diagrams showing the processes for dividing the color region of the fourth embodiment;
- Fig. 13 is a flow chart showing the details of the
step 110 of the fifth embodiment; - Fig. 14A to Fig. 14D are diagrams showing the processes for dividing the color region of the fourth embodiment;
- Fig. 15 is a flow chart showing the face extraction routine of the sixth embodiment;
- Fig. 16 is a flow chart showing the details of the step 106' in Fig. 15;
- Fig. 17A and Fig. 17B are cross-sectional perspective views showing a plane parallel with the coordinate plane cutting out a two-dimensional histogram;
- Fig. 17C is a perspective view of a two-dimensional histogram of hue and saturation values;
- Fig. 17D is a diagram showing the state in which an original image is divided;
- Fig. 18A is side and flat views of a single mountain of a two-dimensional histogram;
- Fig. 18B and Fig. 18C are sectional views of a two-dimensional histogram including the cross section cut out by a plane parallel with a coordinate plane;
- Fig. 19A is a perspective view of a feature plane;
- Fig. 19B is a perspective view of a two-dimensional histogram;
- Fig. 20 is a flow chart showing the details of the
step 106 of the seventh embodiment; - Fig. 21A is a side view of a single mountain of a two-dimensional histogram;
- Fig. 21B is a flat view of Fig. 21A;
- Fig. 21C is a sectional view of a two-dimensional histogram including the cross section cut out by the plane parallel with a coordinate plane;
- Fig. 22 is a flow chart showing the details of the
step 108 of the seventh embodiment; - Fig. 23A is a flat view of the cross sectional region of each mountain of a two-dimensional histogram;
- Fig. 23B is a diagram showing clustered cross section of each mountain and the core picture element of each mountain in an original image;
- Fig. 24A is a diagram of an original image;
- Fig. 24B is a flat view of a two-dimensional histogram;
- Fig. 24C is a side view of Fig. 24B;
- Fig. 25 is a schematic diagram of another exposure computation apparatus to which the present invention is applied;
- Fig. 26 is a schematic diagram of an exposure computation apparatus for performing parallel processing by a plurality of face extraction circuits; and
- Fig. 27 is a time chart for parallel processing.
- The first embodiment of the present invention is described below in detail by referring to the accompanying drawings. The embodiment is made by applying the present invention to an automatic printer. As shown in Fig. 1, the automatic printer of this embodiment has carrying
rollers 12 for carrying a colornegative film 10. Alight source 14,color correction filter 16 such as a color modulation filter, anddiffusion box 18 are arranged in order under thenegative film 10 to be carried by the carryingrollers 12. A distribution prism for distributing the ray transmitted through thenegative film 10 in two ways is arranged above thenegative film 10. A projectiveoptical system 22,black shutter 23, and color paper (photographic paper) 24 are arranged in order on one optical path distributed by thedistribution prism 20, and a projectiveoptical system 26 and aCCD image sensor 28 are arranged in order on the other optical path. TheCCD image sensor 28 divides one full screen (one frame) of thenegative film 10 into many picture elements (e.g. 256 x 256 picture elements) and resolves each picture element into three colors of R (red), G (green), and B (blue) to photometrically measure them. TheCCD image sensor 28 is connected to a3x3 matrix circuit 34 for correcting the sensitivity of the CCD image sensor through anamplifier 30 for amplifying the CCD image sensor output and an analog-to-digital (A-D)converter 32. The3x3 matrix circuit 34 is connected to a properexposure computation circuit 40 through aface extraction circuit 36 consisting of a microcomputer storing the program of a routine to be described later and through an averagedensity computation circuit 38 for computing the average density of one full screen. The properexposure computation circuit 40 is connected to thecolor correction filter 16 through adriver 42 for driving the color correction filter. - The following is the description of functions of this embodiment. The ray emitted from the
light source 14 passes through thecolor correction filter 16,diffusion box 18, and colornegative film 10, and is distributed by thedistribution prism 20 and received by theCCD image sensor 28. - In this case, the
black shutter 28 is closed. When theCCD image sensor 28 receives the ray, it divides one full screen into many picture elements, resolves each picture element into three colors of R, G, and B to photometrically measure them, and outputs a photometric data signal. The photometric data signal is amplified by theamplifier 30 before it is converted into a digital signal by theA-D converter 32. Then, the sensitivity of the image sensor is corrected by the3x3 matrix circuit 34 and the digital signal is inputted to theface extraction circuit 36 and the averagedensity computation circuit 38. The averagedensity computation circuit 38 computes the average density of one full screen. Theface extraction circuit 36, as described later, estimates the portion of a person's face in one screen and outputs three-color photometric data for R, G, and B. Theexposure computation circuit 40 computes an exposure by using the three-color photometric data outputted from theface extraction circuit 36 and the average density obtained by the averagedensity computation circuit 38, controls thecolor correction filter 16 through thedriver 42, and performs printing by operating theblack shutter 23. The exposure correction value for the average density can be obtained by using the average density obtained by the averagedensity computation circuit 38. Unless the exposure correction value is obtained, the averagedensity computation circuit 38 is not always necessary and it is possible to directly obtain an exposure from the three-color photometric data outputted by theface extraction circuit 36. - Fig. 2 shows a face extraction routine by the
face extraction circuit 36, in which elimination of noises from inputted three-color photometric data, that is, smoothing is executed in thestep 100. In thenext step 102, three-color photometric data for R, G, and B is converted into H (hue value), L (lightness value), and S (saturation value).


Where, R, G, and B are three-color photometric data specified so that the minimum value is 0 and the maximum value is 1 respectively as shown in the three-dimensional coordinates in Fig. 3; "min ( )" is the minimum value of the values in parentheses; and r', g', and b' represent r' = R/L, g' = G/L, and b' = B/L. H' is given by the following expression (4) and Pi ("i" is one of R. G, and B) is P in Fig. 3.
Where,
In thestep 104, a two-dimensional histogram of hue values and saturation values is obtained by using a coordinate system consisting of the hue value axis, saturation value axis, and number-of-picture-element axis which are perpendicular to each other as shown in Fig. 4A. In thestep 106, as described later, the obtained two-dimensional histogram is divided into mountains, that is, the two-dimensional histogram is clustered. In thenext step 108, many picture elements are clustered in accordance with the mountains of the clustered two-dimensional histogram and a screen is divided in accordance with the clustering to extract an region prospective for a person's face among divided regions. - In the
next step 110, the region of a face is estimated from the region extracted as a prospect of the face and three-color photometric data for R, G, and B of the region estimated as the face is outputted. In thestep 112, it is judged if all frames are printed. If so, the routine is completed. - The following is the description of details of the
above steps 106 through 110. Fig. 5 shows details of thestep 106. In thestep 120, a region to be evaluated is cut out of the two-dimensional histogram of hue values and saturation values. In Fig. 4, one frame is used as an evaluation region to simplify explanation. In thestep 122, it is judged if any evaluation region is present. - When the evaluation region cannot be cut out in the
step 120, that is, when evaluation of all regions is completed, the routine is completed because no evaluation region is present. When any evaluation region is present, X and Y axes are determined to make a histogram for cutting out mountains in thestep 124. That is, the evaluation region is rotated around the axis parallel with the number-of-picture-element axis to obtain a position where priority is given to multi-crest property and the mountains become sharpest when viewing mountains of the histogram from the side and determine the X and Y axes on the basis of the position. When the processing time should be decreased, it is possible to use either X or Y axis in which the variance of the histogram is maximized though the accuracy slightly decreases. For the example in Fig. 4A, the position where priority is given to multi-crest property and mountains become sharpest when viewing four mountains marked withnumerals 1 through 4 from the side is the position where three mountains can be seen. Therefore, X axis is determined in the direction perpendicular to the direction when they can be seen and Y axis is determined in the direction perpendicular to the X axis. - In the
next step 126, each one-dimensional histogram is made by projecting the two-dimensional histogram on X and Y axes. For the example in Fig. 4A, when viewing the mountains from the direction perpendicular to X axis, three mountains including the mountain marked with thenumerals 3, the mountain marked withnumerals numerals numerals 1 through 4 are overlapped like one mountain. In thenext step 128, the histogram is converted into a performance function H (a) by the following expression (5) and mountains are cut out of the histogram about X axis in accordance with the performance function.
Where, "f (a)" is the number of picture elements when the value (feature value) in X-axis direction is "a" and "x" is the deviation from the feature value "a". - That is, the average value T of the performance function H (a) is obtained and the range (trough and foot existing range) lower than the average value T of the performance function H (a) is obtained. Then, the position where the histogram within this range is minimum is obtained as the trough or foot of the histogram. Then, the histogram is cut out at the obtained trough or foot.
- The following is the description of cutting out the above mountain by referring to Fig. 6. The broken line in Fig. 6 represents the performance function H (a) obtained from the histogram shown by the continuous line S1. The range in which the performance function H (a) is equal to or lower than the average value T about the negative portion is the range in which the feature value ranges between v0 and v1 and between v2 and v3. The position where the frequency of the histogram within this range is minimized is av0 = v0 for the range between v0 and v1 and av1 for the range between v2 and v3, and av0 is obtained as a foot and av2 is obtained as a trough. The histogram is cut out at these positions.
- In the
step 130, mountains of the histogram about Y axis are cut out similarly to cutting-out of mountains of the histogram about X axis. In thenext step 132, an region where mountains of the one-dimensional histogram about X and Y axes cut out in the above manner on the two-dimensional histogram are overlapped is obtained to cut mountains out of the two-dimensional histogram of hue values and saturation values. The region E1 in Fig. 4A shows the mountains cut out in the above manner. - In the
next step 134, it is judged if the mountain cut out of the two-dimensional histogram has one crest. If not, Steps 124 through 134 are repeated until the mountain cut out of the two-dimensional histogram has one crest. The region E2 in Fig. 4C shows the one-crest mountain cut out in the above manner. - In the
next step 136, the processing for providing cut-out one-crest mountains with a label to identify them (i.e. labeling) is performed. In thestep 138, labeled mountains are masked to restart thestep 120. The above steps are repeated to divide all regions of the two-dimensional histogram of hue values and saturation values into one-crest mountains. - Fig. 7 shows the details of the
step 108. In thestep 104, the X-axis directional range XR {Fig. 4C} of one-crest mountains divided in the above manner and the Y-axis directional range YR {Fig. 4C} of them are obtained for each one-crest mountain, it is judged about each picture element of the original image if hue values and saturation values are kept within these ranges in order to cluster picture elements, and the picture elements enclosed by the ranges XR and YR are collected to divide the original image so that the collected picture elements form one region on the original image. The divided regions are numbered. Fig. 4B shows a divided original image, in which the picture elements in regions marked withnumerals 1 through 4 correspond to the picture elements enclosed by one-crest mountains marked withnumerals 1 through 4. The picture elements belonging to the same one-crest mountain in Fig. 4A are divided into different regions in Fig. 4B. This is because the picture elements having the hue value range and saturation value range of one-crest mountain in Fig. 4A are located in different regions in Fig. 4B. - In the
next step 142, micro regions are removed and numbering is retried by judging the area of divided regions. In the next step 114, small regions connected with a large region are separated from the large region by executing contraction for removing all picture elements at the boundary between regions to remove one layer and expansion for increasing picture elements at the boundary in the background picture element direction to add one layer contrary to contraction. In thenext step 146, numbering is executed by removing micro regions similarly to thestep 142 and contraction and expansion similar to the above are executed to separate regions slightly bonded in thestep 148 from each other. In thestep 150, removal of micro regions and numbering are executed similarly to the above. - Fig. 8 shows the details of the
step 110. In thestep 162, one region is selected as a remarked region among the regions extracted by the routine in thestep 108 or Fig. 7, the size of the remarked region is standardized by expanding and contracting the remarked region so that the horizontal- and vertical-fillet diameters of the remarked region will have the predetermined value, and the density or brightness value is standardized in accordance with the following expression (6).
Where,
dmax: Maximum density value (or brightness value) in region
dmin: Minimum density value (or brightness value) in region
ds: Full-scale density value (or brightness value) of image sensor
dr: Standardized density value (or brightness value)
In thestep 164, the correlation coefficient "gamma" of the remarked region for previously stored several types (ten types for this embodiment) of standard face images (e.g. face images viewed from the front, viewed from the side (right and left respectively), turned downward, and turned upward) is computed by the following expression (7) and the correlation coefficient is assumed as the feature value. These standard face images can be the data for only the contour of face or the data obtained by adding the data for internal structures of face (e.g. eyes, nose, and mouth) to the data for the contour of face.
where,
Where, T represents the horizontal- and vertical-fillet diameters of image (both fillet diameters are the same in this case), "f (x, y)" represents the remarked region, and "g (x, y)" represents the standard face image. - In the step 166, it is judged whether or not the remarked region is a person's face through the linear discrimination analysis using the above feature value as a variable and R-, G-, and B-photometric data for the region decided as a face is outputted to the proper
exposure computation circuit 40. In thestep 168, it is judged if the decision on whether or not all extracted regions belong to a face is completed. If not, thesteps 162 through 168 are repeated. - In the above case, the correlation coefficient is used as the feature value for the judgment on a person's face. However, it is also possible to use the invariant, autocorrelation function, or geometrical invariant obtained from the central moment.
- When assuming the (p + q)-degree central moment "mupq" of the image "f (x, y)" around the center of gravity as:

Where,
The normalized central moment "etapq" around the center of gravity is shown as follows:
Where,


From the above, the following seven invariants "Psi-i" (i = 1, 2,...., and 7) are obtained from the secondary and tertiary normalized central moments around the center of gravity.


The autocorrelation function Rf is expressed as follows:
And the geometrical invariant feature value is expressed as follows:
The properexposure computation circuit 40 computes the proper exposure Ei in accordance with the following expression by using the R-, G-, and B-photometric data for the face region extracted by theface extraction circuit 36 in the above manner and the one-frame average density Di (i = any one of R, G, and B) computed by the averagedensity computation circuit 38 and outputs Ei to thedriver 42. Thedriver 42 computes an exposure control value with the proper exposure Ei to control thecolor modulation filter 16.

Where,
LM: Magnification slope coefficient which is previously set in accordance with the enlargement ratio determined by the type of negative and the print size
CS: Color slope coefficient prepared for each type of negative, which includes the under- and over-exposure types. It is decided whether the average density of the frame to be printed is under or over the standard negative density before the under- or over-exposure type is selected.
DN: Standard negative density value
D: Average density value of print frame
PB: Correction balance value for standard color paper, which is determined in accordance with the type of the color paper
LB: Correction balance value for standard printing lens, which is determined in accordance with the type of the printing lens
MB: Correction value (master balance value) for fluctuation of the printing light source or change of paper developing performance
NB: Negative balance (color balance) value determined by the characteristic of negative film
K2: Color correction value
K1: Density correction value shown by the following expression
Where, Ka and Kb are a constant and FD is the average density of face region. - It is also possible to express the color correction value K2 by assuming the density correction value K1 in the above expression (8) as the correction value obtained by a film tester and using the average density of face region as shown below.

Where, Kc is a constant. - Moreover, it is possible to obtain an exposure by assuming the density correction value K1 and color correction value K2 in the above expression (8) as the correction value obtained by the film tester and replacing the average density Di of the print frame in the expression (8) with the average density FDi of face region.
- Because this embodiment makes judgment by using the contour and internal structure of a region, face data can also be extracted from an image in which a face, ground, and tree having similar hue are mixed.
- The second embodiment of the present invention is described below. This embodiment is made by modifying the method of the first embodiment for judging whether a face or not, which judges whether the remarked region is a face or not on each prospective region extracted in the
step 108 by using the shape and color information of the remarked region and those of adjacent regions which are located around the remarked region. Fig. 9 shows the routine for judging a face or not. In thestep 170, it is judged whether or not a region corresponding to the hand or foot of a person is extracted by judging if a region which has the hue value and saturation value same as or close to those of the remarked region around the remarked region and whose size (capable of adopting, for example, horizontal or vertical fillet diameter) is 25 to 100% of that of the remarked region is extracted. The range to be judged should be a range in which the body of a person is present, in order words, a range having the radius five times as large as the diameter of the circle with the same area as that of the remarked region. If image information is discontinued, the objective range should be up to the position where image information is discontinued in the discontinuous direction. When a region corresponding to the hand or foot is present around the remarked region, the flag Fa is set in thestep 172. - In the
next step 174, it is judged whether or not a region of the body of a person is extracted by judging if a region connected with the remarked region is present and the region corresponds to the body of the person. Because the body of a person is normally symmetric to the axis for the right and left and asymmetric for the top and bottom and connects with his face, it is possible to decide whether or not the region corresponding to the body of the person is present by judging if a region connected with the remarked region is present and it is symmetric to the axis for the right and left and asymmetric for the top and bottom. When the region corresponding to the body of the person is present, the flag Fb is set in thestep 176. - In the
next step 178, it is decided whether or not a head is present by judging the following conditions. The head is adjacent to a face and shows an approximate ellipse when it is combined with the face. Because a cap, helmet, or hair is normally present on the head, the hue or saturation of the head is different from that of the face. - Therefore, it is possible to decide whether the head is present or not by judging if the ratio of the peripheral length of a region adjacent to the remarked region to the boundary length at the adjacent portion with the remarked region is 30% or more, the roundness when the remarked region is combined with the adjacent region is improved, the saturation value difference or brightness value difference to the hue difference between the hue value of the remarked region and that of the region adjacent to the remarked region is large, and the saturation value or brightness value of the region adjacent to the remarked region is small than that of the remarked region. When it is decided that the region corresponding to the head is present, the flag Fc is set in the
step 180. - In the
step 182, it is judged if the flags Fa and Fb are set. If so, in other words, when a region corresponding to the hand or foot is present around the remarked region and the region connected with the remarked region is a region corresponding to the body, it is decided that the remarked region is a person's face and the R-, G-, and B-photometric data for the remarked region is outputted in thestep 188. If not in thestep 188, it is judged in thestep 184 if the flags Fb and Fc are set. If so, in other words, when the region connected with the remarked region is a region corresponding to the body and the region adjacent to the remarked region is a region corresponding to the head, it is decided that the remarked region is a person's face and thestep 188 starts. If not in thestep 184, it is judged in thestep 186 if the flags Fa, Fb, and Fc are set. If so, it is decided that the remarked region is a person's face and thestep 188 starts. In thenext step 190, the flags Fa, Fb, and Fc are reset in order to decide the remarked region. - To decide whether the remarked region is a hand, foot, body, or head in this embodiment, it is also possible to previously store a plurality of standard hand or foot images, a plurality of standard body images, and a plurality of standard head images and compare the remarked region with these standard images for decision as described in the above first embodiment.
- The third embodiment of the present invention is described below.
- This embodiment is made by modifying the method of the first embodiment for judging a face or not, which converts an extracted region into a line graphic to judge whether or not the remarked region is a face in accordance with the shape of regions around the remarked region and that of the remarked region. Fig. 10 shows a face decision routine in accordance with line graphic conversion, in which each region is converted into a ling graphic by extracting line information from the extracted region for one screen in the above manner. In the
step 202, it is judged whether or not a line graphic showing the shoulder of a person is present by comparing the previously stored standard line graphic showing the person's shoulder with the line graphics for one screen. Unless the line graphic showing the should is present, this routine is completed. When the line graphic showing the should is present, it is judged if any line graphic is present on the former line graphic. If so, the latter line graphic is assumed as a remarked line graphic to judge if any line graphic showing a head (e.g. cap, hair, or helmet) is present on the top of the remarked line graphic in thestep 206. If so in thestep 206, the remarked line graphic has a large probability that the remarked line graphic is a face line graphic because the line graphic showing the face is present at the top of the remarked line graphic and the line graphic showing the shoulder is present at the bottom of the remarked line graphic. Therefore, it is judged in thestep 208 if the contour of the remarked line graphic is similar to that of the standard face line graphic. If so in thestep 208, it is decided in thestep 210 that the remarked line graphic is a face and the R-, G-, and B-photometric data for the region corresponding to the remarked line graphic is outputted. If not in thestep 208, however, it is decided in thestep 212 that the lower portion of the line graphic at the top of the line graphic showing the shoulder is a face and R-, G-, and B-photometric data for the portion is outputted. - For this embodiment, because a face is decided with the shape of the remarked region, face data can also be extracted from an image including a face, ground, and tree with similar hue. Moreover, because a face is not decided by using the microstructure of the face, the face can be decided with a short computation time even if the resolution of the image to be decided is low.
- The fourth embodiment of the present invention is described below in detail. This embodiment is made by modifying the contents of the
step 110 of the first embodiment in Fig. 2, which further divides the color region extracted as a prospect of a face in thestep 110 into circular or elliptic regions to divide at least the face region from other regions, estimates the face region in accordance with the divided regions, and outputs R-, G, and B-photometric data of the region estimated as a face. - Fig. 11 shows the details of the
step 110 of this embodiment. Fig. 11 is explained by using an image in Fig. 12A covering a wide range of a color region with the color same as or similar to a face. - First, in the
step 262, one region is selected as a remarked region among the regions extracted by the routine in thestep 108 or Fig. 7 (see Fig. 12A). Then, a core for decomposing the selected remarked region is obtained by contracting the remarked region. That is, contraction is repeated to eliminate boundary picture elements of the remarked region and a finally-left point or line region is used as the core. The line region is defined as a plurality of continuous points (picture element or collection of picture elements) or the line L1 as shown in Fig. 12B. An objective image has the above core or a certain area because it is not the continuous system but the discrete system since it is based on the data obtained by photometrically measuring an original image by theCCD image sensor 28. More than one core may finally be left depending on the shape of the objective image. In this case, the region with the minimum area is determined as the core. When regions with the same area are left, any one of them is selected as the core. - In the
next step 264, the largest circle or ellipse inscribed to the remarked region is obtained around the core obtained in the above manner. That is, by performing expansion around the core by the number of times in which contraction is repeated to obtain the core, the core can be obtained as an inscribed circle when it is a point and as an inscribed ellipse when it is a line (morphologic filter). - After the largest circle or ellipse inscribed to the remarked region is obtained, the
step 266 starts labeling for attaching a label to the obtained largest circle (or ellipse consisting of the circle) to identify it. In thenext step 268, the region BL1 of the labeled circle or ellipse is masked and thestep 270 is started. In thenext step 270, it is judged if division of all extracted regions by a circular or elliptic region is completed. If not, thesteps 262 through 268 are repeated. Thus, the regions BL1 through BL10 are divided in order by large circles as shown in Figs. 12B through 12F. - When division of the remarked region is completed, the
step 272 starts. In thestep 272, at least one of the circles or ellipses divided by the routine of the first embodiment described in Fig. 8 is selected to estimate a face region and R-, G-, and B-photometric data of the region estimated as a face is outputted to the properexposure computation circuit 40. The properexposure computation circuit 40 computes the proper exposure Ei in accordance with the expression (8) and thedriver 40 controls thecolor modulation filter 16 in accordance with the computed proper exposure. - Therefore, even if the color region with the same color as a face covers a wide range including regions other than the face, the color region can further be divided at the circular region having a high probability of the face region. Thus, the data only for the face region can be extracted at a high probability from an image including a face, body, hands, ground, and trees with similar hue and saturation.
- The above core Li and the inscribed-circle region Xi can be shown by the following set-operation expressions (11) and (12).


Where,
i: 1, 2, ....
X: Divided face region
X,0 = Phi (Null set)
X'i = U Xi (Sum set)
(-): Minkowski's subtraction
(+): Minkowski's addition
When

In this case, the shape Bi for obtaining the inscribed circle of the color region around the core by contracting the color region can be decided by the following expression (13).
Where,
B: Circular component
The value "ni" in the expression can be decided by the following expression (14).
Where,
k = 1, 2....
M²i = Area ---
Area (X): Area of X region
The value "ni" for a size to be decomposed can be decided by properly selecting the value of "k". The following expression (15) can be used instead of the above expression (14).
Where,
k = 1, 2....
r0: Radius of component B
The relationship between the above circular component B and X region can be expressed as follows:
Where,
The fifth embodiment of the present invention is described below by referring to the flow chart shown in Fig. 13. - This embodiment is made by modifying the contents of the
step 110 of the first embodiment in Fig. 2, which most preferably divides a face region from a region contacting the face region. That is, the face region in a portrait is present around the body in most cases. Therefore, when a color region including the face region has a plurality of convex regions, the color region is divided from a circular region inscribed to the convex portion and the divided circular region is selected to preferentially divide a prospective region capable of estimating the circular region as the face region. - First, in the step 380, one region is selected among the regions extracted by the routine in the
step 108 or Fig. 7 {see Fig. 14A}. Then, similarly to the fourth embodiment, the selected remarked region is contracted to obtain the core La of the remarked region {see Fig. 14B}. - In the
next step 382, the largest circle or ellipse Ba inscribed to the remarked region is obtained around the core La obtained in the above manner. In thenext step 384, the area of the circle or ellipse inscribed to the remarked region thus obtained with that of the remarked region to judge if the area of the region ERi (i = 1, 2....) remaining around the inscribed circle of the remarked region has a predetermined value or more. If so, thestep 386 is started because there is a possibility that the convex region is present in the remaining region ERi. If not, thestep 392 is started. - In the
step 386, the core La obtained in the above manner is excluded (masked) from the remarked region as shown in Fig. 14C. In thenext step 388, contraction and expansion are performed like the above mentioned to obtain the largest circle or ellipse Bb in which the core La is inscribed to the masked remarked region {see Fig. 14D}. - In the
next step 390, the size of the convex portion outside the remarked color region is judged by expanding each of thus-obtained inscribed circles or ellipses Ba and Bb within the range of approximately predetermined (e.g. 1 through 3) picture elements and judging if the region protruded from the remarked region has the size of predetermined value or more. That is, it is judged that larger region protruded from the remarked region among expanded regions is more convex. When the obtained convex portion has the size of predetermined value or more, thestep 394 is started to perform labeling for identifying the inscribed circle or ellipse Bb before thestep 396 is started. If the obtained convex portion has the size of predetermined value or less, labeling for identifying the largest circle (or ellipse consisting of the circle) inscribed to the remarked region is performed in thestep 392 similarly to the fourth embodiment before thestep 396 is started. - In the
step 396, the circle or ellipse labeled in thestep 392 or 395 is masked. Then, thestep 398 is started. In thestep 398, it is judged if division of every extracted region by circles or ellipses is completed. - If not, the steps 380 through 398 are repeated. In the
next step 300, at least one of the divided circles or ellipses is selected to judge the face region similarly to the first embodiment and R-, G-, and B-photometric data for the region decided as a face is outputted to the properexposure computation circuit 40. - Thus, because this embodiment preferentially divides a large circular region inscribed to the convex portion around a color region or a circular region having a high probability of a face region from the remarked region, data for the face region can be extracted by more certainly dividing only the face region even for the color region in which the body and face contact each other.
- The above embodiment describes a case in which the color region is divided in accordance with a two-dimensional histogram of hue and saturation values. However, this embodiment is not restricted to the case. It is also possible to divide the color region in accordance with a histogram of only hue values. Moreover, the color region can be divided not only by a histogram but by other feature value of an original image.
- The following is the description of the sixth embodiment of the present invention. This embodiment is almost the same as the first embodiment. Therefore, description of the corresponding portions is omitted and only different points are described.
- Fig. 15 shows a face extraction routine of the
face extraction circuit 36 of this embodiment. Because Fig. 15 is the same as Fig. 2, the corresponding portions are provided with the same symbol. In the step 106' in Fig. 15, however, many picture elements are clustered in accordance with the obtained two-dimensional histogram, a screen is divided through clustering, and a prospective region of a person's face is extracted from the divided regions. - For this embodiment, evaluation is performed with a two-dimensional histogram of the entire frame to simplify the description. However, it is also possible to previously specify a region to be evaluated with a two-dimensional histogram before cutting out the region.
- The following is the detailed description of the steps 106' through 110 in Fig. 15. Fig. 16 shows the details of the step 106' in Fig. 15. In the
step 420, the crest of each mountain of a two-dimensional histogram is detected by slowly and parallely displacing a plane parallel with the coordinate plane consisting of hue- and saturation-value axes. - First, the plane parallel with the coordinate plane consisting of hue- and saturation-value axes is parallely displaced in the direction in which the number of picture elements increases from 0. In this case, the cross-sectional area of each mountain of the two-dimensional histogram cut out by the plane decreases and comes to 0 at the crest of the mountain. The point where the cross-sectional area comes to 0 is judged as the crest of the mountain. That is, when taking the two-dimensional histogram in Fig. 17C as an example, each closed region which is a cross-sectional region of the mountain sliced by the plane ST1 is present on the plane ST1 (with "n" picture elements) parallel with the coordinate plane consisting of hue- and saturation-value axes as shown in Fig. 17B. For example, the cross-sectional region of the mountain M2 of the two-dimensional histogram corresponds to the closed region Ea1. The region Ea1 disappears on the plane ST2 made by parallely displacing it in the direction in which the number of picture elements increases (positive direction of the number-of-picture element axis). The point where the closed region disappears (or when it comes to 0), is the crest of the mountain M2. The number of crests of a mountain is counted in the above manner. In this case, the height V of the mountain is read by reading the plane height when the crest is detected (i.e. the number of picture element s or frequency). When a plurality of mountains are overlapped, closed regions are divided into each closed region corresponding to a crest by slowly and parallely displacing the plane in the direction in which the number of picture elements increases. It is also possible to parallely displace the plane parallel with the coordinate plane in the direction in which the number of picture elements decreases from the maximum height of the two-dimensional histogram. In this case, the point where a closed region appears (or when the area exceeds 0) is determined as the crest of the mountain. When it is necessary to shorten the processing time, the accuracy is slightly degraded. However, it is also possible to obtain a crest by parallely displacing the plane in stages every predetermined number of picture elements.
- In the
next step 422, the lowest mountain is selected in a two-dimensional histogram. That is, as shown in Fig. 18A, the lowest mountain M1a is selected in the mountain M1. Then, the height V of the selected mountain is taken in. In this case, a value smaller than the mountain height V (e.g. value "v" which is the predetermined rate of the mountain height V) is obtained. The value "v" can use a previously set value. In thenext step 424, the threshold (V - v) for cutting out the selected mountain is set. In thestep 426, the two-dimensional histogram is cut out by the plane SI1 determined by the set threshold. Thus, the cross section serves as the closed region Eb1 shown as a hatched area in Fig. 18B. In thestep 428, the processing (labeling) for attaching a label to each cross section is performed to identify the cut-out mountain. - In the
next step 430, it is judged if two or more mountain crests correspond to one closed region corresponding to the selected mountain crest (minimum height). That is, as shown in Fig. 18B, not only the crest of the lowest mountain M1a but the crests of the mountain M1b and M1c correspond to the closed region Eb1. Therefore, the crest of each mountain is projected on the close region Eb1 to judge whether or not the projected crest is only the crest of the lowest mountain M1a. Thereby, it is judged if the mountain corresponding to the closed region is only the lowest mountain. If it corresponds to two or more mountains, the value "v" is decreased by "v'" (v = v - v') before thestep 24 is restarted. Thus, the threshold and the plane height for cutting out a mountain increase. Because of increase of the plane height, the closed region Eb1 is divided into the closed regions Eb2 and Eb3 as shown in Fig. 18C. Thus, only the crest of the lowest mountain corresponds to the close region Eb2. Also, the plane from which the closed region Eb2 corresponding to only the lowest mountain M1a is obtained is determined as a feature plane. The value "v'" is set so that it will be smaller than the value "v". Thus, thesteps 24 through 430 are repeated until the crest of the lowest mountain corresponds to a cross section one by one. - In the
step 434, exclusive expansion is performed for all closed regions of the cross-sectional portion of the two-dimensional histogram on the plane (feature plane) in accordance with the threshold of the lowest mountain. The exclusive expansion is described below by referring to Fig. 19. First, the feature plane is divided into a plurality of planes by the unit region consisting of the predetermined hue and saturation values. Then, all unit regions of the closed region (hatched portion in Fig. 19) of the cross-sectional portion of the two-dimensional histogram cut out by the feature plane are provided with the density value "1" and unit regions belonging to regions other than the above are provided with the density value "0". Then, the unit regions provided with the density value "0" are exclusively expanded so that their density value comes to "1". The exclusive expansion is performed from the circumferential region (boundary portion) of each cross section. - For example, to perform evaluation by the 8-vicinity technique, an evaluation region having the size of the 3x3 unit region is used as the region for evaluating unit regions provided with the density value "0". Then, the unit region to be evaluated is set to the center of the evaluation region.
- When a unit region provided with the density value "1" is present in eight regions around the evaluation region, the unit region to be evaluated is provided with the density value "1". The area of the closed region is expanded by applying the above processing to all unit regions provided with the density value "0" on the feature plane. All closed regions on the feature plane are expanded by repeating the above processing. Expansion is completed when the interval between the boundaries of close regions comes to a predetermined value (e.g. one-unit region). That is, the unit region in which the interval between the boundaries of closed regions equals the predetermined value is determined as the density value "0". Thus, even if a plurality of crests correspond to one mountain, expansion can be performed by assuming the portion up to the trough of the mountain as a boundary. Moreover, to evaluate unit regions provided with the density value "0" by the above evaluation region, the obtained two-dimensional histogram is referenced to read the number of picture elements in the unit region to be evaluated in the two-dimensional histogram. When the read number of picture elements is one or less, exclusive expansion is not performed because expansion is unnecessary. Therefore, the contour of the mountain can be obtained by the obtained trough and foot of the mountain.
- As described above, a two-dimensional histogram can be divided into mountains with one crest by performing exclusive expansion and obtaining the contour of mountains.
- In the next step 436, the color region of an original image corresponding to a selected crest is cut out. That is, the original image corresponding to the hue- and saturation-value ranges obtained through the above exclusive expansion is divided and cut out. In the
step 438, it is judged if any crest remains. If two or more crests remain, thestep 422 is restarted. When cutting out of color regions of the original image corresponding to all crests is completed, this routine is completed. When one crest remains, the processing (labeling) for attaching a label to a cross section is performed without repeating the above processing because the hue- and saturation-value ranges are already obtained and the next processing is started. All color regions of the original image can be divided and cut out by repeating the processing for dividing and cutting the original image. - Thus, the original image can easily he divided even if it is clustered into complex shapes because the crests of mountains of a two-dimensional histogram are detected, mountains of the two-dimensional histogram are cut out by corresponding to the crests, the cut-out cross sections are exclusively expanded, and the two-dimensional histogram is divided by the expanded cross sections.
- The above mentioned is the description of the case in which division of the two-dimensional histogram and division and cutting-out of the original image are performed for each cross section. However, it is also possible to completely divide the two-dimensional histogram before cutting out the original image.
- To judge whether or not the remarked region is a face, this embodiment can use the judging methods described in the second, third, fourth, and fifth embodiments in addition to the judging method using the contour and internal structure of the region described in the first embodiment.
- The following is the description of the seventh embodiment. This embodiment is made by modifying the
steps - Fig. 20 shows the details of the
step 106 of this embodiment. In thestep 520, the crest of each mountain of a two-dimensional histogram is detected by slowly and parallely displacing a plane parallel with the coordinate plane consisting of hue- and saturation-value axes. First, the plane parallel with the coordinate plane consisting of hue- and saturation-value axes is parallely displaced in the direction in which the number of picture elements increases from 0. In this case, the cross-sectional area of each mountain of the two-dimensional histogram cut out by the plane decreases and comes to 0 at the crest of mountain. The point where the cross-sectional area comes to 0 is judged as a crest of mountain. That is, when taking the two-dimensional histogram in Fig. 17C as an example, each closed region which is a cross section of the mountain sliced by the plane ST1 is present on the plane ST1 (with "n" picture elements) parallel with the coordinate plane consisting of hue- and saturation-value axes as shown in Fig. 17B. For example, the mountain M2 of the two-dimensional histogram corresponds to the closed region Ea1. The region Ea1 disappears on the plane ST2 made by parallely displacing it in the direction in which the number of picture elements increases. The point where the closed region disappears (or when it comes to 0) is assumed as the crest of the mountain M2 to count the number of crests of a mountain. In this case, the height V of the mountain is read by reading the plane height when the crest is detected (i.e. the number of picture elements or frequency). When a plurality of mountains are overlapped, closed regions are divided into each closed region corresponding to a crest by slowly and parallely displacing the plane in the direction in which the number of picture elements increases. It is also possible to parallely displace the plane parallel with the coordinate plane in the direction in which the number of picture elements decreases from the maximum height of the two-dimensional histogram. In this case, the point where a closed region appears (or when the area exceeds 0) is determined as the crest of the mountain. When it is necessary to shorten the processing time, the accuracy is slightly degraded. However, it is also possible to obtain a crest by parallely displacing the plane in stages every predetermined number of picture elements. - In the
next step 522, a remarked mountain is selected in the two-dimensional histogram and the height of the mountain is taken in. Though the remarked mountain can be any one of the mountains of the two-dimensional histogram, the mountain M1 (Fig. 21) including the highest mountain M1b is selected for this embodiment. In thenext step 524, the maximum cross section corresponding to only the crest of the remarked mountain is obtained. To obtain the maximum cross section, as shown in Fig. 21A. the feature plane SI determined by the height V of the highest mountain M1b in the mountain M1 is slowly and parallely displaced in the direction in which the mountain height decreases. The height for parallely displacing the feature plane is determined by the threshold "v". The threshold "v" decreases from the mountain height V at the predetermined rate. The value decreasing at this predetermined rate can use a pre-set value. The two-dimensional histogram is cut out by the feature plane SI determined by the threshold "v". Parallel displacement of the feature plane is completed when the interval between the boundaries of the remarked closed region and other closed region reaches a predetermined value. Thus, when a plurality of mountains are overlapped, it is possible to obtain the maximum cross section assuming the portion up to the trough as a boundary. Moreover, parallel displacement is completed also when the threshold which is the height of the above plane decreases to a predetermined value (e.g. one picture element value) or less. Therefore, the maximum cross section up to the foot of a mountain with one crest can be obtained. Thus, the cross section corresponding to the highest mountain M1b comes to the closed region Eb1 which is shown as the hatched portion in Fig. 21C. - In the step 526, the processing (labeling) for attaching a label to the cross section of the remarked mountain is performed to identify the cut-out mountain. In the
next step 528, the labeled mountain is masked to judge in thestep 530 if any crest remains. If so, thestep 522 is restarted. Then, the above steps are repeated to divide all regions of the two-dimensional histogram of hue and saturation values into small mountains with one crest. - Fig. 22 shows the details of the
step 108 in Fig. 2. In thestep 632, the picture elements of an original image expressing the features of small mountains corresponding to each cross section are obtained as a core picture element in accordance with hue and saturation values within the hue- and saturation-value ranges of each cross section of a two-dimensional histogram on the feature plane specified by the threshold "v" of each mountain for obtaining the maximum cross section. This embodiment uses the picture elements on the original image corresponding to hue and saturation values including many picture elements (of mountain crest) in the mountain cut out by the feature plane specified by the threshold of each mountain {see symbols Z1 through Z6 in Fig. 23B}. More than one core picture element may be present on the original image corresponding to hue and saturation values of the crest of one mountain of a two-dimensional histogram. However, this embodiment uses one typical picture element (e.g. picture element at the position determined by an average value) as the core picture element corresponding to the crest of one mountain. It is also possible to obtain the hue and saturation values of the core picture element Z by computing the average values of hue and saturation values within the hue- and saturation-value ranges of the cross section on the feature plane of each mountain. - In the
next step 634, first, it is judged if the hue and saturation values of each picture element of the original image belong to the range of the above obtained cross section and picture elements are clustered to each color region. Fig. 23B shows an example in which an original image is divided and the picture elements of each region provided with symbols FD1 through FD6 correspond to the picture elements included in the cross sections provided with symbols SD1 through SD6 of each mountain. Then, the picture element (picture element to be unified) P1 other than the picture elements clustered on the original image is selected. The picture element P1 corresponds to the point P1 shown in Fig. 23A on the two-dimensional histogram. - In the
next step 636, the distances L1 through L6 between the core picture elements Z1 through Z6 and the picture element P1 to be unified are obtained on the original image and the label MD1 is given to the mountain corresponding to the core picture element 72 having the minimum distance L2 among these obtained distances L so that it will be identified as the mountain M1b as shown in Fig. 23B. In thenext step 638, the degree of similarity between each of the core picture elements Z1 through Z6 and the picture element P1 to be unified is obtained on the original image and the labels MD2 and MD3 are given to the mountain corresponding to the core picture elements Z with the highest degree of similarity and the next mountain so that the former can be discriminated from the latter. - The similarity between the core picture element and the picture element to be unified is judged by the number of and hue and saturation values of the picture elements included in the small mountains (cross sections) of the two-dimensional histogram corresponding to the core picture elements Z. For example, the degree of similarity can be judged by the T-value obtained through the T-test of the expression (17) shown below. The degree of similarity between the picture element to be unified and the mountain corresponding to the core picture element increases as the T-value obtained through the T-test decreases. Therefore, it is preferable to unify picture elements with a mountain having smaller T-value. It is also possible to obtain the degree of similarity by other method without using the T-test. For example, comparison with the picture element to be unified can be made through statistical processing in accordance with the average value of hue and saturation values of the picture element corresponding to each mountain, the shape (distribution of two-dimensional histogram) of each mountain, the number of picture elements of each mountain.

Where,
N: Number of picture elements corresponding to cut-out mountains
S2: Variance of picture elements corresponding to cut-out mountains on feature plane
y: Average of picture elements corresponding to cut-out mountains on feature plane
xm: Average of picture elements to be unified
Picture elements to be unified is unified to the mountain with a small distance and high degree of similarity on the original image by the obtained distance L and T-value indicating degree of similarity on the obtained original image. In this case, it is more certain to unify similar picture elements on the color original image to a group corresponding to the mountain corresponding to a near core picture element. For example, the shaded portion (hatched portion Cx) of a face and the portion of the tree (hatched portion Tx) having hue and saturation values similar to the shaded portion of the face shown in Fig. 24A may come to a region (Ar) close to the trough where a plurality of mountains are overlapped on the two-dimensional histogram as shown in Figs. 24B and 24C. Therefore, it is not clear whether the unified picture element Pz included in the region Ar belongs to the mountain corresponding to the face portion (Cp) or that corresponding to the tree portion (Tp). - However, as shown in Fig. 24A, the picture elements present on the original image frequently have a high degree of similarity with the region of the image around the picture elements. Therefore, in this case, the original image can be clustered by unifying the picture elements to a mountain belonging to a nearer region on the original image.
- Therefore, when the labels MD1 and MD2 are given to the same mountain in accordance with degree of similarity as described above, the picture element P1 to be unified is unified to the color region of the mountain as a picture element included in the mountain provided with the label MD1 in the
step 644. When the labels MD1 and MD3 are given to the same mountain, the picture element P1 to be unified is unified to the color region of the mountain as a picture element included in the mountain provided with the label MD1 in thestep 648. When the mountain provided with the label MD1 does not coincide with the mountain provided with the label MD2 or MD3, the picture element to be unified is unified preferentially to the color region of the mountain provided with the label MD2 with a high degree of similarity (step 646). - In the
next step 650, it is judged if all picture elements are unified. If not, thestep 634 is restarted to unify the picture elements of the original image. By repeating unification of the picture elements of the original image, all color regions of the original image can be clustered. When unification of all picture elements is completed, unified color regions of the original image are cut out in thestep 652. That is, the original image is divided and cut out so that divided original images will correspond to each hue region obtained through the above unification and this routine is completed. - As above mentioned, the crests of mountains of a two-dimensional histogram are detected, small mountains of the two-dimensional histogram are cut out by corresponding to each crest, the picture elements of the original image are unified in accordance with the cut-out small mountains, and the original image is divided by the unified color region. Thus, an original image can most preferably be divided even if a two-dimensional histogram cannot simply be divided because the shape of each small mountain differs when the two-dimensional histogram has a complex shape in which a plurality of mountains are overlapped.
- For this embodiment, the picture elements to be unified are unified to color regions by obtaining the degree of similarity and distance on the original image. However, it is also possible to unify the picture elements to be unified to color regions by obtaining only degree of similarity.
- For this embodiment, a case is described in which degree of similarity is obtained by using hue and saturation values. However, it is also possible to obtain degree of similarity in the feature space consisting of hue, saturation, and lightness.
- For this embodiment, picture elements are unified each other. However, regions can also be unified each other. In this case, it is preferable to unify the unifying regions by distance and degree of similarity by obtaining core picture elements similarly to the processing of the regions to be unified.
- This embodiment can use the judging methods described in the second, third, fourth, and fifth embodiments in addition to the judging method using the contour and internal structure of the region described in the first embodiment.
- Fig. 25 shows a modification made by applying the present invention to an exposure determination apparatus separated from a printer or printer processor. In Fig. 25, portions corresponding to those in Fig. 1 are provided with the same symbol and their description is omitted. The average
density computation circuit 38 is not always necessary. Instead, it is possible to use an integrating transmission-density detection circuit for detecting LATD of the entire screen. - Fig. 26 shows a face extraction circuit obtained by constituting the face extraction circuit in Fig. 25 by a plurality of
face extraction circuits face extraction circuits face extraction circuit 36₁ reads images for one frame for the time of t1, computes an exposure for the time of t2, and transfers the computation result for the time of t3. As soon as reading of images for one frame is completed by theface extraction circuit 36₁, the film is advanced by one frame, reading of images for one frame is started by theface extraction circuit 36₂, exposure-amount computation by theface extraction circuit 36₁ and image read by theface extraction circuit 36₂ are simultaneously performed, and subsequently parallel processing is continued by the face extraction circuits 36₃, 36₄,.... and 36n. - The time Tp required for the parallel processing of "mxn" frames is shown as follows:

The processing time Ts without performing the parallel processing is shown as follows:

Therefore, the speed can be increased by Ts/Tp times. In this case, Ts/Tp is shown as follows:
This parallel-processing system can also be applied to the printer in Fig. 1. - The present invention can also be applied not only to determination of exposure of a photo-printing equipment but to determination of exposure of a digital color printer, determination of copying conditions of a copying machine, determination of exposure of a camera, determination of display conditions of a CRT screen, and determination of exposure when a hard copy is made with magnetic image data.
Claims (11)
- A method of extracting feature image data, comprising the steps of:(a) dividing a color original image into many picture elements and resolving each picture element into three colors of red, green, and blue lights to photometrically measure them;(b) obtaining a histogram of hue values in accordance with the data obtained through photometry;(c) dividing the obtained histogram into mountains;(d) judging which mountain each picture element of the color original image belongs to, classifying picture elements into groups corresponding to the divided mountains, and dividing the color original image for each group; and(e) selecting at least one of the divided regions and extracting data for the selected region as feature image data.
- A feature image data extraction method according to Claim 1, wherein a two-dimensional histogram of hue values and saturation values is obtained in accordance with the data obtained through photometry in said step (b) and the obtained two-dimensional histogram is divided into mountains in said step (c).
- A feature image data extraction method according to Claim 1, wherein it is judged whether a divided region is a person's face or not when selecting divided regions and the region decided as the person's face is selected.
- A feature image data extraction method according to Claim 2, wherein it is judged whether a divided region is a person's face or not when selecting divided regions and the region decided as the person's face is selected.
- A method of extracting feature image data, comprising the steps of:(a) dividing a color original image into many picture elements and resolving each picture element into three colors of red, green, and blue lights to photometrically measure them;(b) obtaining a two-dimensional histogram of hue and saturation values in accordance with the data obtained through photometry;(c) cutting the two-dimensional histogram by a feature plane parallel with a coordinate plane including a cross section corresponding to the crest of a certain mountain of the obtained two-dimensional histogram and also including hue- and saturation-value axes of the two-dimensional histogram to obtain the cross sections of the two-dimensional histogram;(d) expanding each cross section until the interval between boundaries of adjacent cross sections on the feature plane decreases to a predetermined value or less or performing exclusive expansion for expanding cross sections until the frequency of cross-sectional boundaries decreases to the minimum value or a predetermined value close to the minimum value or less to divide the two-dimensional histogram every mountain at cross-sectional boundaries after exclusive expansion;(e) judging which divided mountain each picture element of the color original image belongs to in order to divide picture elements into groups corresponding to the divided mountains and divide the color original image every group; and(f) selecting at least one of the divided regions to extract the data for the selected region as feature image data.
- A feature image data extraction method according to Claim 5, wherein it is judged whether a divided region is a person's face or not when selecting regions to select the region decided as the person's face.
- A method of extracting feature image data, comprising the steps of:(a) dividing a color original image into many picture elements and resolving each picture element into three colors of red, green, and blue lights to photometrically measure them;(b) obtaining a two-dimensional histogram of hue and saturation values in accordance with the data obtained through photometry;(c) dividing each mountain of the obtained two-dimensional histogram into small mountains with one crest respectively by a feature plane which is parallel with a coordinate plane including hue- and saturation-value axes of the two-dimensional histogram and includes the largest cross section corresponding to only the crest of one mountain;(d) judging which said small mountain each picture element of the color original image is included in to classify the picture elements into groups corresponding to each small mountain;(e) obtaining degree of similarity between at least one picture element included in each small mountain and picture elements excluded from said small mountain for each small mountain in accordance with hue and saturation values;(f) unifying the picture elements excluded from said small mountain to groups corresponding to each small mountain with a high degree of similarity of obtained similarity degree;(g) dividing the color original image for each unified group; and(h) selecting at least one of the divided regions to extract the data for the selected region as feature image data.
- A feature image date extraction method according to Claim 7, wherein it is judged which said small mountain each picture element of the color original image is included in to classify the picture elements into groups corresponding to each small mountain and obtain the core picture elements of the color original image corresponding to the crest of each small mountain in said step (d) and in the color original image it is judged whether or not the distance between each of the picture elements excluded from said small mountain and each of the obtained core picture elements is minimum to obtain the degree of similarity between at least one picture element included in each small mountain and the picture elements excluded from said small mountain for each small mountain in said step (e).
- A feature image data extraction method according to Claim 7, wherein it is judged which said small mountain each picture element of the color original image is included in to classify the picture elements into groups corresponding to each small mountain and to obtain the core picture elements of the color original image corresponding to the crest of each small mountain in said step (d), and the degree of similarity between at least one picture element included in each small mountain and the picture elements excluded from said mountain is obtained for each small mountain in accordance with hue and saturation values and in the color original image it is judged whether or not the distance between each of the picture elements excluded from said small mountain and each of the obtained core picture elements is minimum to obtain the degree of similarity between at least one picture element included in each small mountain and the picture elements excluded from said small mountain for each small mountain in said step (e).
- A method of extracting person's face data, comprising the steps of:(a) dividing a color original image into many picture elements and resolving each picture element into three colors of red, green, and blue lights to photometrically measure them;(b) obtaining color regions with the same or similar hue on said color original image in accordance with the data obtained through photometry;(c) assuming circles or ellipses inscribed to the boundary portions of the obtained color regions and dividing the color regions obtained by circular or elliptic regions from the largest circle or ellipse in order; and(d) selecting at least one of the divided regions to extract the data for the selected region as person's face data.
- A method of extracting person's face data, comprising the steps of:(a) dividing a color original image into many picture elements and resolving each picture element into three colors of red, green, and blue lights to photometrically measure them;(b) obtaining color regions with the same or similar hue on said color original image in accordance with the data obtained through photometry;(c) assuming circles or ellipses inscribed to the boundary portions of the obtained color regions to obtain the largest circular or elliptic region;(d) obtaining a convex region having a predetermined area or more protruded outward from the circumference of a circle or ellipse and contacted to said obtained region to divide said color region by the circular region inscribed to the boundary portion of the color regions included in said convex portion; and(e) selecting at least one of the divided regions to extract the data for the selected region as person's face data.
Applications Claiming Priority (8)
| Application Number | Priority Date | Filing Date | Title |
|---|---|---|---|
| JP11874691A JP2638693B2 (en) | 1991-05-23 | 1991-05-23 | Feature image data extraction method |
| JP118746/91 | 1991-05-23 | ||
| JP321596/91 | 1991-12-05 | ||
| JP32159691A JP2638701B2 (en) | 1991-12-05 | 1991-12-05 | Feature image data extraction method |
| JP32899891A JP2763221B2 (en) | 1991-12-12 | 1991-12-12 | How to extract human face data |
| JP328998/91 | 1991-12-12 | ||
| JP328997/91 | 1991-12-12 | ||
| JP32899791A JP2638702B2 (en) | 1991-12-12 | 1991-12-12 | Feature image data extraction method |
Publications (3)
| Publication Number | Publication Date |
|---|---|
| EP0514933A2 true EP0514933A2 (en) | 1992-11-25 |
| EP0514933A3 EP0514933A3 (en) | 1992-12-16 |
| EP0514933B1 EP0514933B1 (en) | 1997-07-30 |
Family
ID=27470549
Family Applications (1)
| Application Number | Title | Priority Date | Filing Date |
|---|---|---|---|
| EP92108701A Expired - Lifetime EP0514933B1 (en) | 1991-05-23 | 1992-05-22 | Method of extracting feature image data |
Country Status (3)
| Country | Link |
|---|---|
| US (1) | US5309228A (en) |
| EP (1) | EP0514933B1 (en) |
| DE (1) | DE69221210T2 (en) |
Cited By (6)
| Publication number | Priority date | Publication date | Assignee | Title |
|---|---|---|---|---|
| EP0735757A1 (en) * | 1995-03-30 | 1996-10-02 | C-Vis Computer Vision und Automation GmbH | Method and apparatus for automatically taking pictures of a person's face |
| EP0756426A3 (en) * | 1995-07-28 | 1997-08-06 | Sharp Kk | Specified image-area extracting method and device for producing video information |
| EP0959616A2 (en) * | 1998-05-21 | 1999-11-24 | Noritsu Koki Co., Ltd. | System for processing photographic images |
| EP2884733A1 (en) * | 2013-12-12 | 2015-06-17 | Samsung Electronics Co., Ltd | Display device and method of controlling the same |
| US11100628B2 (en) | 2019-02-07 | 2021-08-24 | Applied Materials, Inc. | Thickness measurement of substrate using color metrology |
| US11715193B2 (en) | 2015-11-16 | 2023-08-01 | Applied Materials, Inc. | Color imaging for CMP monitoring |
Families Citing this family (32)
| Publication number | Priority date | Publication date | Assignee | Title |
|---|---|---|---|---|
| US5463470A (en) * | 1991-10-09 | 1995-10-31 | Fuji Photo Film Co., Ltd. | Methods of collecting photometric image data and determining light exposure by extracting feature image data from an original image |
| DE4318526C2 (en) * | 1992-06-10 | 1999-11-25 | Canon Kk | Image input device |
| US5557688A (en) * | 1992-11-18 | 1996-09-17 | Fuji Photo Film Co., Ltd. | Method of extracting characteristic image data and color data conversion device for image processing apparatus |
| US5842194A (en) * | 1995-07-28 | 1998-11-24 | Mitsubishi Denki Kabushiki Kaisha | Method of recognizing images of faces or general images using fuzzy combination of multiple resolutions |
| JP3652417B2 (en) * | 1995-10-19 | 2005-05-25 | 富士写真フイルム株式会社 | Image processing device |
| JPH09163161A (en) * | 1995-12-01 | 1997-06-20 | Brother Ind Ltd | Picture processor |
| JPH09171220A (en) * | 1995-12-20 | 1997-06-30 | Fuji Photo Film Co Ltd | Exposure deciding method |
| JP3614863B2 (en) * | 1997-11-19 | 2005-01-26 | 株式会社山武 | Classification model generation method and recording medium |
| WO1999057683A1 (en) | 1998-05-04 | 1999-11-11 | The Johns Hopkins University | Method and apparatus for segmenting small structures in images |
| JP2000048184A (en) * | 1998-05-29 | 2000-02-18 | Canon Inc | Method for processing image, and method for extracting facial area and device therefor |
| US6516100B1 (en) | 1998-10-29 | 2003-02-04 | Sharp Laboratories Of America, Inc. | Method for image characterization using color and texture statistics with embedded spatial information |
| US6542632B1 (en) | 1999-02-01 | 2003-04-01 | Sharp Laboratories Of America, Inc. | Method for image characterization using color and texture statistics with embedded spatial information |
| JP2001014457A (en) * | 1999-06-29 | 2001-01-19 | Minolta Co Ltd | Image processor |
| WO2001015409A2 (en) * | 1999-08-20 | 2001-03-01 | Digital Now, Inc. | Color density exposure control |
| EP1247396B1 (en) | 1999-12-16 | 2008-06-11 | Muvee Technologies Pte Ltd. | System and method for video production |
| JP2001186323A (en) * | 1999-12-24 | 2001-07-06 | Fuji Photo Film Co Ltd | Identification photograph system and picture on processing method |
| DE60138073D1 (en) * | 2000-07-12 | 2009-05-07 | Canon Kk | Image processing method and image processing apparatus |
| US7062084B2 (en) * | 2000-12-01 | 2006-06-13 | Sharp Laboratories Of America, Inc. | Method for image description using color and local spatial information |
| GB2380599B (en) * | 2000-12-22 | 2003-10-29 | Kent Ridge Digital Labs | System and method for media production |
| US7170633B2 (en) | 2001-01-23 | 2007-01-30 | Minolta Co., Ltd. | Imaging apparatus |
| US6983068B2 (en) * | 2001-09-28 | 2006-01-03 | Xerox Corporation | Picture/graphics classification system and method |
| US7119924B2 (en) * | 2001-09-28 | 2006-10-10 | Xerox Corporation | Detection and segmentation of sweeps in color graphics images |
| US6985628B2 (en) * | 2002-01-07 | 2006-01-10 | Xerox Corporation | Image type classification using edge features |
| US6996277B2 (en) * | 2002-01-07 | 2006-02-07 | Xerox Corporation | Image type classification using color discreteness features |
| US7440611B2 (en) * | 2002-01-31 | 2008-10-21 | Sharp Laboratories Of America, Inc. | Method for image characterization using color and texture statistics with embedded spatial information |
| JP4803944B2 (en) * | 2002-07-19 | 2011-10-26 | 大日本スクリーン製造株式会社 | Printed matter measuring method and printed matter measuring apparatus |
| JP4344925B2 (en) * | 2003-12-15 | 2009-10-14 | 富士フイルム株式会社 | Image processing apparatus, image processing method, and printing system |
| US7796827B2 (en) * | 2004-11-30 | 2010-09-14 | Hewlett-Packard Development Company, L.P. | Face enhancement in a digital video |
| TW200737996A (en) * | 2006-03-24 | 2007-10-01 | Marketech Int Corp | Hue dividing and judging device |
| US8693743B1 (en) | 2010-02-19 | 2014-04-08 | Olive Tree Media, LLC | Analysis and display of multiple biomarker co-expression in cells and tissues |
| JP5836095B2 (en) * | 2011-12-05 | 2015-12-24 | キヤノン株式会社 | Image processing apparatus and image processing method |
| US11557048B2 (en) | 2015-11-16 | 2023-01-17 | Applied Materials, Inc. | Thickness measurement of substrate using color metrology |
Citations (6)
| Publication number | Priority date | Publication date | Assignee | Title |
|---|---|---|---|---|
| DE2925264A1 (en) * | 1979-06-22 | 1981-01-15 | Agfa Gevaert Ag | METHOD FOR DETERMINING CORRECTION VALUES |
| US4294537A (en) * | 1979-03-23 | 1981-10-13 | Pako Corporation | Photographic reprint system with information display |
| FR2600783A1 (en) * | 1986-06-26 | 1987-12-31 | Kis Photo Ind | Colour analysing device for apparatus used in printing negatives of photographic films |
| US4805016A (en) * | 1986-08-25 | 1989-02-14 | Kabushiki Kaisha Toshiba | Endoscopic system for converting primary color images into hue, saturation and intensity images |
| US4984013A (en) * | 1988-04-26 | 1991-01-08 | Fuji Photo Film Co., Ltd. | Method for controlling exposure amount in copying of color originals |
| EP0514909A1 (en) * | 1991-05-23 | 1992-11-25 | Fuji Photo Film Co., Ltd. | Method of determining exposure |
Family Cites Families (16)
| Publication number | Priority date | Publication date | Assignee | Title |
|---|---|---|---|---|
| JPS52156624A (en) * | 1976-06-22 | 1977-12-27 | Fuji Photo Film Co Ltd | Detection of skin color of color film |
| JPS52156625A (en) * | 1976-06-22 | 1977-12-27 | Fuji Photo Film Co Ltd | Automatic color printing method utili#ing skin color |
| JPS5312330A (en) * | 1976-07-20 | 1978-02-03 | Fuji Photo Film Co Ltd | Color printer and control of its exposure time |
| JPS53145620A (en) * | 1977-05-25 | 1978-12-19 | Fuji Photo Film Co Ltd | Hue extractor |
| JPS53145622A (en) * | 1977-05-25 | 1978-12-19 | Fuji Photo Film Co Ltd | Hue extractor |
| JPS53145621A (en) * | 1977-05-25 | 1978-12-19 | Fuji Photo Film Co Ltd | Hue extractor |
| GB8425339D0 (en) * | 1984-10-08 | 1984-11-14 | Crosfield Electronics Ltd | Reproduction of coloured images |
| JPS62115432A (en) * | 1985-11-15 | 1987-05-27 | Fuji Photo Film Co Ltd | Method for indicating principal object |
| JPS62115430A (en) * | 1985-11-15 | 1987-05-27 | Fuji Photo Film Co Ltd | Principal object indicating device |
| JPS62115431A (en) * | 1985-11-15 | 1987-05-27 | Fuji Photo Film Co Ltd | Method and device for indicating principal object |
| JPS62189456A (en) * | 1986-02-17 | 1987-08-19 | Fuji Photo Film Co Ltd | Main picture detection method and photographic printing exposure decision method employing said detection |
| JPH0640198B2 (en) * | 1986-02-17 | 1994-05-25 | 富士写真フイルム株式会社 | Method for detecting main image and method for determining exposure amount for photo printing using the same |
| JPS63138340A (en) * | 1986-12-01 | 1988-06-10 | Fuji Photo Film Co Ltd | Method for determining quantity of copy exposure |
| JPS63178222A (en) * | 1987-01-19 | 1988-07-22 | Fuji Photo Film Co Ltd | Copying exposure quantity determining device |
| US5204948A (en) * | 1989-09-08 | 1993-04-20 | Advantest Corporation | Method and apparatus for evaluating color image signals |
| US5206918A (en) * | 1991-04-03 | 1993-04-27 | Kraft General Foods, Inc. | Color analysis based upon transformation to spherical coordinates |
-
1992
- 1992-05-21 US US07/886,610 patent/US5309228A/en not_active Expired - Lifetime
- 1992-05-22 EP EP92108701A patent/EP0514933B1/en not_active Expired - Lifetime
- 1992-05-22 DE DE69221210T patent/DE69221210T2/en not_active Expired - Lifetime
Patent Citations (6)
| Publication number | Priority date | Publication date | Assignee | Title |
|---|---|---|---|---|
| US4294537A (en) * | 1979-03-23 | 1981-10-13 | Pako Corporation | Photographic reprint system with information display |
| DE2925264A1 (en) * | 1979-06-22 | 1981-01-15 | Agfa Gevaert Ag | METHOD FOR DETERMINING CORRECTION VALUES |
| FR2600783A1 (en) * | 1986-06-26 | 1987-12-31 | Kis Photo Ind | Colour analysing device for apparatus used in printing negatives of photographic films |
| US4805016A (en) * | 1986-08-25 | 1989-02-14 | Kabushiki Kaisha Toshiba | Endoscopic system for converting primary color images into hue, saturation and intensity images |
| US4984013A (en) * | 1988-04-26 | 1991-01-08 | Fuji Photo Film Co., Ltd. | Method for controlling exposure amount in copying of color originals |
| EP0514909A1 (en) * | 1991-05-23 | 1992-11-25 | Fuji Photo Film Co., Ltd. | Method of determining exposure |
Cited By (13)
| Publication number | Priority date | Publication date | Assignee | Title |
|---|---|---|---|---|
| DE19511713A1 (en) * | 1995-03-30 | 1996-10-10 | C Vis Computer Vision Und Auto | Method and device for automatic image recording of faces |
| US5864363A (en) * | 1995-03-30 | 1999-01-26 | C-Vis Computer Vision Und Automation Gmbh | Method and device for automatically taking a picture of a person's face |
| EP0735757A1 (en) * | 1995-03-30 | 1996-10-02 | C-Vis Computer Vision und Automation GmbH | Method and apparatus for automatically taking pictures of a person's face |
| US6088137A (en) * | 1995-07-28 | 2000-07-11 | Sharp Kabushiki Kaisha | Specified image-area extracting method and device |
| EP0756426A3 (en) * | 1995-07-28 | 1997-08-06 | Sharp Kk | Specified image-area extracting method and device for producing video information |
| EP0959616A3 (en) * | 1998-05-21 | 2003-03-12 | Noritsu Koki Co., Ltd. | System for processing photographic images |
| EP0959616A2 (en) * | 1998-05-21 | 1999-11-24 | Noritsu Koki Co., Ltd. | System for processing photographic images |
| US6574362B1 (en) | 1998-05-21 | 2003-06-03 | Noritsu Koki Co., Ltd. | Method and apparatus for mask-processing a photographed image |
| EP2884733A1 (en) * | 2013-12-12 | 2015-06-17 | Samsung Electronics Co., Ltd | Display device and method of controlling the same |
| US9582708B2 (en) | 2013-12-12 | 2017-02-28 | Samsung Electronics Co., Ltd. | Display device and method of controlling the same |
| US11715193B2 (en) | 2015-11-16 | 2023-08-01 | Applied Materials, Inc. | Color imaging for CMP monitoring |
| US11100628B2 (en) | 2019-02-07 | 2021-08-24 | Applied Materials, Inc. | Thickness measurement of substrate using color metrology |
| US11776109B2 (en) | 2019-02-07 | 2023-10-03 | Applied Materials, Inc. | Thickness measurement of substrate using color metrology |
Also Published As
| Publication number | Publication date |
|---|---|
| EP0514933A3 (en) | 1992-12-16 |
| DE69221210T2 (en) | 1997-11-27 |
| EP0514933B1 (en) | 1997-07-30 |
| US5309228A (en) | 1994-05-03 |
| DE69221210D1 (en) | 1997-09-04 |
Similar Documents
| Publication | Publication Date | Title |
|---|---|---|
| US5309228A (en) | Method of extracting feature image data and method of extracting person's face data | |
| US5278921A (en) | Method of determining exposure | |
| US5557688A (en) | Method of extracting characteristic image data and color data conversion device for image processing apparatus | |
| US5463470A (en) | Methods of collecting photometric image data and determining light exposure by extracting feature image data from an original image | |
| US6940545B1 (en) | Face detecting camera and method | |
| JP3490559B2 (en) | Method for determining main part of image and method for determining copy conditions | |
| US6023524A (en) | Method for determining amount of exposure | |
| JPH0863597A (en) | Face extracting method | |
| US20040114797A1 (en) | Method for automatic determination of color-density correction values for the reproduction of digital image data | |
| EP1662314B1 (en) | Photograph image-processing method and device thereof | |
| JP2695067B2 (en) | Method of extracting data of human face and method of determining exposure amount | |
| EP0601363B1 (en) | Method of determining amount of exposure | |
| JP3499305B2 (en) | Face area extraction method and exposure amount determination method | |
| JP3516786B2 (en) | Face area extraction method and copy condition determination method | |
| JP2638691B2 (en) | Exposure determination method | |
| JP2848749B2 (en) | Feature image data extraction method | |
| JP2638702B2 (en) | Feature image data extraction method | |
| JPS6352367B2 (en) | ||
| JP2638693B2 (en) | Feature image data extraction method | |
| JP2638701B2 (en) | Feature image data extraction method | |
| JP2642262B2 (en) | Exposure determination method | |
| JP2763221B2 (en) | How to extract human face data | |
| JP2848750B2 (en) | Exposure determination method | |
| JP2923401B2 (en) | Exposure determination method | |
| JP2638692B2 (en) | Method of extracting data of human face and method of determining exposure amount |
Legal Events
| Date | Code | Title | Description |
|---|---|---|---|
| PUAI | Public reference made under article 153(3) epc to a published international application that has entered the european phase |
Free format text: ORIGINAL CODE: 0009012 |
|
| PUAL | Search report despatched |
Free format text: ORIGINAL CODE: 0009013 |
|
| AK | Designated contracting states |
Kind code of ref document: A2 Designated state(s): DE FR GB |
|
| AK | Designated contracting states |
Kind code of ref document: A3 Designated state(s): DE FR GB |
|
| 17P | Request for examination filed |
Effective date: 19930526 |
|
| 17Q | First examination report despatched |
Effective date: 19950403 |
|
| GRAG | Despatch of communication of intention to grant |
Free format text: ORIGINAL CODE: EPIDOS AGRA |
|
| GRAH | Despatch of communication of intention to grant a patent |
Free format text: ORIGINAL CODE: EPIDOS IGRA |
|
| GRAH | Despatch of communication of intention to grant a patent |
Free format text: ORIGINAL CODE: EPIDOS IGRA |
|
| GRAA | (expected) grant |
Free format text: ORIGINAL CODE: 0009210 |
|
| AK | Designated contracting states |
Kind code of ref document: B1 Designated state(s): DE FR GB |
|
| REF | Corresponds to: |
Ref document number: 69221210 Country of ref document: DE Date of ref document: 19970904 |
|
| ET | Fr: translation filed | ||
| PLBE | No opposition filed within time limit |
Free format text: ORIGINAL CODE: 0009261 |
|
| STAA | Information on the status of an ep patent application or granted ep patent |
Free format text: STATUS: NO OPPOSITION FILED WITHIN TIME LIMIT |
|
| 26N | No opposition filed | ||
| REG | Reference to a national code |
Ref country code: GB Ref legal event code: IF02 |
|
| REG | Reference to a national code |
Ref country code: GB Ref legal event code: 732E |
|
| REG | Reference to a national code |
Ref country code: FR Ref legal event code: CD Ref country code: FR Ref legal event code: TP |
|
| PGFP | Annual fee paid to national office [announced via postgrant information from national office to epo] |
Ref country code: FR Payment date: 20110523 Year of fee payment: 20 |
|
| PGFP | Annual fee paid to national office [announced via postgrant information from national office to epo] |
Ref country code: GB Payment date: 20110518 Year of fee payment: 20 |
|
| PGFP | Annual fee paid to national office [announced via postgrant information from national office to epo] |
Ref country code: DE Payment date: 20110427 Year of fee payment: 20 |
|
| REG | Reference to a national code |
Ref country code: DE Ref legal event code: R071 Ref document number: 69221210 Country of ref document: DE |
|
| REG | Reference to a national code |
Ref country code: GB Ref legal event code: PE20 Expiry date: 20120521 |
|
| PG25 | Lapsed in a contracting state [announced via postgrant information from national office to epo] |
Ref country code: GB Free format text: LAPSE BECAUSE OF EXPIRATION OF PROTECTION Effective date: 20120521 |
|
| PG25 | Lapsed in a contracting state [announced via postgrant information from national office to epo] |
Ref country code: DE Free format text: LAPSE BECAUSE OF EXPIRATION OF PROTECTION Effective date: 20120523 |