EP0426829B1 - High sensitivity fluorescent single particle and single molecule detection apparatus and method - Google Patents
High sensitivity fluorescent single particle and single molecule detection apparatus and method Download PDFInfo
- Publication number
- EP0426829B1 EP0426829B1 EP90908805A EP90908805A EP0426829B1 EP 0426829 B1 EP0426829 B1 EP 0426829B1 EP 90908805 A EP90908805 A EP 90908805A EP 90908805 A EP90908805 A EP 90908805A EP 0426829 B1 EP0426829 B1 EP 0426829B1
- Authority
- EP
- European Patent Office
- Prior art keywords
- particles
- molecules
- output
- volume
- energy
- Prior art date
- Legal status (The legal status is an assumption and is not a legal conclusion. Google has not performed a legal analysis and makes no representation as to the accuracy of the status listed.)
- Expired - Lifetime
Links
- 239000002245 particle Substances 0.000 title claims abstract description 73
- 238000000034 method Methods 0.000 title claims description 19
- 230000035945 sensitivity Effects 0.000 title description 5
- 238000004557 single molecule detection Methods 0.000 title 1
- 239000012530 fluid Substances 0.000 claims abstract description 16
- 238000001514 detection method Methods 0.000 claims abstract description 14
- 238000012545 processing Methods 0.000 claims description 5
- 230000001419 dependent effect Effects 0.000 claims 1
- 238000005286 illumination Methods 0.000 claims 1
- 239000000758 substrate Substances 0.000 abstract description 15
- 239000000523 sample Substances 0.000 description 13
- 238000010586 diagram Methods 0.000 description 6
- 230000005284 excitation Effects 0.000 description 6
- 238000002474 experimental method Methods 0.000 description 6
- 230000003595 spectral effect Effects 0.000 description 6
- 238000001069 Raman spectroscopy Methods 0.000 description 4
- 238000010521 absorption reaction Methods 0.000 description 4
- 238000011160 research Methods 0.000 description 4
- 239000000539 dimer Substances 0.000 description 3
- 239000000178 monomer Substances 0.000 description 3
- XKRFYHLGVUSROY-UHFFFAOYSA-N Argon Chemical compound [Ar] XKRFYHLGVUSROY-UHFFFAOYSA-N 0.000 description 2
- 239000007788 liquid Substances 0.000 description 2
- OALHHIHQOFIMEF-UHFFFAOYSA-N 3',6'-dihydroxy-2',4',5',7'-tetraiodo-3h-spiro[2-benzofuran-1,9'-xanthene]-3-one Chemical compound O1C(=O)C2=CC=CC=C2C21C1=CC(I)=C(O)C(I)=C1OC1=C(I)C(O)=C(I)C=C21 OALHHIHQOFIMEF-UHFFFAOYSA-N 0.000 description 1
- 241000894006 Bacteria Species 0.000 description 1
- 241000700605 Viruses Species 0.000 description 1
- 229910052786 argon Inorganic materials 0.000 description 1
- 230000008033 biological extinction Effects 0.000 description 1
- VYXSBFYARXAAKO-WTKGSRSZSA-N chembl402140 Chemical compound Cl.C1=2C=C(C)C(NCC)=CC=2OC2=C\C(=N/CC)C(C)=CC2=C1C1=CC=CC=C1C(=O)OCC VYXSBFYARXAAKO-WTKGSRSZSA-N 0.000 description 1
- 238000005315 distribution function Methods 0.000 description 1
- 230000000694 effects Effects 0.000 description 1
- 230000007613 environmental effect Effects 0.000 description 1
- 230000005281 excited state Effects 0.000 description 1
- 239000012634 fragment Substances 0.000 description 1
- 239000011521 glass Substances 0.000 description 1
- 230000010354 integration Effects 0.000 description 1
- 238000001499 laser induced fluorescence spectroscopy Methods 0.000 description 1
- 239000000463 material Substances 0.000 description 1
- 238000012986 modification Methods 0.000 description 1
- 230000004048 modification Effects 0.000 description 1
- 230000003287 optical effect Effects 0.000 description 1
- 238000005457 optimization Methods 0.000 description 1
- 230000010287 polarization Effects 0.000 description 1
- 238000006862 quantum yield reaction Methods 0.000 description 1
- 239000012488 sample solution Substances 0.000 description 1
- 238000005070 sampling Methods 0.000 description 1
- 239000002904 solvent Substances 0.000 description 1
- 238000012360 testing method Methods 0.000 description 1
- 238000013519 translation Methods 0.000 description 1
Images


Classifications
-
- G—PHYSICS
- G01—MEASURING; TESTING
- G01N—INVESTIGATING OR ANALYSING MATERIALS BY DETERMINING THEIR CHEMICAL OR PHYSICAL PROPERTIES
- G01N21/00—Investigating or analysing materials by the use of optical means, i.e. using sub-millimetre waves, infrared, visible or ultraviolet light
- G01N21/62—Systems in which the material investigated is excited whereby it emits light or causes a change in wavelength of the incident light
- G01N21/63—Systems in which the material investigated is excited whereby it emits light or causes a change in wavelength of the incident light optically excited
- G01N21/64—Fluorescence; Phosphorescence
- G01N21/645—Specially adapted constructive features of fluorimeters
-
- G—PHYSICS
- G01—MEASURING; TESTING
- G01N—INVESTIGATING OR ANALYSING MATERIALS BY DETERMINING THEIR CHEMICAL OR PHYSICAL PROPERTIES
- G01N15/00—Investigating characteristics of particles; Investigating permeability, pore-volume, or surface-area of porous materials
- G01N15/10—Investigating individual particles
- G01N15/14—Electro-optical investigation, e.g. flow cytometers
- G01N15/1468—Electro-optical investigation, e.g. flow cytometers with spatial resolution of the texture or inner structure of the particle
- G01N15/147—Electro-optical investigation, e.g. flow cytometers with spatial resolution of the texture or inner structure of the particle the analysis being performed on a sample stream
-
- G—PHYSICS
- G01—MEASURING; TESTING
- G01N—INVESTIGATING OR ANALYSING MATERIALS BY DETERMINING THEIR CHEMICAL OR PHYSICAL PROPERTIES
- G01N15/00—Investigating characteristics of particles; Investigating permeability, pore-volume, or surface-area of porous materials
- G01N15/10—Investigating individual particles
- G01N15/14—Electro-optical investigation, e.g. flow cytometers
- G01N15/1429—Electro-optical investigation, e.g. flow cytometers using an analyser being characterised by its signal processing
-
- G01N15/1433—
-
- G—PHYSICS
- G01—MEASURING; TESTING
- G01N—INVESTIGATING OR ANALYSING MATERIALS BY DETERMINING THEIR CHEMICAL OR PHYSICAL PROPERTIES
- G01N15/00—Investigating characteristics of particles; Investigating permeability, pore-volume, or surface-area of porous materials
- G01N15/02—Investigating particle size or size distribution
- G01N15/0205—Investigating particle size or size distribution by optical means, e.g. by light scattering, diffraction, holography or imaging
- G01N15/0211—Investigating a scatter or diffraction pattern
- G01N2015/0222—Investigating a scatter or diffraction pattern from dynamic light scattering, e.g. photon correlation spectroscopy
-
- G—PHYSICS
- G01—MEASURING; TESTING
- G01N—INVESTIGATING OR ANALYSING MATERIALS BY DETERMINING THEIR CHEMICAL OR PHYSICAL PROPERTIES
- G01N21/00—Investigating or analysing materials by the use of optical means, i.e. using sub-millimetre waves, infrared, visible or ultraviolet light
- G01N21/62—Systems in which the material investigated is excited whereby it emits light or causes a change in wavelength of the incident light
- G01N21/63—Systems in which the material investigated is excited whereby it emits light or causes a change in wavelength of the incident light optically excited
- G01N21/64—Fluorescence; Phosphorescence
- G01N21/645—Specially adapted constructive features of fluorimeters
- G01N21/6456—Spatial resolved fluorescence measurements; Imaging
Definitions
- This invention relates generally to an apparatus and method for the detection of individual fluorescent particles down to the single molecule limit, and more particularly, to an apparatus and method for measuring the concentration of fluorescent particles or molecules in a fluid solution, or for locating and/or counting fluorescent particles or molecules on surfaces or in films.
- U.S. Patent 4,778,593 teaches discrimination of minute particles, such as biological particles or organic polymers.
- the particles are suspended in a liquid with individual particles substantially separated from each other as they flow in a liquid stream.
- the particle stream is irradiated with a high-intensity light beam, and the stream is then formed into droplets, each of which contains a particle.
- the particles are discriminated in accordance with the change in light energy emitted by the particles over a period of time; that is, each particle emits light for a given time, depending on its size and characteristics.
- the particles are sorted by deflecting the droplets in accordance with the change in emitted energy.
- U.S. Patent 4,021,117 teaches a method of counting and analyzing pulses representative of characteristics of particles passing through a detection device. The amplitude of each pulse is detected, the area under each pulse above a reference level is determined and a ratio of amplitude-to-measured-area is obtained. The apparatus is used to discriminate against the passage of multiple particles through the sensing zone of the device.
- the prior art does not provide a method and apparatus which can provide rapid ultrasensitive detection and counting of fluorescent particles down to the single molecule limit, nor does the prior art provide a method for determining the optimal conditions to obtain this high detection sensitivity.
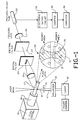
- FIGURE 1 is a schematic diagram of the preferred embodiment of the present apparatus in which the particles are presented in a fluid stream.
- FIGURE 2 is a block diagram of the electronic gating circuit of FIGURE 1 showing the signal input and output at various points in the circuit.
- FIGURE 3 is another embodiment of the gating circuit of FIGURE 1.
- FIGURE 4 shows still another embodiment of the gating circuit of FIGURE 1.
- FIGURE 5 shows a digital circuit embodiment of the gating circuit.
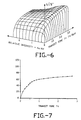
- FIGURE 6 shows the laser intensity and particle transit time for optimum signal-to-noise conditions.
- FIGURE 7 is a plot of optimal signal-to-noise ratio at optimal laser intensities as a function of transit time.
- FIGURE 8 is a plot showing the results of operation of the apparatus of FIGURE 1.
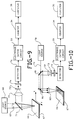
- FIGURE 9 is a schematic block diagram of another embodiment of this invention for counting and locating fluorescent particles or molecules on a substrate.
- FIGURE 10 is a schematic diagram of still another embodiment of this invention for counting and locating fluorescent particles or molecules on a substrate.
- FIGURE 11 is a schematic diagram of a further embodiment of this invention for counting and locating fluorescent particles or molecules on a substrate.
- a laser beam 11 is projected by a laser 12 through a polarizer 13 and focused by a lens 14 onto to the fluid stream as shown by the focused beam 16.
- the beam is focused onto flowing sample fluid stream 17 flowing in a capillary tube 18.
- Schematically shown is a flow control means 19 which serves to control the flow velocity of the stream 17.
- the laser polarization is oriented in the scattering plane by the polarizer 13 to minimize background scattering.
- the laser beam illuminates the area 21 shown in the enlarged view 22.
- An image of the illuminated volume is imaged onto a spatial filter 23 by the objective lens 24.
- the spatial filter 23 reduces the illuminated area and volume which is probed to the volume shown by reference number 26.
- the spatial filter defines the height and width of the probe volume.
- a spectral filter 28 rejects scattered Rayleigh and Raman emission from the illuminated volume.
- the energy passing spatial and spectral filters is focused by a focusing lens 28 onto a phototransducer 29 which may be a photomultiplier tube or any other type of phototransducer having the requisite sensitivity.
- a burst of photons are generated.
- This burst of photons, together with the background emission, is detected by the photomultiplier tube which provides an output signal.
- This output signal is applied to an electronic gating circuit 33 which is designed to look for bursts of particular amplitude and duration.
- the bursts of interest have a duration equal to the transit time through the volume and at least a minimum amplitude.
- the resulting signal is applied to counter 34 and to a computer 36, which can process and store the processed counts over predetermined times to provide an indication of concentration or other relevant information.
- the output from the photomultiplier tube is shown in FIGURE 2A and is comprised of a plurality of photon bursts including both low frequency background emission 38 representing Rayleigh and Raman scattering, and high frequency bursts 39 representing a particle traveling through the probe volume, and electronic noise 40.
- the signal from the photomultiplier tube is supplied to a pulse height discriminator 41 which passes pulses with predetermined amplitudes and then to a frequency to voltage converter 42 which converts the frequency of pulses to a voltage 43. Thereafter, the voltage 43 is applied to a pulse height discriminator 44 which provides a pair of output pulses 46, 47 and discriminates against low frequency background emissions.
- a pulse-width-to-voltage converter 48 receives the pulses and provides the output shown at 51, 52, FIGURE 2E.
- a pulse height discriminator 53 detects the pulses 51 and 52 and provides an output pulse 54 when the pulse 52 exceeds a predetermined amplitude or lies within a predetermined range indicated by the two doted lines in Figure 2E.
- a window discriminator may be employed to reject very long pulses that are not physical. The amplitude is indicative of the presence of a particle.
- the circuit discriminates against high frequency short duration sharp electronic spikes 40 as represented by the pulse 51 as well as low frequency background emissions 38.
- FIGURE 3 An alternate method of detection is shown in FIGURE 3, wherein the signal from the photomultiplier tube 29 is applied to a current-to-voltage converter 52 which will generate a signal corresponding generally to that shown in FIGURE 2C. The signal can then be applied to pulse height discriminator 44 and pulse width discriminators 48 to provide an output indicative of the presence of particles.
- FIGURE 4 is a generalized block diagram of the processing circuitry which comprises the pulse height discrimination and pulse width discrimination 48 described above.
- FIGURE 5 there is shown a digital circuit for performing the pulse height and pulse width discrimination to detect valid bursts of photons from fluorescent particles.
- the output from the photomultiplier tube is amplified 56 and applied to the pulse height discriminator 57 to give a signal of the type shown in FIGURE 2B.
- the output of the pulse height discriminator is applied to a counter which is started by the first incoming pulse.
- the pulse also closes a gate 58 and starts a variable delay circuit 59 which is set to match the transit time of the molecule through the laser beam.
- the counter keeps counting until the variable delay circuit triggers the counter 61 to stop, reset the and counter, and opens the gate to allow a new delay cycle to start.
- a magnitude comparator 62 compares the number of counts which the counter generates over the delay period with a predetermined background value since the fluorescent bursts from particles have higher count rate than the background emission. If the number exceeds the predetermined background value, it is an indication of a molecule passed through the beam and one count is generated.
- the laser needs to be tightly focused and the spatial filter needs to define a probe volume that is small enough to have the probability of multiple molecules or particles occupying the volume negligible.
- the laser power needs to be chosen to provide the brightest fluorescence without generating excessive background emission.
- Equation (4) gives the fluorescence-per-molecule divided by the square root of the mean background-signal-per-transit time. This is a signal-to-noise ratio because we are interested in optimizing the signal (fluorescence-per-molecule) relative to the fluctuations in the background.
- the equation is: S/ ⁇ B (k ⁇ ) -1 ⁇ 2 [1 - exp[-k ⁇ /(k + 1) ⁇ ]
- the variable k is defined as k a /k f and ⁇ is defined as ⁇ t / ⁇ pd .
- the optimization of the experiment depends on the ratio of the excitation rate to the emission rate (k a /k f ) and on the ratio of the transit time to the photodestruction time ( ⁇ t / ⁇ pd ).
- a two-dimensional plot of S/ ⁇ B as a function of k and ⁇ is presented in FIGURE 6. This is a fundamental function which applies to all fluorophores.
- FIGURE 6 To optimize the conditions for a particular fluorophore it is only necessary to know the characteristic photodestruction time and the observed fluorescence lifetime.
- the dots on FIGURE 6 indicate the optimum S/ ⁇ B values at the optimum light intensities for transit times ⁇ from 0 to three.
- FIGURE 7 presents a plot of the optimal S/ ⁇ B as a function of the transit time. To perform an experiment, one simply selects the longest transit time that is practical for the experiment at hand and then selects the excitation intensity that gives maximum S/ ⁇ B at that transit time.
- FIGURES 1 and 2 The apparatus of FIGURES 1 and 2 was used to detect single-molecule fluorescence in a subpicomolar solution of monomers and dimers of B-phycoerythrin (PE).
- Argon laser 12 provided an excitation beam which was focused to a few ⁇ m spot size at the center of a flowing sample stream 17 contained in capillary tube 18.
- the flow velocity was chosen to give a transit time approximately equal to the photodestruction time for PE and the laser intensity was selected to give the optimal s/ ⁇ B as indicated in FIGURES 6 and 7.
- Fluorescence emission was collected by a microscope objective 24 and imaged onto a spatial filter 23.
- the spatial filter defined the probe volume and rejected scattering and fluorescence from the capillary walls.
- a fluorescence interference filter 27 was used to reject Rayleigh and Raman scattering.
- the fluorescence was detected with a photomultiplier tube and amplifier/discriminator.
- the fluorescence burst detector in FIGURE 2 was then used to record the number of
- FIGURE 8 presents the log of the number of single molecule events versus the log of the concentration of PE monomers and dimers.
- the regression lines of these two plots have a slope fairly close to one, 1.05 for the monomer data and 1.15 for the dimer data.
- the linear concentration dependence proves we are seeing single -molecule events.
- the dynamic range is limited by sampling time at low concentrations and by multiple occupancy at high concentrations. Higher than 10 -12 M, the mean will shift up due to the fluorescence around the probe volume.
- FIGURE 1 the fluid solution flows through the illuminated area whereby particles emit a burst of photons as they are in the volume. It is apparent that the illuminated areas may be moved over a surface or film on a substrate to locate and detect particles. The end effect is the same since the particles emit only for the transit time ⁇ during which they are illuminated. By moving the light beam relative to the surface or by moving the substrate such as on a slide or the like relative to the light beam, it is possible to scan the total area contained on the substrate or slide to locate or count particles.
- the solution can be carried on a substrate or a slide 67 as a think film 66, in filter paper or in a gel which can be moved by suitable X-Y drive means such as rack and pinions, stepper motors or the like.
- a light source 68 which may be a laser or the like, is focused onto the slide by a lens 69.
- the light passes through a beam-splitter 71 and impinges upon the sample solution.
- the photons emitted by the solution are reflected by the dichroic beam-splitter to the collection optics 72, spatial filter 73, spectral filter 74 and detector 76.
- the spatial filter defines the area which is being viewed and the spectral filter rejects scattered Rayleigh and Raman emissions.
- the signal is then processed by gating circuit 33, counted by counter 34 and applied to the computer at 36 as previously described.
- gating circuit 33 By controlling the X-Y drive the total film may be analyzed.
- the transit time ⁇ of the particles in the illuminated volume is controlled by the speed of movement of the stages.
- the area can be scanned as desired. Any of the signal processing electronic circuits described above can be employed to process the output of the detector and provides a particle identification output.
- FIGURE 10 shows another apparatus for scanning film 66 on a substrate 67. Rather than translating and moving the substrate, the substrate is stationary and the projected beam is scanned by a scanning mirror or assembly.
- a light source 78 projects a light beam 79 which passes through the dichroic beam-splitter 81 and is deflected by scanning mirror assembly 82 and focused by scan lens 83 onto the film 66.
- the emitted photon energy is collected by the scan lens deflected by the scanning mirror assembly to a beam-splitter 81 where it impinges upon the focusing and collecting optics 72, passes through the spatial filter 73, spectral filter 74 and is collected by a detector 76.
- the scanning mirror may comprise two scanning galvanometer mirrors which are deflected with signals applied to the galvanometer motors to deflect the mirrors.
- One mirror is moved rapidly in a first direction to scan across the sample and a second mirror with slower rate to advance the scan provides a raster scan of the type illustrated by the lines 84.
- the beam can be scanned slowly in the x-direction by a stepper motor or the like. Again the electronic currents associated with the detector provide the necessary signal discrimination to identify and detect single particles.
- FIGURE 11 the substrate 67 and film 66 are placed on a translation stage of the type described with reference to FIGURE 9.
- a light source 86 which provides energy to a dichroic beam-splitter 87, and the energy is focused by the lens 88 onto the film 66.
- the emitted energy is picked up by the lens 88, passed through the dichroic beam-splitter 87 through a spectral filter 89, focusing lens 91 and spatial filter 92 to the detector 93.
- the output signal from the detector is processed by the electronic circuit comprising electronic gating device 33, counter 34, and computer 36.
- the electronic and gating is based upon the fact that when a fluorescent molecule or particle is transiting through the illuminated volume either by motion of the particle or motion of the illuminated area, it is illuminated for a predetermined period of time and emits a burst of photons.
- This burst of photons can be distinguished from background emission by using the single particle burst detector of the present invention which responds to only when the photon bursts have the proper magnitude and duration or width.
Abstract
Description
- This invention was supported in part by grants from the National Science Foundation, the National Institutes of Health, and by the Director, Office of Energy Research, Office of Health and Environmental Research, Physical and Technological Research Division, of the U.S. Department of Energy.
- This invention relates generally to an apparatus and method for the detection of individual fluorescent particles down to the single molecule limit, and more particularly, to an apparatus and method for measuring the concentration of fluorescent particles or molecules in a fluid solution, or for locating and/or counting fluorescent particles or molecules on surfaces or in films.
- There is a need for sensitive apparatus and methods for the detection of individual molecules or particles. It is particularly important in medical and biological research to be able to measure the concentration, number or position of individual particles such as bacteria, viruses, and DNA fragments which are intrinsically fluorescent or can be labeled with fluorescent markers or probes.
- In the quest for enhanced sensitivity, Hirschfeld used evanescent-wave excitation to detect an antibody molecule labeled with 80 fluoresceins adsorbed on a glass slide.1 Using a flowing sample, Dovichi et al.2 achieved a detection limit of 22,000 rhodamine 6G molecules in a 1 s integration time, and Nguyen et al.3 extended this limit to 800 molecules with hydrodynamically-focused flows. Mathies and Stryer4 pointed out the limits imposed by photodestruction and detected three molecules of B-phycoerythrin (PE) in a probe volume of 10 pL. Recently, Nguyen et al. observed bursts of fluorescence when a 10·12 M solution of PE was flowed through a focused laser beam, and they interpreted these bursts as being due to the passage of individual molecules5. To detect single molecule fluorescence bursts, one must ensure that the probability of observing emission from two molecules simultaneously in the beam is negligible. In the distribution function, the probability of detecting zero counts during a given time interval from the fluorescent sample should differ from that of the solvent by less than 10%. A convenient test is that the mean count rate in the sample should increase by less than 10% compared to the blank. In the experiments of Nguyen et al., the most probable count rate with PE is double that in the blank and their probability for single occupancy (0.34) gives a double occupancy probability of 0.11. This indicates that Nguyen et al. Were observing bursts of fluoresence due to the simultaneous presence of two or more molecules in the imaged volume rather than the presence of single molecules.
11 Hirschfeld, T. (1976) Appl. Optics 15, 2965-2966.
2 Dovichi, N.J., Martin, J.C., Jett, J.H., Trkula, M. & Keller, R.A. (1984) Anal. Chem 56, 348-354.
3 Nguyen, d., Keller, R. & Trkula, M. (1987) J. Opt. Soc. Am. 4, 138-143.
4 Mathies, R.A. & Stryer, L. (1986) in Fluoresence in the Biological Sciences, eds. Taylor, D.L., Waggoner, A.S., Lanni, F., Murphy, R.F. & Birge, R. (Alan R. Liss, Inc., New York), 129-140.
5 Nguyen, D.C., Keller, R.A., Jett, J.H. & Martin, J.C. (1987) Anal.Chem 59, 2158-61. - U.S. Patent 4,778,593 teaches discrimination of minute particles, such as biological particles or organic polymers. The particles are suspended in a liquid with individual particles substantially separated from each other as they flow in a liquid stream. The particle stream is irradiated with a high-intensity light beam, and the stream is then formed into droplets, each of which contains a particle. The particles are discriminated in accordance with the change in light energy emitted by the particles over a period of time; that is, each particle emits light for a given time, depending on its size and characteristics. The particles are sorted by deflecting the droplets in accordance with the change in emitted energy.
- U.S. Patent 4,021,117 teaches a method of counting and analyzing pulses representative of characteristics of particles passing through a detection device. The amplitude of each pulse is detected, the area under each pulse above a reference level is determined and a ratio of amplitude-to-measured-area is obtained. The apparatus is used to discriminate against the passage of multiple particles through the sensing zone of the device.
- The prior art does not provide a method and apparatus which can provide rapid ultrasensitive detection and counting of fluorescent particles down to the single molecule limit, nor does the prior art provide a method for determining the optimal conditions to obtain this high detection sensitivity.
- It is an object of this invention to provide an apparatus and method for the quantitative detection of individual fluorescent particles in a solution down to the level of single molecules.
- It is another object of the invention to provide an apparatus for locating and counting fluorescent particles or fluorescent molecules on substrates.
- It is another object of this invention to provide an apparatus and method for detecting and quantitating individual particles in a solution or on a substrate in real time.
- It is a further object herein to provide an apparatus and method for the quantitative detection of individual, intrinsically fluorescent particles or particles tagged with fluorescent material.
- It is still another object of the invention to provide an apparatus and method in which individual particles in a fluid solution are illuminated with a beam of light and the light emitted from the particles and fluid is processed to provide a particle count.
- It is another object of this invention to provide an apparatus and method in which a fluid including fluorescent particles is illuminated, and fluorescence photon bursts from the particles are distinguished from background photon emission to provide an indication of particles.
- The foregoing and other objects of this invention are achieved by an apparatus and a method for detection of fluorescent particles in a fluid as defined by the claims.
- The foregoing and other objects of this invention will be more clearly understood from the following description, taken in conjunction with the accompanying drawings, of which:
- FIGURE 1 is a schematic diagram of the preferred embodiment of the present apparatus in which the particles are presented in a fluid stream.
- FIGURE 2 is a block diagram of the electronic gating circuit of FIGURE 1 showing the signal input and output at various points in the circuit.
- FIGURE 3 is another embodiment of the gating circuit of FIGURE 1.
- FIGURE 4 shows still another embodiment of the gating circuit of FIGURE 1.
- FIGURE 5 shows a digital circuit embodiment of the gating circuit.
- FIGURE 6 shows the laser intensity and particle transit time for optimum signal-to-noise conditions.
- FIGURE 7 is a plot of optimal signal-to-noise ratio at optimal laser intensities as a function of transit time.
- FIGURE 8 is a plot showing the results of operation of the apparatus of FIGURE 1.
- FIGURE 9 is a schematic block diagram of another embodiment of this invention for counting and locating fluorescent particles or molecules on a substrate.
- FIGURE 10 is a schematic diagram of still another embodiment of this invention for counting and locating fluorescent particles or molecules on a substrate.
- FIGURE 11 is a schematic diagram of a further embodiment of this invention for counting and locating fluorescent particles or molecules on a substrate.
- Referring now to FIGURE 1, a
laser beam 11 is projected by alaser 12 through apolarizer 13 and focused by alens 14 onto to the fluid stream as shown by the focusedbeam 16. The beam is focused onto flowingsample fluid stream 17 flowing in acapillary tube 18. Schematically shown is a flow control means 19 which serves to control the flow velocity of thestream 17. The laser polarization is oriented in the scattering plane by thepolarizer 13 to minimize background scattering. The laser beam illuminates thearea 21 shown in the enlargedview 22. An image of the illuminated volume is imaged onto aspatial filter 23 by theobjective lens 24. Thespatial filter 23 reduces the illuminated area and volume which is probed to the volume shown byreference number 26. The spatial filter defines the height and width of the probe volume. Aspectral filter 28 rejects scattered Rayleigh and Raman emission from the illuminated volume. The energy passing spatial and spectral filters is focused by a focusinglens 28 onto aphototransducer 29 which may be a photomultiplier tube or any other type of phototransducer having the requisite sensitivity. - When a
fluorescent particle 31 flows through and is irradiated by the laser beam, a burst of photons are generated. This burst of photons, together with the background emission, is detected by the photomultiplier tube which provides an output signal. This output signal is applied to anelectronic gating circuit 33 which is designed to look for bursts of particular amplitude and duration. The bursts of interest have a duration equal to the transit time through the volume and at least a minimum amplitude. When such a burst is detected, the resulting signal is applied to counter 34 and to acomputer 36, which can process and store the processed counts over predetermined times to provide an indication of concentration or other relevant information. - Referring to FIGURE 2, the output from the photomultiplier tube is shown in FIGURE 2A and is comprised of a plurality of photon bursts including both low
frequency background emission 38 representing Rayleigh and Raman scattering, and high frequency bursts 39 representing a particle traveling through the probe volume, andelectronic noise 40. The signal from the photomultiplier tube is supplied to apulse height discriminator 41 which passes pulses with predetermined amplitudes and then to a frequency tovoltage converter 42 which converts the frequency of pulses to avoltage 43. Thereafter, thevoltage 43 is applied to apulse height discriminator 44 which provides a pair ofoutput pulses voltage converter 48 receives the pulses and provides the output shown at 51, 52, FIGURE 2E. - A
pulse height discriminator 53 detects thepulses output pulse 54 when thepulse 52 exceeds a predetermined amplitude or lies within a predetermined range indicated by the two doted lines in Figure 2E. A window discriminator may be employed to reject very long pulses that are not physical. The amplitude is indicative of the presence of a particle. The circuit discriminates against high frequency short duration sharpelectronic spikes 40 as represented by thepulse 51 as well as lowfrequency background emissions 38. - An alternate method of detection is shown in FIGURE 3, wherein the signal from the
photomultiplier tube 29 is applied to a current-to-voltage converter 52 which will generate a signal corresponding generally to that shown in FIGURE 2C. The signal can then be applied topulse height discriminator 44 andpulse width discriminators 48 to provide an output indicative of the presence of particles. - FIGURE 4 is a generalized block diagram of the processing circuitry which comprises the pulse height discrimination and
pulse width discrimination 48 described above. - In FIGURE 5, there is shown a digital circuit for performing the pulse height and pulse width discrimination to detect valid bursts of photons from fluorescent particles. The output from the photomultiplier tube is amplified 56 and applied to the
pulse height discriminator 57 to give a signal of the type shown in FIGURE 2B. The output of the pulse height discriminator is applied to a counter which is started by the first incoming pulse. The pulse also closes agate 58 and starts avariable delay circuit 59 which is set to match the transit time of the molecule through the laser beam. The counter keeps counting until the variable delay circuit triggers thecounter 61 to stop, reset the and counter, and opens the gate to allow a new delay cycle to start. Amagnitude comparator 62 compares the number of counts which the counter generates over the delay period with a predetermined background value since the fluorescent bursts from particles have higher count rate than the background emission. If the number exceeds the predetermined background value, it is an indication of a molecule passed through the beam and one count is generated. - It is important in single particle or molecule detection to provide conditions which make the single particle or molecule event as bright as possible compared with the fluctuations in the background emission. In this regard, the laser needs to be tightly focused and the spatial filter needs to define a probe volume that is small enough to have the probability of multiple molecules or particles occupying the volume negligible. The laser power needs to be chosen to provide the brightest fluorescence without generating excessive background emission.
- In order to obtain the sensitivity necessary to detect single molecules by laser-induced fluorescence, incident laser excitation intensity and the transit time of the molecules through the laser beam must be controlled. Our theory and experiments show that the saturation of the excited state absorption and photochemical photodestruction place fundamental limits on the laser power and exposure time (transit time) that will give the best signal-to-noise ratio. To define the optimal conditions, it is useful to first define the relevant variables:
- (1) The observed fluorescence emission decay rate is defined as kf (in photon/sec);
- (2) The rate of excitation of the molecular absorption is given by ka (in photon/sec). This rate depends on the incident light intensity and on the optical absorption cross-section of the molecule.


- (3) The transit time of the molecule through the laser beam or the transit time of the beam over the molecule is given by τt = w/v (in sec) where w is the width of the laser beam and v is the velocity.
- (4) The characteristic photodestruction rate kpd (in sec-1) defines the first order rate at which the molecules are destroyed by light. It is related to the photodestruction quantum yield Φpd by

- Equation (4) below gives the fluorescence-per-molecule divided by the square root of the mean background-signal-per-transit time. This is a signal-to-noise ratio because we are interested in optimizing the signal (fluorescence-per-molecule) relative to the fluctuations in the background. The equation is:

- To optimize the conditions for a particular fluorophore it is only necessary to know the characteristic photodestruction time and the observed fluorescence lifetime. The dots on FIGURE 6 indicate the optimum S/√B values at the optimum light intensities for transit times τ from 0 to three. FIGURE 7 presents a plot of the optimal S/√B as a function of the transit time. To perform an experiment, one simply selects the longest transit time that is practical for the experiment at hand and then selects the excitation intensity that gives maximum S/√B at that transit time.
- The apparatus of FIGURES 1 and 2 was used to detect single-molecule fluorescence in a subpicomolar solution of monomers and dimers of B-phycoerythrin (PE).
Argon laser 12 provided an excitation beam which was focused to a few µm spot size at the center of a flowingsample stream 17 contained incapillary tube 18. The flow velocity was chosen to give a transit time approximately equal to the photodestruction time for PE and the laser intensity was selected to give the optimal s/√B as indicated in FIGURES 6 and 7. Fluorescence emission was collected by amicroscope objective 24 and imaged onto aspatial filter 23. The spatial filter defined the probe volume and rejected scattering and fluorescence from the capillary walls. Afluorescence interference filter 27 was used to reject Rayleigh and Raman scattering. The fluorescence was detected with a photomultiplier tube and amplifier/discriminator. The fluorescence burst detector in FIGURE 2 was then used to record the number of events in an on-line real time fashion. - FIGURE 8 presents the log of the number of single molecule events versus the log of the concentration of PE monomers and dimers.
- The regression lines of these two plots have a slope fairly close to one, 1.05 for the monomer data and 1.15 for the dimer data. The linear concentration dependence proves we are seeing single-molecule events. The dynamic range is limited by sampling time at low concentrations and by multiple occupancy at high concentrations. Higher than 10-12 M, the mean will shift up due to the fluorescence around the probe volume. These experiments were all performed at a sufficiently low concentration so that the probability for single occupancy was less than approximately .02. This further ensures that we are seeing single molecule events.
- In FIGURE 1 the fluid solution flows through the illuminated area whereby particles emit a burst of photons as they are in the volume. It is apparent that the illuminated areas may be moved over a surface or film on a substrate to locate and detect particles. The end effect is the same since the particles emit only for the transit time τ during which they are illuminated. By moving the light beam relative to the surface or by moving the substrate such as on a slide or the like relative to the light beam, it is possible to scan the total area contained on the substrate or slide to locate or count particles.
- Referring to FIGURE 9, the solution can be carried on a substrate or a
slide 67 as athink film 66, in filter paper or in a gel which can be moved by suitable X-Y drive means such as rack and pinions, stepper motors or the like. Light from alight source 68, which may be a laser or the like, is focused onto the slide by alens 69. The light passes through a beam-splitter 71 and impinges upon the sample solution. The photons emitted by the solution are reflected by the dichroic beam-splitter to thecollection optics 72,spatial filter 73,spectral filter 74 anddetector 76. As described above the spatial filter defines the area which is being viewed and the spectral filter rejects scattered Rayleigh and Raman emissions. The signal is then processed by gatingcircuit 33, counted bycounter 34 and applied to the computer at 36 as previously described. Thus this provides a fluorescent single particle scanner for use in connection with a slide or the like. By controlling the X-Y drive the total film may be analyzed. The transit time τ of the particles in the illuminated volume is controlled by the speed of movement of the stages. The area can be scanned as desired. Any of the signal processing electronic circuits described above can be employed to process the output of the detector and provides a particle identification output. - FIGURE 10 shows another apparatus for scanning
film 66 on asubstrate 67. Rather than translating and moving the substrate, the substrate is stationary and the projected beam is scanned by a scanning mirror or assembly. Referring to FIGURE 10, alight source 78 projects alight beam 79 which passes through the dichroic beam-splitter 81 and is deflected by scanningmirror assembly 82 and focused byscan lens 83 onto thefilm 66. The emitted photon energy is collected by the scan lens deflected by the scanning mirror assembly to a beam-splitter 81 where it impinges upon the focusing and collectingoptics 72, passes through thespatial filter 73,spectral filter 74 and is collected by adetector 76. The output then analyzed by theelectronic gating device 33, counter 34, and then tocomputer 36. The scanning mirror may comprise two scanning galvanometer mirrors which are deflected with signals applied to the galvanometer motors to deflect the mirrors. One mirror is moved rapidly in a first direction to scan across the sample and a second mirror with slower rate to advance the scan provides a raster scan of the type illustrated by the lines 84. Alternatively, the beam can be scanned slowly in the x-direction by a stepper motor or the like. Again the electronic currents associated with the detector provide the necessary signal discrimination to identify and detect single particles. - In FIGURE 11 the
substrate 67 andfilm 66 are placed on a translation stage of the type described with reference to FIGURE 9. Alight source 86 which provides energy to a dichroic beam-splitter 87, and the energy is focused by thelens 88 onto thefilm 66. The emitted energy is picked up by thelens 88, passed through the dichroic beam-splitter 87 through aspectral filter 89, focusinglens 91 andspatial filter 92 to thedetector 93. The output signal from the detector is processed by the electronic circuit comprisingelectronic gating device 33, counter 34, andcomputer 36. - It is apparent that in each of the above examples the electronic and gating is based upon the fact that when a fluorescent molecule or particle is transiting through the illuminated volume either by motion of the particle or motion of the illuminated area, it is illuminated for a predetermined period of time and emits a burst of photons. This burst of photons can be distinguished from background emission by using the single particle burst detector of the present invention which responds to only when the photon bursts have the proper magnitude and duration or width. While this invention has been described with reference to a specific embodiment, the description is illustrative of the invention and is not to be construed as limiting the invention. Various modifications and applications may occur to those skilled in the art without departing from the scope of the invention as defined by the appended claims.
Claims (8)
- An apparatus for detection of single fluorescent particles and/or molecules in a fluid which includes:means for illuminating a predetermined volume of the fluid;means for causing particles and/or molecules to pass through said illuminated volume whereby bursts of fluorescent energy are emitted by said particles and/or molecules responsive to the illumination as they pass through said volume; andmeans for detecting said bursts of fluorescent energy and providing an output signal characterised in that:
there is provided processing means for receiving said output signal, said processing means including means for detecting the amplitude and duration of said bursts and distinguishing said bursts of fluorescent energy from said particles and/or molecules from background energy or electronic noise, said processing means providing an indication of the detection of a particle and/or molecule passing through said volume. - Apparatus as in claim 1 in which said means for detecting the amplitude and duration of said bursts comprises a frequency-to-voltage converter, an analog signal, a pulse height discriminator for receiving said signal and providing output pulses having a pulse width equal to the time which the signal exceeds a predetermined value and a pulse width discriminator providing an output when the output pulse width exceeds a predetermined value indicative of the transit time of a particle.
- Apparatus as in claim 2 in which said pulse width discriminator includes a pulse width-to-voltage converter for receiving said output pulses and providing an output voltage having an amplitude dependent upon pulse width and a pulse height discriminator for detecting when the output voltage exceeds a predetermined amplitude or lies within a predetermined window.
- Apparatus as in claim 1 in which said means for detecting the amplitude and duration of said bursts comprises a current-to-voltage converter for receiving the output of said detecting means and providing an analog output signal, a pulse height discriminator for receiving said analog signal and providing output pulses having a pulse width equal to the time said signal exceeds a predetermined volume and a pulse width discriminator providing an output signal when the output pulse width exceeds a predetermined value or lies in a predetermined window or range indicative of the transit time of a particle through said volume.
- Apparatus as in claim 1 in which said means for detecting the amplitude and duration of said bursts comprises means for counting photons which are emitted over predetermined periods and providing an output signal indicative of a particle and/or molecule when the count exceeds a predetermined count.
- The method of detecting single fluorescent particles and/or molecules in a fluid including the steps ofilluminating a predetermined volume of the fluid,passing particles and/or molecules through said illuminated volume whereby to cause bursts of fluorescent energy to be emitted, anddetecting said energy and providing an output signal from the passing particles and/or molecules passing characterised in that:said signal is processed by:rejecting electrical signals representative of background energy andgenerating an output when electric signals have amplitude and duration corresponding to the transit time of particles and/or molecules through said volume to provide an indication of particles and/or molecules passing through said volume.
- The method as in claim 6 including the step of:
choosing the illuminating energy and the transit time of the particles and/or molecules through the predetermined volume to provide the optimal ratio of emitted energy from particles and/or molecules with respect to background energy or energy fluctuation. - The method of claim 7 in which said steps include employing fluorescence emission lifetime and fluorescence photodestruction time of fluorophores as determining factors.
Applications Claiming Priority (3)
| Application Number | Priority Date | Filing Date | Title |
|---|---|---|---|
| US07/358,782 US4979824A (en) | 1989-05-26 | 1989-05-26 | High sensitivity fluorescent single particle and single molecule detection apparatus and method |
| US358782 | 1989-05-26 | ||
| PCT/US1990/002702 WO1990014589A1 (en) | 1989-05-26 | 1990-05-21 | High sensitivity fluorescent single particle and single molecule detection apparatus and method |
Publications (3)
| Publication Number | Publication Date |
|---|---|
| EP0426829A1 EP0426829A1 (en) | 1991-05-15 |
| EP0426829A4 EP0426829A4 (en) | 1992-05-06 |
| EP0426829B1 true EP0426829B1 (en) | 1996-09-04 |
Family
ID=23411024
Family Applications (1)
| Application Number | Title | Priority Date | Filing Date |
|---|---|---|---|
| EP90908805A Expired - Lifetime EP0426829B1 (en) | 1989-05-26 | 1990-05-21 | High sensitivity fluorescent single particle and single molecule detection apparatus and method |
Country Status (7)
| Country | Link |
|---|---|
| US (1) | US4979824A (en) |
| EP (1) | EP0426829B1 (en) |
| JP (1) | JPH04500274A (en) |
| AT (1) | ATE142334T1 (en) |
| AU (1) | AU624047B2 (en) |
| DE (1) | DE69028370T2 (en) |
| WO (1) | WO1990014589A1 (en) |
Families Citing this family (100)
| Publication number | Priority date | Publication date | Assignee | Title |
|---|---|---|---|---|
| US5541061A (en) * | 1992-04-29 | 1996-07-30 | Affymax Technologies N.V. | Methods for screening factorial chemical libraries |
| JP2575270B2 (en) * | 1992-11-10 | 1997-01-22 | 浜松ホトニクス株式会社 | Method for determining base sequence of nucleic acid, method for detecting single molecule, apparatus therefor and method for preparing sample |
| FI96638C (en) * | 1992-11-17 | 1996-07-25 | Biohit Oy | "Inner filter" correction with a multifunction device based on a fluorescence meter |
| IL108497A0 (en) * | 1993-02-01 | 1994-05-30 | Seq Ltd | Methods and apparatus for dna sequencing |
| US5547849A (en) * | 1993-02-17 | 1996-08-20 | Biometric Imaging, Inc. | Apparatus and method for volumetric capillary cytometry |
| US6864048B2 (en) * | 1993-04-28 | 2005-03-08 | Affymetrix, Inc. | Factorial chemical libraries |
| US5439578A (en) * | 1993-06-03 | 1995-08-08 | The Governors Of The University Of Alberta | Multiple capillary biochemical analyzer |
| DE69530323T2 (en) * | 1994-09-02 | 2004-02-12 | BD Biosciences, Systems and Reagents, Inc., San Jose | METHOD AND DEVICE FOR CALIBRATING AN OPTICAL SCANNER |
| DE19649048C1 (en) * | 1996-11-27 | 1998-04-09 | Evotec Biosystems Gmbh | Particle identification method for enzyme-linked immunoassay using fast Fourier transform |
| DE69825601T2 (en) | 1997-02-12 | 2005-04-28 | Chan, Eugene Y, Brookline | METHOD FOR THE ANALYSIS OF POLYMERS |
| EP0988523B1 (en) * | 1997-06-09 | 2013-08-14 | EMD Millipore Corporation | Method and apparatus for detecting microparticles in fluid samples |
| US6710871B1 (en) | 1997-06-09 | 2004-03-23 | Guava Technologies, Inc. | Method and apparatus for detecting microparticles in fluid samples |
| US6049380A (en) * | 1997-11-12 | 2000-04-11 | Regents Of The University Of California | Single molecule identification using selected fluorescence characteristics |
| SE9800360D0 (en) * | 1998-02-06 | 1998-02-06 | Goeteborg University Science I | Method, apparatus and flow cell for high sensitivity detection of fluorescent molecules |
| US6780591B2 (en) | 1998-05-01 | 2004-08-24 | Arizona Board Of Regents | Method of determining the nucleotide sequence of oligonucleotides and DNA molecules |
| US7875440B2 (en) | 1998-05-01 | 2011-01-25 | Arizona Board Of Regents | Method of determining the nucleotide sequence of oligonucleotides and DNA molecules |
| AU770831B2 (en) * | 1998-07-30 | 2004-03-04 | Solexa Ltd. | Arrayed biomolecules and their use in sequencing |
| US20040106110A1 (en) * | 1998-07-30 | 2004-06-03 | Solexa, Ltd. | Preparation of polynucleotide arrays |
| US20100130368A1 (en) * | 1998-07-30 | 2010-05-27 | Shankar Balasubramanian | Method and system for sequencing polynucleotides |
| US6263286B1 (en) | 1998-08-13 | 2001-07-17 | U.S. Genomics, Inc. | Methods of analyzing polymers using a spatial network of fluorophores and fluorescence resonance energy transfer |
| DE19844931C1 (en) | 1998-09-30 | 2000-06-15 | Stefan Seeger | Procedures for DNA or RNA sequencing |
| ATE319857T1 (en) | 1998-12-14 | 2006-03-15 | Li Cor Inc | KIT AND METHOD FOR NUCLEIC ACID SEQUENCING OF INDIVIDUAL MOLECULES BY POLYMERASE SYNTHESIS |
| US6818395B1 (en) | 1999-06-28 | 2004-11-16 | California Institute Of Technology | Methods and apparatus for analyzing polynucleotide sequences |
| US6696022B1 (en) | 1999-08-13 | 2004-02-24 | U.S. Genomics, Inc. | Methods and apparatuses for stretching polymers |
| US6927065B2 (en) * | 1999-08-13 | 2005-08-09 | U.S. Genomics, Inc. | Methods and apparatus for characterization of single polymers |
| US6569685B1 (en) * | 1999-10-05 | 2003-05-27 | The Molecular Sciences Institute, Inc. | Protein fingerprint system and related methods |
| US20010038717A1 (en) * | 2000-01-27 | 2001-11-08 | Brown Carl S. | Flat-field, panel flattening, and panel connecting methods |
| JP2004516810A (en) | 2000-06-07 | 2004-06-10 | リ−コール インコーポレーティッド | Charge switch nucleotide |
| US6936702B2 (en) | 2000-06-07 | 2005-08-30 | Li-Cor, Inc. | Charge-switch nucleotides |
| US6447995B1 (en) * | 2000-10-04 | 2002-09-10 | Genvec, Inc. | Utilizing intrinsic fluorescence to detect adenovirus |
| WO2002044425A2 (en) | 2000-12-01 | 2002-06-06 | Visigen Biotechnologies, Inc. | Enzymatic nucleic acid synthesis: compositions and methods for altering monomer incorporation fidelity |
| WO2002061391A2 (en) * | 2001-01-31 | 2002-08-08 | The University Of Tennessee Research Corporation | Methods for detecting interaction of molecules with surface-bound reagents |
| US7297518B2 (en) | 2001-03-12 | 2007-11-20 | California Institute Of Technology | Methods and apparatus for analyzing polynucleotide sequences by asynchronous base extension |
| AU2002258997A1 (en) * | 2001-04-24 | 2002-11-05 | Li-Cor, Inc. | Polymerases with charge-switch activity and methods of generating such polymerases |
| US7118907B2 (en) * | 2001-06-06 | 2006-10-10 | Li-Cor, Inc. | Single molecule detection systems and methods |
| US7076092B2 (en) * | 2001-06-14 | 2006-07-11 | The United States Of America As Represented By The United States Department Of Energy | High-throughput, dual probe biological assays based on single molecule detection |
| US7393656B2 (en) * | 2001-07-10 | 2008-07-01 | The Board Of Trustees Of The Leland Stanford Junior University | Methods and compositions for risk stratification |
| WO2003067210A2 (en) | 2001-07-10 | 2003-08-14 | The Board Of Trustees Of The Leland Stanford Junior University | Methods and compositions for detecting the activation state of the multiple proteins in single cells |
| US7381535B2 (en) * | 2002-07-10 | 2008-06-03 | The Board Of Trustees Of The Leland Stanford Junior | Methods and compositions for detecting receptor-ligand interactions in single cells |
| US7695926B2 (en) | 2001-07-10 | 2010-04-13 | The Board Of Trustees Of The Leland Stanford Junior University | Methods and compositions for detecting receptor-ligand interactions in single cells |
| US20030110840A1 (en) * | 2001-07-24 | 2003-06-19 | Arriaga Edgar A. | Systems and methods for detecting a particle |
| US7016087B2 (en) * | 2001-08-08 | 2006-03-21 | Becton Dickinson And Company | Photon efficient scanner |
| US6750457B2 (en) * | 2001-08-29 | 2004-06-15 | Becton Dickinson And Company | System for high throughput analysis |
| JP2005527220A (en) * | 2002-05-28 | 2005-09-15 | ユー.エス. ジェノミクス, インコーポレイテッド | Method and apparatus using single polymer analysis |
| KR100473360B1 (en) * | 2002-07-31 | 2005-03-08 | 주식회사 디지탈바이오테크놀러지 | Method of automatically measuring a position and dimensions of a microchannel using laser reflection, apparatus using the method, and apparatus for detecting a microchannel using the method |
| AU2003298672A1 (en) * | 2002-11-19 | 2005-01-28 | Singulex, Inc. | Detection of target molecules through interaction with probes |
| WO2004092331A2 (en) * | 2003-04-08 | 2004-10-28 | Li-Cor, Inc. | Composition and method for nucleic acid sequencing |
| US20090088982A1 (en) * | 2003-07-31 | 2009-04-02 | Fukushima Noelle H | Co-detection of single polypeptide and polynucleotide molecules |
| US7317521B2 (en) * | 2003-09-18 | 2008-01-08 | Micron Technology, Inc. | Particle detection method |
| US20080021674A1 (en) * | 2003-09-30 | 2008-01-24 | Robert Puskas | Methods for Enhancing the Analysis of Particle Detection |
| US7169560B2 (en) * | 2003-11-12 | 2007-01-30 | Helicos Biosciences Corporation | Short cycle methods for sequencing polynucleotides |
| WO2005080605A2 (en) | 2004-02-19 | 2005-09-01 | Helicos Biosciences Corporation | Methods and kits for analyzing polynucleotide sequences |
| JP2008512084A (en) | 2004-05-25 | 2008-04-24 | ヘリコス バイオサイエンシーズ コーポレイション | Methods and devices for nucleic acid sequencing |
| US7476734B2 (en) | 2005-12-06 | 2009-01-13 | Helicos Biosciences Corporation | Nucleotide analogs |
| US7340957B2 (en) | 2004-07-29 | 2008-03-11 | Los Alamos National Security, Llc | Ultrasonic analyte concentration and application in flow cytometry |
| WO2006036182A2 (en) * | 2004-09-28 | 2006-04-06 | Singulex, Inc. | System and method for spectroscopic analysis of single particles |
| US7572640B2 (en) * | 2004-09-28 | 2009-08-11 | Singulex, Inc. | Method for highly sensitive detection of single protein molecules labeled with fluorescent moieties |
| US8685711B2 (en) * | 2004-09-28 | 2014-04-01 | Singulex, Inc. | Methods and compositions for highly sensitive detection of molecules |
| US9040305B2 (en) * | 2004-09-28 | 2015-05-26 | Singulex, Inc. | Method of analysis for determining a specific protein in blood samples using fluorescence spectrometry |
| US7220549B2 (en) | 2004-12-30 | 2007-05-22 | Helicos Biosciences Corporation | Stabilizing a nucleic acid for nucleic acid sequencing |
| US20070009923A1 (en) * | 2005-01-24 | 2007-01-11 | Massachusetts Institute Of Technology | Use of bayesian networks for modeling cell signaling systems |
| US7482120B2 (en) | 2005-01-28 | 2009-01-27 | Helicos Biosciences Corporation | Methods and compositions for improving fidelity in a nucleic acid synthesis reaction |
| US7307721B2 (en) * | 2005-04-13 | 2007-12-11 | Brightwell Technologies | Particle imaging system with a varying flow rate |
| US7666593B2 (en) | 2005-08-26 | 2010-02-23 | Helicos Biosciences Corporation | Single molecule sequencing of captured nucleic acids |
| US7998717B2 (en) * | 2005-12-02 | 2011-08-16 | Pacific Biosciences Of California, Inc. | Mitigation of photodamage in analytical reactions |
| EP3156799B1 (en) | 2006-04-04 | 2024-01-24 | Novilux, LLC | Analyzer and method for highly sensitive detection of analytes |
| EP3495822B1 (en) | 2006-04-04 | 2023-12-20 | Novilux, LLC | Method for assessing acute myocardial infarction based on highly sensitive analysis of cardiac troponin |
| US7838250B1 (en) | 2006-04-04 | 2010-11-23 | Singulex, Inc. | Highly sensitive system and methods for analysis of troponin |
| US8124943B1 (en) * | 2006-04-06 | 2012-02-28 | Lugade Ananda G | Methods and systems for altering fluorescent intensities of a plurality of particles |
| US20100032584A1 (en) * | 2006-08-18 | 2010-02-11 | Macquarie University | Tiime gated fluorescent flow cytometer |
| US7835000B2 (en) * | 2006-11-03 | 2010-11-16 | Los Alamos National Security, Llc | System and method for measuring particles in a sample stream of a flow cytometer or the like |
| US7804594B2 (en) * | 2006-12-29 | 2010-09-28 | Abbott Laboratories, Inc. | Method and apparatus for rapidly counting and identifying biological particles in a flow stream |
| WO2008122051A1 (en) | 2007-04-02 | 2008-10-09 | Acoustic Cytometry Systems, Inc. | Methods and devices for enhanced analysis of field focused cells and particles |
| US7837040B2 (en) * | 2007-04-09 | 2010-11-23 | Los Alamos National Security, Llc | Acoustic concentration of particles in fluid flow |
| US8083068B2 (en) | 2007-04-09 | 2011-12-27 | Los Alamos National Security, Llc | Apparatus for separating particles utilizing engineered acoustic contrast capture particles |
| FR2917842A1 (en) * | 2007-06-19 | 2008-12-26 | Commissariat Energie Atomique | DEVICE AND METHOD FOR COUNTING ELEMENTARY PARTICLES EMITTED BY A FLUID IN A CONDUIT. |
| WO2009029550A2 (en) * | 2007-08-24 | 2009-03-05 | Singulex, Inc. | Highly sensitive system and methods for analysis of prostate specific antigen (psa) |
| US8263407B2 (en) | 2007-10-24 | 2012-09-11 | Los Alamos National Security, Llc | Method for non-contact particle manipulation and control of particle spacing along an axis |
| US8528406B2 (en) | 2007-10-24 | 2013-09-10 | Los Alamos National Security, LLP | Method for non-contact particle manipulation and control of particle spacing along an axis |
| US8159670B2 (en) | 2007-11-05 | 2012-04-17 | Abbott Laboratories | Method and apparatus for rapidly counting and identifying biological particles in a flow stream |
| US8266950B2 (en) | 2007-12-19 | 2012-09-18 | Los Alamos National Security, LLP | Particle analysis in an acoustic cytometer |
| US7914734B2 (en) | 2007-12-19 | 2011-03-29 | Singulex, Inc. | Scanning analyzer for single molecule detection and methods of use |
| US8714014B2 (en) | 2008-01-16 | 2014-05-06 | Life Technologies Corporation | System and method for acoustic focusing hardware and implementations |
| US20090234202A1 (en) * | 2008-03-05 | 2009-09-17 | Goix Philippe J | Method and compositions for highly sensitive detection of molecules |
| US20090291458A1 (en) * | 2008-05-22 | 2009-11-26 | Nodality, Inc. | Method for Determining the Status of an Individual |
| US8227202B2 (en) | 2008-07-10 | 2012-07-24 | Nodality, Inc. | Methods for diagnosis, prognosis and methods of treatment |
| US8399206B2 (en) | 2008-07-10 | 2013-03-19 | Nodality, Inc. | Methods for diagnosis, prognosis and methods of treatment |
| GB2464183A (en) * | 2008-09-19 | 2010-04-14 | Singulex Inc | Sandwich assay |
| US8450069B2 (en) * | 2009-06-08 | 2013-05-28 | Singulex, Inc. | Highly sensitive biomarker panels |
| WO2011108371A1 (en) * | 2010-03-01 | 2011-09-09 | オリンパス株式会社 | Optical analysis device, optical analysis method, and computer program for optical analysis |
| EP2566971B1 (en) | 2010-05-06 | 2019-03-27 | Singulex, Inc. | Methods for diagnosing, staging, predicting risk for developing and identifying treatment responders for rheumatoid arthritis |
| US8834847B2 (en) | 2010-08-12 | 2014-09-16 | Pacific Biosciences Of California, Inc. | Photodamage mitigation compounds and systems |
| JP5856983B2 (en) | 2011-01-20 | 2016-02-10 | オリンパス株式会社 | Optical analysis method and optical analysis apparatus using light detection from single luminescent particles |
| KR101482372B1 (en) * | 2011-06-29 | 2015-01-13 | 파나소닉 주식회사 | Manufacturing method of light emitting device and manufacturing apparatus of light emitting device |
| CN103765196B (en) | 2011-08-26 | 2016-03-02 | 奥林巴斯株式会社 | The light analytical equipment utilizing single incandescnet particle to detect and light analytical approach |
| EP2752655A4 (en) | 2011-08-30 | 2015-06-17 | Olympus Corp | Method for detecting target particles |
| EP3211402B1 (en) | 2011-12-05 | 2018-07-11 | Rion Co., Ltd. | Viable particle counter and dialysis fluid monitoring system |
| US9028776B2 (en) | 2012-04-18 | 2015-05-12 | Toxic Report Llc | Device for stretching a polymer in a fluid sample |
| WO2015015951A1 (en) | 2013-07-31 | 2015-02-05 | オリンパス株式会社 | Optical microscope device, microscopy method, and computer program for microscopy using single-light-emitting-particle detection technology |
| JPWO2017098597A1 (en) | 2015-12-09 | 2018-10-11 | オリンパス株式会社 | Optical analysis method and optical analysis apparatus using single luminescent particle detection |
Family Cites Families (8)
| Publication number | Priority date | Publication date | Assignee | Title |
|---|---|---|---|---|
| GB696675A (en) * | 1950-02-17 | 1953-09-09 | Ici Ltd | Improvements in and relating to methods of, and apparatus for, determining the concentration of particulate matter contained in liquid suspensions or colloidal solutionsor of solutes in true solutions |
| US3536898A (en) * | 1967-12-04 | 1970-10-27 | Us Navy | Detection device |
| US4021117A (en) * | 1975-08-07 | 1977-05-03 | Hildegard Gohde | Process for automatic counting and measurement of particles |
| US4573798A (en) * | 1981-09-16 | 1986-03-04 | Toshiba Kikai Kabushiki Kaisha | Method and apparatus for measuring pattern area percentage for engraving films |
| JPS59174742A (en) * | 1983-03-25 | 1984-10-03 | Agency Of Ind Science & Technol | Method and apparatus for dividing and sorting fine particle |
| US4573796A (en) * | 1984-01-06 | 1986-03-04 | The United States Of America As Represented By The United States Department Of Energy | Apparatus for eliminating background interference in fluorescence measurements |
| US4793705A (en) * | 1987-10-07 | 1988-12-27 | The United States Of America As Represented By The United States Department Of Energy | Single molecule tracking |
| FR2628530B1 (en) * | 1988-03-08 | 1994-01-28 | Chemunex Sa | APPARATUS AND METHOD FOR DETECTION AND NUMERATION OF FLUORESCENT PARTICLES, CARRIED BY A SOLID SUPPORT |
-
1989
- 1989-05-26 US US07/358,782 patent/US4979824A/en not_active Expired - Lifetime
-
1990
- 1990-05-21 WO PCT/US1990/002702 patent/WO1990014589A1/en active IP Right Grant
- 1990-05-21 DE DE69028370T patent/DE69028370T2/en not_active Expired - Lifetime
- 1990-05-21 AT AT90908805T patent/ATE142334T1/en not_active IP Right Cessation
- 1990-05-21 AU AU56776/90A patent/AU624047B2/en not_active Expired
- 1990-05-21 EP EP90908805A patent/EP0426829B1/en not_active Expired - Lifetime
- 1990-05-21 JP JP2508232A patent/JPH04500274A/en active Pending
Also Published As
| Publication number | Publication date |
|---|---|
| US4979824A (en) | 1990-12-25 |
| AU5677690A (en) | 1990-12-18 |
| EP0426829A1 (en) | 1991-05-15 |
| DE69028370T2 (en) | 1997-03-13 |
| ATE142334T1 (en) | 1996-09-15 |
| DE69028370D1 (en) | 1996-10-10 |
| WO1990014589A1 (en) | 1990-11-29 |
| AU624047B2 (en) | 1992-05-28 |
| JPH04500274A (en) | 1992-01-16 |
| EP0426829A4 (en) | 1992-05-06 |
Similar Documents
| Publication | Publication Date | Title |
|---|---|---|
| EP0426829B1 (en) | High sensitivity fluorescent single particle and single molecule detection apparatus and method | |
| US5633503A (en) | Particle analyzer | |
| US8524489B2 (en) | Particle or cell analyzer and method | |
| EP0713087B1 (en) | Apparatus and process for rapid and ultrasensitive detection and counting of microorganisms by fluorescence | |
| US6177277B1 (en) | Flow fluorometric method | |
| US5028545A (en) | Biospecific multianalyte assay method | |
| US5026159A (en) | Area-modulated luminescence (AML) | |
| US5547849A (en) | Apparatus and method for volumetric capillary cytometry | |
| EP0713086B1 (en) | Apparatus and process for the detection and counting of rarely occurring mammalian cells | |
| Dietz et al. | Volumetric capillary cytometry: a new method for absolute cell enumeration | |
| JP2002535614A (en) | Apparatus and method for improved flow cytometry | |
| JP2001509255A (en) | Method and apparatus for determining predetermined properties of target particles in a sample medium | |
| US5190857A (en) | Optical method for measuring an analyte using area-modulated luminescence | |
| JP2648376B2 (en) | Apparatus and method for detecting and counting microorganisms | |
| EP1936359A2 (en) | System and Method for Removing Auto-Fluorescence Through The Use Of Multiple Detection Channels | |
| Belen kii et al. | Analytical monitoring devices based on combined capillary electrophoresis and fluorescence | |
| JPH02145941A (en) | Cell analyzer | |
| JPH046440A (en) | Particle analyzer |
Legal Events
| Date | Code | Title | Description |
|---|---|---|---|
| PUAI | Public reference made under article 153(3) epc to a published international application that has entered the european phase |
Free format text: ORIGINAL CODE: 0009012 |
|
| 17P | Request for examination filed |
Effective date: 19910212 |
|
| AK | Designated contracting states |
Kind code of ref document: A1 Designated state(s): AT BE CH DE DK ES FR GB IT LI LU NL SE |
|
| A4 | Supplementary search report drawn up and despatched |
Effective date: 19920316 |
|
| AK | Designated contracting states |
Kind code of ref document: A4 Designated state(s): AT BE CH DE DK ES FR GB IT LI LU NL SE |
|
| 17Q | First examination report despatched |
Effective date: 19941222 |
|
| GRAH | Despatch of communication of intention to grant a patent |
Free format text: ORIGINAL CODE: EPIDOS IGRA |
|
| GRAH | Despatch of communication of intention to grant a patent |
Free format text: ORIGINAL CODE: EPIDOS IGRA |
|
| GRAA | (expected) grant |
Free format text: ORIGINAL CODE: 0009210 |
|
| ITF | It: translation for a ep patent filed |
Owner name: FUMERO BREVETTI S.N.C. |
|
| AK | Designated contracting states |
Kind code of ref document: B1 Designated state(s): AT BE CH DE DK ES FR GB IT LI LU NL SE |
|
| PG25 | Lapsed in a contracting state [announced via postgrant information from national office to epo] |
Ref country code: NL Free format text: LAPSE BECAUSE OF FAILURE TO SUBMIT A TRANSLATION OF THE DESCRIPTION OR TO PAY THE FEE WITHIN THE PRESCRIBED TIME-LIMIT Effective date: 19960904 Ref country code: LI Effective date: 19960904 Ref country code: BE Effective date: 19960904 Ref country code: AT Effective date: 19960904 Ref country code: CH Effective date: 19960904 Ref country code: DK Effective date: 19960904 Ref country code: ES Free format text: THE PATENT HAS BEEN ANNULLED BY A DECISION OF A NATIONAL AUTHORITY Effective date: 19960904 |
|
| REF | Corresponds to: |
Ref document number: 142334 Country of ref document: AT Date of ref document: 19960915 Kind code of ref document: T |
|
| REF | Corresponds to: |
Ref document number: 69028370 Country of ref document: DE Date of ref document: 19961010 |
|
| ET | Fr: translation filed | ||
| PG25 | Lapsed in a contracting state [announced via postgrant information from national office to epo] |
Ref country code: SE Effective date: 19961204 |
|
| NLV1 | Nl: lapsed or annulled due to failure to fulfill the requirements of art. 29p and 29m of the patents act | ||
| REG | Reference to a national code |
Ref country code: CH Ref legal event code: PL |
|
| PG25 | Lapsed in a contracting state [announced via postgrant information from national office to epo] |
Ref country code: LU Free format text: LAPSE BECAUSE OF NON-PAYMENT OF DUE FEES Effective date: 19970531 |
|
| PLBE | No opposition filed within time limit |
Free format text: ORIGINAL CODE: 0009261 |
|
| STAA | Information on the status of an ep patent application or granted ep patent |
Free format text: STATUS: NO OPPOSITION FILED WITHIN TIME LIMIT |
|
| 26N | No opposition filed | ||
| REG | Reference to a national code |
Ref country code: GB Ref legal event code: IF02 |
|
| PGFP | Annual fee paid to national office [announced via postgrant information from national office to epo] |
Ref country code: IT Payment date: 20090528 Year of fee payment: 20 Ref country code: FR Payment date: 20090528 Year of fee payment: 20 |
|
| PGFP | Annual fee paid to national office [announced via postgrant information from national office to epo] |
Ref country code: DE Payment date: 20090715 Year of fee payment: 20 Ref country code: GB Payment date: 20090526 Year of fee payment: 20 |
|
| PG25 | Lapsed in a contracting state [announced via postgrant information from national office to epo] |
Ref country code: GB Free format text: LAPSE BECAUSE OF EXPIRATION OF PROTECTION Effective date: 20100520 |
|
| PG25 | Lapsed in a contracting state [announced via postgrant information from national office to epo] |
Ref country code: DE Free format text: LAPSE BECAUSE OF EXPIRATION OF PROTECTION Effective date: 20100521 |